Evidence for oscillation of atmospheric neutrinos
The Super-Kamiokande Collaboration
Y.Fukudaa, T.Hayakawaa, E.Ichiharaa, K.Inouea, K.Ishiharaa, H.Ishinoa, Y.Itowa, T.Kajitaa, J.Kamedaa, S.Kasugaa, K.Kobayashia, Y.Kobayashia, Y.Koshioa, M.Miuraa, M.Nakahataa, S.Nakayamaa, A.Okadaa, K.Okumuraa, N.Sakuraia, M.Shiozawaa, Y.Suzukia, Y.Takeuchia, Y.Totsukaa, S.Yamadaa, M.Earlb, A.Habigb, E.Kearnsb, M.D.Messierb, K.Scholbergb, J.L.Stoneb, L.R.Sulakb, C.W.Walterb, M.Goldhaberc, T.Barszczakd, D.Casperd, W.Gajewskid, P.G.Halversond,∗, J.Hsud, W.R.Kroppd, L.R. Priced, F.Reinesd, M.Smyd, H.W.Sobeld, M.R.Vaginsd, K.S.Ganezere, W.E.Keige, R.W.Ellsworthf, S.Tasakag, J.W.Flanaganh,† A.Kibayashih, J.G.Learnedh, S.Matsunoh, V.J.Stengerh, D.Takemorih, T.Ishiii, J.Kanzakii, T.Kobayashii, S.Minei, K.Nakamurai, K.Nishikawai, Y.Oyamai, A.Sakaii, M.Sakudai, O.Sasakii, S.Echigoj, M.Kohamaj, A.T.Suzukij, T.J.Hainesk,d E.Blaufussl, B.K.Kiml, R.Sanfordl, R.Svobodal, M.L.Chenm, Z.Connerm,‡ J.A.Goodmanm, G.W.Sullivanm, J.Hilln, C.K.Jungn, K.Martensn, C.Maugern, C.McGrewn, E.Sharkeyn, B.Virenn, C.Yanagisawan, W.Dokio, K.Miyanoo, H.Okazawao, C.Sajio, M.Takahatao, Y.Nagashimap, M.Takitap, T.Yamaguchip, M.Yoshidap, S.B.Kimq, M.Etohr, K.Fujitar, A.Hasegawar, T.Hasegawar, S.Hatakeyamar, T.Iwamotor, M.Kogar, T.Maruyamar, H.Ogawar, J.Shirair, A.Suzukir, F.Tsushimar, M.Koshibas, M.Nemotot, K.Nishijimat, T.Futagamiu, Y.Hayatou,§, Y.Kanayau, K.Kaneyukiu, Y.Watanabeu, D.Kielczewskav,d, R.A.Doylew, J.S.Georgew, A.L.Stachyraw, L.L.Waiw,¶, R.J.Wilkesw, K.K.Youngw
aInstitute for Cosmic Ray Research, University of Tokyo, Tanashi,
Tokyo 188-8502, Japan
bDepartment of Physics, Boston University, Boston, MA 02215, USA
cPhysics Department, Brookhaven National Laboratory, Upton, NY 11973, USA
dDepartment of Physics and Astronomy, University of California, Irvine,
Irvine, CA 92697-4575, USA
eDepartment of Physics, California State University,
Dominguez Hills, Carson, CA 90747, USA
fDepartment of Physics, George Mason University, Fairfax, VA 22030, USA
gDepartment of Physics, Gifu University, Gifu, Gifu 501-1193, Japan
hDepartment of Physics and Astronomy, University of Hawaii,
Honolulu, HI 96822, USA
iInstitute of Particle and Nuclear Studies, High Energy Accelerator
Research Organization (KEK), Tsukuba, Ibaraki 305-0801, Japan
jDepartment of Physics, Kobe University, Kobe, Hyogo 657-8501, Japan
kPhysics Division, P-23, Los Alamos National Laboratory,
Los Alamos, NM 87544, USA.
lDepartment of Physics and Astronomy, Louisiana State University,
Baton Rouge, LA 70803, USA
mDepartment of Physics, University of Maryland,
College Park, MD 20742, USA
nDepartment of Physics and Astronomy, State University of New York,
Stony Brook, NY 11794-3800, USA
oDepartment of Physics, Niigata University,
Niigata, Niigata 950-2181, Japan
pDepartment of Physics, Osaka University, Toyonaka, Osaka 560-0043, Japan
qDepartment of Physics, Seoul National University, Seoul 151-742, Korea
rDepartment of Physics, Tohoku University, Sendai, Miyagi 980-8578, Japan
sThe University of Tokyo, Tokyo 113-0033, Japan
tDepartment of Physics, Tokai University, Hiratsuka, Kanagawa 259-1292,
Japan
uDepartment of Physics, Tokyo Institute for Technology, Meguro,
Tokyo 152-8551, Japan
vInstitute of Experimental Physics, Warsaw University, 00-681 Warsaw,
Poland
wDepartment of Physics, University of Washington,
Seattle, WA 98195-1560, USA
Abstract
We present an analysis of atmospheric neutrino data from a 33.0 kiloton-year (535-day) exposure of the Super–Kamiokande detector. The data exhibit a zenith angle dependent deficit of muon neutrinos which is inconsistent with expectations based on calculations of the atmospheric neutrino flux. Experimental biases and uncertainties in the prediction of neutrino fluxes and cross sections are unable to explain our observation. The data are consistent, however, with two-flavor oscillations with and eV2 at 90% confidence level.
Atmospheric neutrinos are produced as decay products in hadronic showers resulting from collisions of cosmic rays with nuclei in the upper atmosphere. Production of electron and muon neutrinos is dominated by the processes followed by (and their charge conjugates) giving an expected ratio () of the flux of to the flux of of about two. The ratio has been calculated in detail with an uncertainty of less than 5% over a broad range of energies from 0.1 GeV to 10 GeV [8, 9].
The flux ratio is measured in deep underground experiments by observing final-state leptons produced via charged-current interactions of neutrinos on nuclei, . The flavor of the final state lepton is used to identify the flavor of the incoming neutrino.
The measurements are reported as , where and are the number of muon-like (-like) and electron-like (-like) events observed in the detector for both data and Monte Carlo simulation. This ratio largely cancels experimental and theoretical uncertainties, especially the uncertainty in the absolute flux. is expected if the physics in the Monte Carlo simulation accurately models the data. Measurements of significantly small values of have been reported by the deep underground water Cherenkov detectors Kamiokande[10, 11], IMB[12], and recently by Super–Kamiokande [13, 14]. Although measurements of by early iron-calorimeter experiments Fréjus[15] and NUSEX[16] with smaller data samples were consistent with expectations, the Soudan-2 iron-calorimeter experiment has reported observation of a small value of [17].
Neutrino oscillations have been suggested to explain measurements of small values of . For a two-neutrino oscillation hypothesis, the probability for a neutrino produced in flavor state to be observed in flavor state after traveling a distance through a vacuum is:
| (1) |
where is the neutrino energy, is the mixing angle between the flavor eigenstates and the mass eigenstates, and is the mass-squared difference of the neutrino mass eigenstates. For detectors near the surface of the Earth, the neutrino flight distance, and thus the oscillation probability, is a function of the zenith angle of the neutrino direction. Vertically downward-going neutrinos travel about 15 km while vertically upward-going neutrinos travel about 13,000 km before interacting in the detector. The broad energy spectrum and this range of neutrino flight distances makes measurements of atmospheric neutrinos sensitive to neutrino oscillations with down to eV2. The zenith angle dependence of measured by the Kamiokande experiment at high energies has been cited as evidence for neutrino oscillations[11].
We present our analysis of 33.0 kiloton-years (535 days) of atmospheric neutrino data from Super–Kamiokande. In addition to measurements of small values of both above and below 1 GeV, we observed a significant zenith angle dependent deficit of -like events. While no combination of known uncertainties in the experimental measurement or predictions of atmospheric neutrino fluxes is able to explain our data, a two-neutrino oscillation model of , where may be or a new, non-interacting “sterile” neutrino, is consistent with the observed flavor ratios and zenith angle distributions over the entire energy region.
Super–Kamiokande is a 50 kiloton water Cherenkov detector instrumented with 11,146 photomultiplier tubes (PMTs) facing an inner 22.5 kiloton fiducial volume of ultra-pure water. Interaction kinematics are reconstructed using the time and charge of each PMT signal. The inner volume is surrounded by a 2 meter thick outer detector instrumented with 1885 outward-facing PMTs. The outer detector is used to veto entering particles and to tag exiting tracks.
Super–Kamiokande has collected a total of 4353 fully-contained (FC) events and 301 partially-contained (PC) events in a 33.0 kiloton-year exposure. FC events deposit all of their Cherenkov light in the inner detector while PC events have exiting tracks which deposit some Cherenkov light in the outer detector. For this analysis, the neutrino interaction vertex was required to have been reconstructed within the 22.5 kiloton fiducial volume, defined to be m from the PMT wall.
FC events were separated into those with a single visible Cherenkov ring and those with multiple Cherenkov rings. For the analysis of FC events, only single-ring events were used. Single-ring events were identified as -like or -like based on a likelihood analysis of light detected around the Cherenkov cone. The FC events were separated into “sub-GeV” ( MeV) and “multi-GeV” ( MeV) samples, where is defined to be the energy of an electron that would produce the observed amount of Cherenkov light. MeV corresponds to MeV.
In a full-detector Monte Carlo simulation, 88% (96%) of the sub-GeV -like (-like) events were () charged-current interactions and 84% (99%) of the multi-GeV -like (-like) events were () charged-current interactions. PC events were estimated to be 98% charged-current interactions; hence, all PC events were classified as -like, and no single-ring requirement was made. Table I summarizes the number of observed events for both data and Monte Carlo as well as the values for the sub-GeV and multi-GeV samples. Further details of the detector, data selection and event reconstruction used in this analysis are given elsewhere[13, 14].
| Data | Monte Carlo | ||
|---|---|---|---|
| sub-GeV | |||
| single-ring | 2389 | 2622.6 | |
| -like | 1231 | 1049.1 | |
| -like | 1158 | 1573.6 | |
| multi-ring | 911 | 980.7 | |
| total | 3300 | 3603.3 | |
| multi-GeV | |||
| single-ring | 520 | 531.7 | |
| -like | 290 | 236.0 | |
| -like | 230 | 295.7 | |
| multi-ring | 533 | 560.1 | |
| total | 1053 | 1091.8 | |
| partially-contained | 301 | 371.6 | |
We have measured significantly small values of in both the sub-GeV and multi-GeV samples. Several sources of systematic uncertainties in these measurements have been considered. Cosmic ray induced interactions in the rock surrounding the detector have been suggested as a source of -like contamination from neutrons, which could produce small values [18], but these backgrounds have been shown to be insignificant for large water Cherenkov detectors[19]. In particular, Super–Kamiokande has 4.7 meters of water surrounding the fiducial volume; this distance corresponds to roughly 5 hadronic interaction lengths and 13 radiation lengths. Distributions of event vertices exhibit no excess of -like events close to the fiducial boundary[13, 14].
The prediction of the ratio of the flux to the flux is dominated by the well-understood decay chain of mesons and contributes less than 5% to the uncertainty in . Different neutrino flux models vary by about 20% in the prediction of absolute rates, but the ratio is robust[20]. Uncertainties in due to a difference in cross sections for and have been studied[21]; however, lepton universality prevents any significant difference in cross-sections at energies much above the muon mass and thus errors in cross-sections could not produce a small value of in the multi-GeV energy range. Particle identification was estimated to be efficient for both -like and -like events based on Monte Carlo studies. Particle identification was also tested in Super–Kamiokande on Michel electrons and stopping cosmic-ray muons and the -like and -like events used in this analysis are clearly separated[13]. The particle identification programs in use have also been tested using beams of electrons and muons incident on a water Cherenkov detector at KEK[22]. The data have been analyzed independently by two groups, making the possibility of significant biases in data selection or event reconstruction algorithms remote[13, 14]. Other explanations for the small value of , such as contributions from nucleon decays [23], can be discounted as they would not contribute to the zenith angle effects described below.
We estimate the probability that the observed ratios could be due to statistical fluctuation is less than 0.001% for sub-GeV and less than 1% for multi-GeV .
The -like data exhibit a strong asymmetry in zenith angle () while no significant asymmetry is observed in the -like data [14]. The asymmetry is defined as where is the number of upward-going events () and is the number of downward-going events (). The asymmetry is expected to be near zero independent of flux model for GeV, above which effects due to the Earth’s magnetic field on cosmic rays are small. Based on a comparison of results from our full Monte Carlo simulation using different flux models[8, 9] as inputs, treatment of geomagnetic effects results in an uncertainty of roughly in the expected asymmetry of -like and -like sub-GeV events and less than for multi-GeV events. Studies of decay electrons from stopping muons show at most a up-down difference in Cherenkov light detection[24].
Figure 1 shows as a function of momentum for both -like and -like events. In the present data, the asymmetry as a function of momentum for -like events is consistent with expectations, while the -like asymmetry at low momentum is consistent with zero but significantly deviates from expectation at higher momentum. The average angle between the final state lepton direction and the incoming neutrino direction is at MeV/ and at 1.5 GeV/. At the lower momenta in Fig. 1, the possible asymmetry of the neutrino flux is largely washed out. We have found no detector bias differentiating -like and -like events that could explain an asymmetry in -like events but not in -like events [14].
Considering multi-GeV (FC+PC) muons alone, the measured asymmetry, deviates from zero by more than 6 standard deviations.
We have examined the hypotheses of two-flavor and oscillation models using a comparison of data and Monte Carlo, allowing all important Monte Carlo parameters to vary weighted by their expected uncertainties.
The data were binned by particle type, momentum, and . A is defined as:
| (2) |
where the sum is over five bins equally spaced in and seven momentum bins for both -like events and -like plus PC events (70 bins total). The statistical error, , accounts for both data statistics and the weighted Monte Carlo statistics. is the measured number of events in each bin. is the weighted sum of Monte Carlo events:
| (3) |
and are the data and Monte Carlo live-times. For each Monte Carlo event, the weight is given by:
| (5) | |||||
| (11) |
is the average neutrino energy in the momentum bin; is an arbitrary reference energy (taken to be 2 GeV); () is the up-down uncertainty of the event rate in the sub-GeV (multi-GeV) energy range; is the total number of Monte Carlo PC events; is the total number of Monte Carlo FC multi-GeV muons. The factor weights an event accounting for the initial neutrino fluxes (in the case of ), oscillation parameters and . The meaning of the Monte Carlo fit parameters, and (, , , , , , and their assigned uncertainties, , are summarized in Table II. The over-all normalization, , was allowed to vary freely. The uncertainty in the Monte Carlo ratio () was conservatively estimated based on the uncertainty in absolute energy scale, uncertainty in neutrino-lepton angular and energy correlations, and the uncertainty in production height. The oscillation simulations used profiles of neutrino production heights calculated in Ref. [25], which account for the competing factors of production, propagation, and decay of muons and mesons through the atmosphere. For , effects of matter on neutrino propagation through the Earth were included following Ref. [27, 28]. Due to the small number of events expected from -production, the effects of appearance and decay were neglected in simulations of . A global scan was made on a grid minimizing with respect to , , , , , , and at each point.
The best-fit to oscillations, , was obtained at eV2) inside the physical region (). The best-fit values of the Monte Carlo parameters (summarized in Table II) were all within their expected errors. The global minimum occurred slightly outside the physical region at eV. The contours of the 68%, 90% and 99% confidence intervals are located at and based on the minimum inside the physical region[26]. These contours are shown in Fig. 2. The region near minimum is rather flat and has many local minima so that inside the 68% interval the best-fit is not well constrained. Outside the 99% allowed region the increases rapidly. We obtained , when calculated at , (i.e. assuming no oscillations).
For the test of oscillations, we obtained a relatively poor fit; , at eV. The expected asymmetry of the multi-GeV -like events for the best-fit oscillation hypothesis, , differs from the measured asymmetry, , by 3.4 standard deviations. We conclude that the hypothesis is not favored.
| Monte Carlo Fit Parameters | Best Fit | Uncertainty | |
|---|---|---|---|
| overall normalization | (*) | ||
| spectral index | 0.006 | ||
| sub-GeV ratio | -6.3% | ||
| multi-GeV ratio | -11.8% | ||
| relative norm. of PC to FC | -1.8% | ||
| 3.1% | % | ||
| sub-GeV up-down | 2.4% | % | |
| multi-GeV up-down | -0.09% | % | |
The zenith angle distributions for the FC and PC samples are shown in Fig. 3. The data are compared to the Monte Carlo expectation (no oscillations, hatched region) and the best-fit expectation for oscillations (bold line).
We also estimated the oscillation parameters considering the measurement and the zenith angle shape separately. The 90% confidence level allowed regions for each case overlapped at eV2 for .
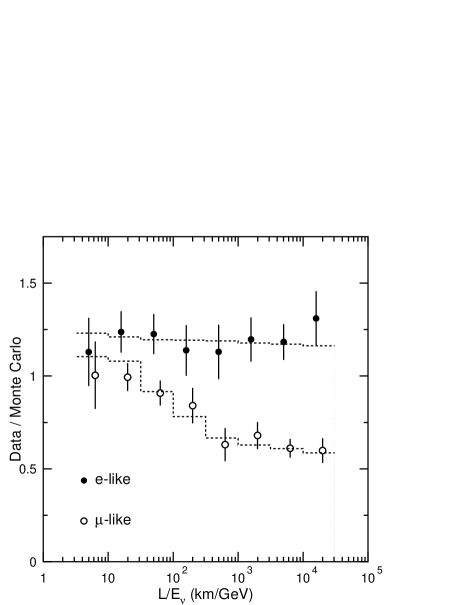
As a cross-check of the above analyses, we have reconstructed the best estimate of the ratio for each event. The neutrino energy is estimated by applying a correction to the final state lepton momentum. Typically, final state leptons with MeV/ carry of the incoming neutrino energy increasing to 85% at GeV/. The neutrino flight distance is estimated following Ref. [25] using the estimated neutrino energy and the reconstructed lepton direction and flavor. Figure 4 shows the ratio of FC data to Monte Carlo for -like and -like events with MeV/ as a function of , compared to the expectation for oscillations with our best-fit parameters. The -like data show no significant variation in , while the -like events show a significant deficit at large . At large , the have presumably undergone numerous oscillations and have averaged out to roughly half the initial rate.
The asymmetry of the -like events in the present data is consistent with expectations without neutrino oscillations and two-flavor oscillations are not favored. This is in agreement with recent results from the CHOOZ experiment[29]. The LSND experiment has reported the appearance of in a beam of produced by stopped pions[30]. The LSND results do not contradict the present results if they are observing small mixing angles. With the best-fit parameters for oscillations, we expect a total of only 15-20 events from charged-current interactions in the data sample. Using the current sample, oscillations between and are indistinguishable from oscillations between and a non-interacting “sterile” neutrino.
Figure 2 shows the Super–Kamiokande results overlaid with the allowed region obtained by the Kamiokande experiment[11]. The Super–Kamiokande region favors lower values of than allowed by the Kamiokande experiment; however the 90% contours from both experiments have a region of overlap. Preliminary studies of upward-going stopping and through-going muons in Super-Kamiokande[31] give allowed regions consistent with the FC and PC event analysis reported in this paper.
Both the zenith angle distribution of -like events and the value of observed in this experiment significantly differ from the best predictions in the absence of neutrino oscillations. While uncertainties in the flux prediction, cross sections, and experimental biases are ruled out as explanations of the observations, the present data are in good agreement with two-flavor oscillations with and eV2 at 90% confidence level. We conclude that the present data give evidence for neutrino oscillations.
We gratefully acknowledge the cooperation of the Kamioka Mining and Smelting Company. The Super–Kamiokande experiment was built and has been operated with funding from the Japanese Ministry of Education, Science, Sports and Culture, and the United States Department of Energy.
REFERENCES
- [1]
- [2]
- [3] Present address: NASA, JPL, Pasadena, CA 91109, USA
- [4] Present address: Accelerator Laboratory, High Energy Accelerator Research Organization (KEK)
- [5] Present address: Enrico Fermi Institute, University of Chicago, Chicago, IL 60637 USA
- [6] Present address: Institute of Particle and Nuclear Studies, High Energy Accelerator Research Organization (KEK)
- [7] Present address: Department of Physics, Stanford University, CA 94305, USA
- [8] G. Barr et al., Phys. Rev. D39, 3532 (1989); V. Agrawal, et al., Phys. Rev. D53, 1313 (1996); T. K. Gaisser and T. Stanev, Proc. 24th Int. Cosmic Ray Conf. (Rome) Vol. 1 694 (1995).
- [9] M. Honda et al., Phys. Lett. B248, 193 (1990); M. Honda et al., Phys. Lett. D52, 4985 (1995).
- [10] K.S. Hirata et al., Phys. Lett. B205, 416 (1988); K.S. Hirata et al., Phys. Lett. B280, 146 (1992).
- [11] Y. Fukuda et al., Phys. Lett. B335, 237 (1994).
- [12] D. Casper, et al., Phys. Rev. Lett. 66, 2561 (1991); R. Becker-Szendy et al., Phys. Rev. D46, 3720 (1992).
- [13] Super-Kamiokande Collaboration, Y. Fukuda, et al., Phys. Lett. B (1998), accepted for publication, hep-ex/9803006.
- [14] Super-Kamiokande Collaboration, Y. Fukuda, et al., submitted to Phys. Lett. B (May 1998), hep-ex/9805006
- [15] K. Daum, et al., Z. Phys. C66, 417 (1995).
- [16] M. Aglietta, et al., Europhys. Lett. 8, 611 (1989).
- [17] W.W.M. Allison et. al., Phys. Lett. B391, 491 (1997); T. Kafka, proceedings of 5th Int. Workshop on Topics in Astroparticle and Underground Physics, Gran Sasso, Italy, Sep. 1997.
- [18] O.G. Ryazhskaya, JETP Lett. 60, 617 (1994); JETP Lett. 61, 237 (1995).
- [19] Y. Fukuda, et al., Phys. Lett. B388, 397 (1996).
- [20] T. K. Gaisser et al., Phys. Rev. D54, 5578 (1996)
- [21] J. Engel et al., Phys. Rev. D48, (1993) 3048.
- [22] S. Kasuga, et al., Phys. Lett. B374, 238 (1996).
- [23] W.A. Mann, T. Kafka and W. Leeson, Phys. Lett. B291, 200 (1992).
- [24] This represents an improvement from Refs.[13, 14] due to improved calibration.
- [25] T. K. Gaisser and T. Stanev, Phys. Rev. D57, 1977 (1998).
- [26] Based on a two-dimensional extension of the method from the Particle Data Group, Review of Particle Physics, Section: Errors and confidence intervals – Bounded physical region, June 1996: R.M. Barnett et al. Phys. Rev. D54, 375 (1996).
- [27] L. Wolfenstein, Phys. Rev. D17, 2369 (1978).
- [28] S. P. Mikheyev and A. Y. Smirnov, Sov. J. Nucl. Phys. 42, 1441 (1985); S. P. Mikheyev and A. Y. Smirnov, Nuovo Cim. 9C, 17 (1986); S. P. Mikheyev and A. Y. Smirnov, Sov. Phys. Usp. 30, 759 (1987).
- [29] M. Apollonio et al., Phys. Lett. B420 397 (1998)
- [30] C. Athanassopoulos, et al., Phys. Rev. C 54, 2685 (1996); Phys. Rev. Lett. 77, 3082 (1996).
- [31] T. Kajita, to appear in the proceedings of the XVIIIth International Conference on Neutrino Physics and Astrophysics, Takayama, Japan, June 1998; Super-Kamiokande collaboration, draft in preparation.