Measurement of the Energy Spectrum of from Muon Decay and Implications for the Lorentz Structure of the Weak Interaction
Abstract
The KARMEN experiment uses the reaction 12C ( , ) 12Ng.s. to measure the energy distribution of emitted in muon decay at rest + + . The analog of the famous Michel parameter has been derived from a maximum-likelihood analysis of events near the kinematic end point, MeV. The result, , is in good agreement with the standard model prediction . We deduce a 90% confidence upper limit of , which corresponds to a limit of on the interference term between scalar and tensor coupling constants.
Experimental results from nuclear decay and muon decay form the basis of the V-A hypothesis, which is an essential feature of the standard model (SM) of electroweak interactions. The rate of muon decay, the purely leptonic process + + , has been used to determine the universal Fermi coupling constant . Precise measurements of the shape of the energy spectrum, the decay asymmetry between the spin and momentum, and the polarisation vector of the have led to bounds on the scalar, vector and tensor coupling constants, which form the Lorentz structure of the charged weak interaction. These results combined with the inverse process + + underpin the SM assumption of lepton number conservation, the V-A interaction and universality [1]. All experiments up to now support the V-A structure of the weak interaction; however, substantial non- (V-A) components are not ruled out.
Complementary to these experiments, which are all based on observation of the charged leptons only, the Karlsruhe Rutherford Medium Energy Neutrino experiment (KARMEN) determines the energy spectrum of the emitted in the decay + + of unpolarized muons to draw conclusions on the Lorentz structure. In the well-known case of spectroscopy, it is the Michel parameter which governs the shape of the energy spectrum. In an analogous way, the shape of the energy spectrum is determined by the parameter , which also depends on vector, scalar, and tensor components of the weak interaction, but in a different combination. In the SM all non- (V-A) components vanish, and is predicted to be . Thus an upper limit on derived from the analysis of the energy spectrum provides new limits on nonstandard couplings.
All features of muon decay are most generally described by a local, derivative-free, lepton-number-conserving, four-lepton point interaction with the matrix element given by [2]
| (1) |
The index labels the type of interaction (S = 4-scalar, V = 4-vector, T = 4-tensor) and the indices and indicate the chirality (L = left-, R = right-handed) of electron and muon spinors, respectively. In this representation the chirality of the neutrino or is fixed to be equal to that of the associated charged lepton for the V interaction, but opposite for the S and T interactions. As sets the absolute strength of the interaction, the ten coupling constants are dimensionless complex quantities normalized by
| (2) |
with . In the SM, muon decay is a pure V interaction mediated between left-handed particles, so all coupling constants vanish except . Although this representation is elegant from the theoretical point of view, the individual coupling constants cannot be determined directly by experiment. However, the measurable parameters (, , , etc.) are expressable as positive semidefinite bilinear combinations of from which upper or lower limits for the coupling constants can be derived.
The possibility of measuring with the KARMEN experiment was first pointed out by Fetscher [3]. More recently Greub et al. [4] have calculated the spectrum of left-handed including radiative corrections and effects of finite lepton masses. Taking significant terms only, the spectrum can be described by
| (3) |
where is the muon mass, is the reduced neutrino energy, and denotes the probability of emission of a left-handed . The function describes the pure V-A interaction, takes into account radiative corrections, and includes the effect of scalar and tensor components according to
| (4) |
The calculated energy spectra for different values of are shown in Fig. 1(a). Momentum conservation in the decay fixes the emission direction of near the kinematic end point to be opposite to that of the positron and the . Together with angular momentum conservation this implies suppression of emission of left-handed in the case of vector coupling, while all other couplings enhance the decay rate at the end point. The total decay rate, and therefore the integral neutrino flux, is unchanged by nonstandard interactions.
The KARMEN experiment uses the pulsed spallation neutron facility ISIS at the Rutherford Appleton Laboratory to investigate neutrinos from decay. The 800 MeV proton beam from ISIS is stopped in a Ta-D2O target producing neutrons and pions. All charged pions are stopped inside the target within s, the being absorbed by the heavy target material while the / decay chain + , + + produces an intense burst of , , and , emitted isotropically with equal intensity. Since both and decay at rest, the energy spectra of the neutrinos are well defined. The decay produces monoenergetic with MeV; the and from the decay have continuous energy distributions up to MeV. The time structure of ISIS — two 100 ns wide proton bunches 324 ns apart and recurring at 50 Hz — determines the production time of the different flavors: the short lifetime ( ns) leads to two pulses within the first 500 ns after beam-on target. These pulses are well separated in time from the production of and , which follow with the much longer lifetime of the (s). This leads to a suppression factor of about for cosmic-ray background.
The neutrinos are detected in a segmented 56 ton liquid scintillation calorimeter consisting of 512 optical modules, each with a length of 3.53 m and a cross section of cm2 [5]. The detector is an almost completely (96%) active calorimeter optimized for the measurement of electrons around 30 MeV and achieves resolutions of for energy, and cm for position measurement. A 7000 ton shielding steel blockhouse together with two layers of active veto counters suppresses beam-correlated spallation neutrons and cosmic-ray muons.
The signature that unambiguously identifies a is a delayed coincidence consisting of an electron from the charged current reaction 12C ( , ) 12Ng.s. in the time window of production followed by a positron from the subsequent decay of 12Ng.s. ( ms) at the same location in the detector. Each event fully contained within the central detector with time 0.6–9.6 s after beam-on target and energy 10–36 MeV is identified as electron, provided it is followed by a positron event within 0.5–36 ms with energy 3.5–16.5 MeV. We demand the sequence to be detected in the same or adjacent module within a distance cm along the module axis. Cuts used to reduce cosmic background are the same as used in previous data evaluations [6]. In data accumulated between June 1990 and December 1995 — corresponding to 9122 C of protons or decays in the ISIS target — we find 513 / sequences. Subtracting background events and taking into account an overall detection efficiency , the flux-averaged cross section is
| (5) |
This is in good agreement with different theoretical calculations of in the range of (9.1–9.4) cm2 [7, 8].
As the recoil energy of the 12N nucleus is negligible, the energy is determined from the measurement of the electron energy via the kinematic relation , where MeV is the value of the detection reaction. The energy dependence of the cross section is dominated by the phase-space factor . Therefore, a low rate of additional at the kinematic end point MeV due to nonstandard couplings is translated to the observation of a significantly higher rate of electrons and thus to a distortion of the visible energy spectrum of Fig. 1(b).
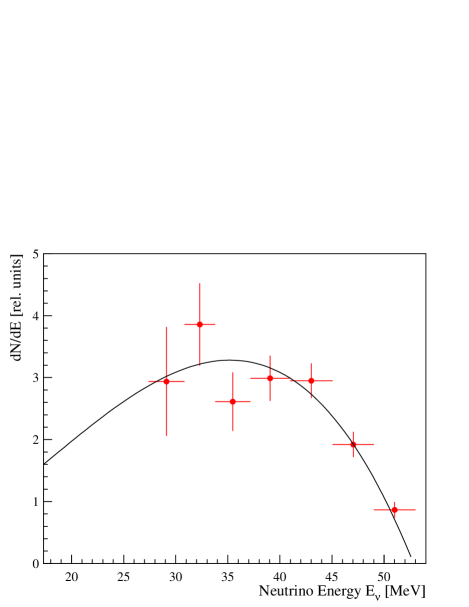
The KARMEN calorimeter allows a precise measurement of the energy [see Fig. 1(c)]. The energy spectrum of from decay is then determined in two steps. First, we apply the procedure of regularized unfolding described by Blobel [9] to derive the true electron energy. This method takes into account the detector response and minimizes inherent instabilities (oscillating solutions) by demanding a priori a certain degree of smoothness of the true electron distribution depending on statistical accuracy. The energy distribution is then calculated from the number of primary electrons, within a given interval from the unfolding procedure, divided by the corresponding mean cross section. This yields a energy spectrum with seven data points as shown in Fig. 2 and compared with the V-A expectation. This represents the first measurement of the neutrino energy spectrum from muon decay in addition to the well-known spectrum.
Because of the strong energy dependence of the detection cross section the most detailed information on and is obtained from the experimental electron spectrum of Fig. 1(c). The analysis is done by two independent methods: (1) the investigation of the measured decay rate on the basis of the flux-averaged cross section, and (2) the analysis of the spectral shape with a maximum likelihood (ML) method.
As can be seen from Fig. 1(b), would result in additional 12C ( , ) 12Ng.s. events; on the other hand, would reduce the number of events [see Eq. (3)]. In order to find allowed regions in the - parameter space, we compared measured and expected flux averaged cross sections. As theoretical cross section with a realistic estimate of the systematic error we use cm2. The experimental cross section is taken from Eq. (5) with statistical and systematic error added quadratically. The probability distribution of the ratio
| (6) |
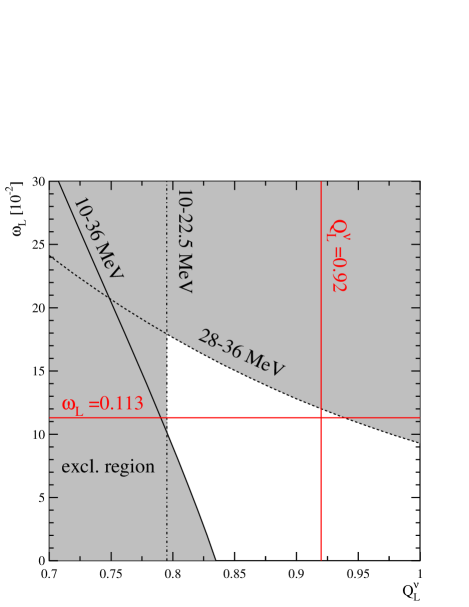
incorporates a flux decrease by right handed through as well as an increase by nonzero values; is the ratio of additional events in case of relative to the expectation for . We have sampled the probability density function of the ratio from Gaussian distributions of and for 3 different energy ranges: (a) the range 10–36 MeV with the highest statistical accuracy, but only moderate sensitivity , (b) the range 28–36 MeV, where with we are very sensitive to , and (c) the range 10–22.5 MeV, where the expected event number is almost independent of [, see Fig. 1(b)]. From range (c) we deduce a lower limit . The shaded parameter space shown in Fig. 3 combines regions excluded at 90% confidence level of all 3 energy ranges. From inverse muon decay experiments it is known that [10, 11]. Including this information in our analysis of range (b) restricts the allowed area and sets a 90% confidence upper limit .
In the second method we determine by analyzing the shape of the visible electron spectrum independent of . In order to increase the energy resolution and to reduce the background level we applied more stringent cuts on the electron position along the module axis cm and on the electron time 0.6–7.2 s. These cuts reduce the background to only 6.0 events in a sample of 441 events, thus nearly doubling the signal-to-background ratio.
The theoretical energy spectrum of Eq. 3 was converted into a visible electron spectrum using the energy-dependent taken from [8] folded with the detector response by a MC calculation. The ML procedure was carried out on an event-by-event basis for several fit intervals all of which gave results compatible with within a -error. The net result is
| (7) |
Including the systematic error (energy shift of 0.25 MeV or 0.7% scaling error) we find, with the most conservative Bayesian approach, a 90% confidence upper limit . This excludes the region above the horizontal line in Fig. 3. Combining Eq. (2) and Eq. (4) the following relation between the shape parameter and nonstandard couplings is [10, 12]
| (8) |
The limit on thus results in an upper limit of for the interference term of scalar and tensor amplitudes.
In conclusion, the KARMEN experiment finds no evidence for nonstandard coupling constants in decay at rest, either by a determination of the absolute flux or by analysis of the spectral shape. Our analysis excludes most of the - parameter space and yields for the first time an upper limit on the neutrino Michel parameter .
During 1996 the experiment was upgraded by an additional active veto counter in order to increase the sensitivity of the search for neutrino oscillations in the channel [13]. Since 1997 KARMEN has been taking data again. Up to the end of 1999 we expect about 400 further charged current events, which will reduce the statistical error by about a factor of 1.4. Considering also a reduction of the systematic error, this may result in a limit competitive with the present best limit deduced from measurements of the positron polarization [10].
We gratefully acknowledge the financial support from the German Bundesministerium für Bildung, Wissenschaft, Forschung und Technologie (BMBF), the Particle Physics and Astronomy Research Council (PPARC), and the Central Laboratory of the Research Council (CLRC). In particular, we thank W. Fetscher for numerous discussions.
REFERENCES
- [1] W. Fetscher, Z. Phys. C 56, 109 (1992); W. Fetscher and H.-J. Gerber in Precision Tests of the Standard Electroweak Model, World Scientific, Singapore (1993).
- [2] W. Fetscher, H.-J. Gerber and K.F. Johnson, Phys. Lett. B 173, 102 (1986).
- [3] W. Fetscher, Phys. Rev. Lett. 69, 2758 (1992); 71, 2511(E) (1993).
- [4] C. Greub, D. Wyler and W. Fetscher, Phys. Lett. B 324, 109 (1994).
- [5] G. Drexlin et al., Nucl. Instrum. and Methods Phys. Res., Sect. A 289, 490 (1990).
- [6] B. Bodmann et al., Phys. Lett. B 332, 251 (1994).
- [7] M. Fukugita et al., Phys. Lett. B 212, 139 (1988); S.L. Mintz and M. Pourkaviani, Phys. Rev. C 40, 2458 (1989); E. Kolbe et al., Phys. Rev. C 49, 1122 (1994); J. Engel et al., Phys. Rev. C 54, 2740 (1996).
- [8] T.W. Donnelly, Phys. Lett. B 43, 93 (1973).
- [9] V. Blobel, in Proceedings of the 1984 CERN School of Computing (CERN-Report No. 85/09, 1985).
- [10] W. Fetscher, Phys. Rev. D 49, 5945 (1994).
- [11] Particle Data Group, R. M. Barnett et al., Phys. Rev. D 54, 250 (1996).
- [12] Limits on and are possible as well, but are not as stringent as in other experiments.
- [13] G. Drexlin et al., Prog. Part. Nucl. Phys. 40, Vol. 1, 193 (1998).