MEASUREMENT OF THE TOP QUARK MASS
The first evidence and subsequent discovery of the top quark was reported nearly 4 years ago. Since then, CDF and D0 have analyzed their full Run 1 data samples, and analysis techniques have been refined to make optimal use of the information. In this paper, we report on the most recent measurements of the top quark mass, performed by the CDF and D0 collaborations at the Fermilab Tevatron. The CDF collaboration has performed measurements of the top quark mass in three decay channels from which the top quark mass is measured to be . The D0 collaboration combines measurements from two decay channels to obtain a top quark mass of . Combining the measurements from the two experiments, assuming a 2 correlated systematic uncertainty, the measurement of the top quark mass at the Tevatron is . This report presents the measurements of the top quark mass from each of the decay channels which contribute to this measurement.
1 Introduction
The top quark is defined as the member of a weak SU(2) isodoublet that also contains the quark. In collisions, top quarks are produced primarily in pairs and are expected to decay through the electroweak interaction to a W-boson and b-quark. In the standard model, the branching fraction for is expected to be nearly 100%. The decay width is calculated to be for masses between . The top quark mass is sufficiently large that top-flavored hadrons are not expected to form .
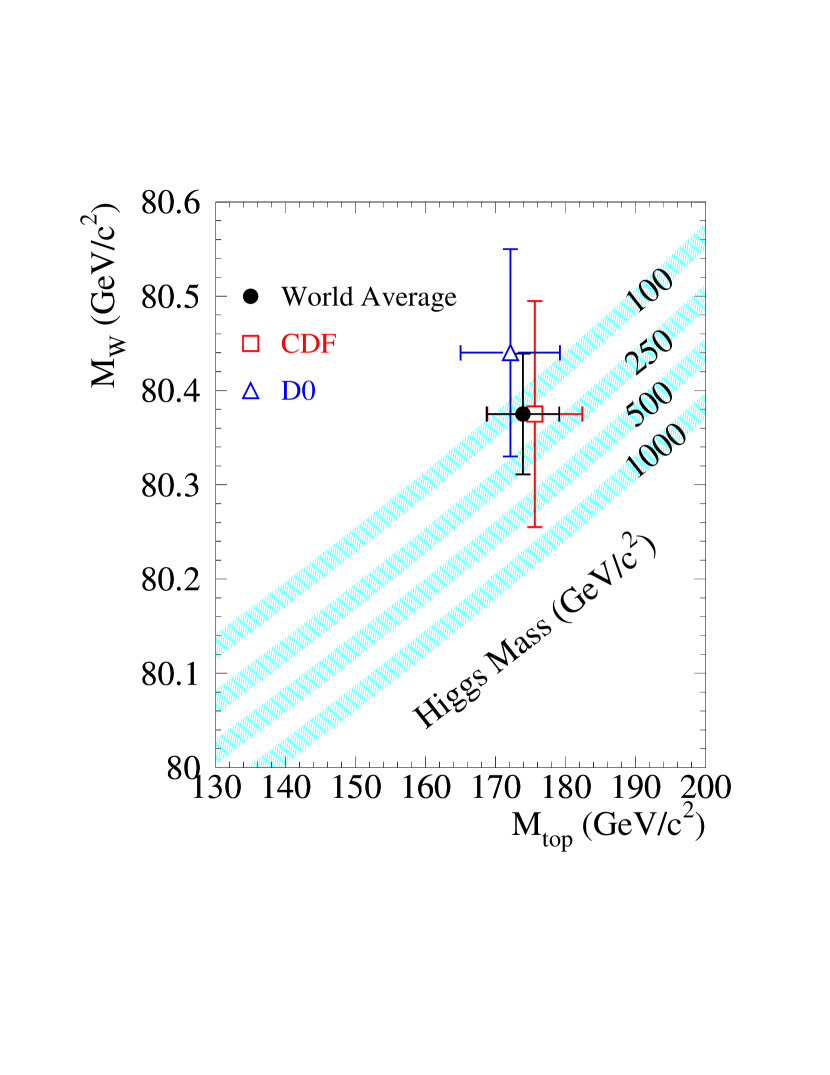
The top quark mass, , is an important parameter in calculations of electroweak processes since its mass is approximately 35 times larger than that of the next heaviest fermion. Like other fermions, its mass is taken to be an unpredicted parameter of the standard model . Calculations of electroweak radiative corrections relate the top quark and the W-boson () masses to that of the Higgs boson. Precision measurements of and can therefore aid in searches for the Higgs boson.
2 Overview of Top Quark Mass Measurement
In TeV collisions, top quarks are expected to be produced in pairs mainly through the subprocess . At the Tevatron, both CDF and D0 select samples of events which are consistent with containing a pair. Since each W-boson may decay leptonically or hadronically, this leads to three categories of events. Events which have 2 high isolated leptons (both W-bosons decay leptonically), missing transverse energy () and two or more jets (from the b-quarks) are classified as Dilepton events. Events which have one isolated high lepton, , and 4 or more jets are referred to as l+jets events. Events containing 6 or more jets and no high isolated leptons are classified as All-hadronic events. Neither CDF nor D0 try to reconstruct the top mass from candidate events. Ignoring final states containing ’s, the branching ratio for into these three decay channels is 5%, 30%, and 44% respectively.
Both CDF and D0 have measured the top quark mass in the Dilepton and l+jets channels. CDF has also made a measurement of the top quark mass in the All-Hadronic channel. A general procedure is used for extracting the top quark mass. For each decay channel, we choose a variable (or a set of variables) which can be measured in the data sample, and is highly correlated with . Examples of such variables include event-by-event top mass, jet , , total scalar , etc. The distribution of a given variable is modelled using Monte Carlo (MC) simulations of signal and background. The signal distributions are modelled using the HERWIG MC simulation and are produced for a wide range of input top quark masses, ranging from 120 to 220 . Background distributions are derived from a combination of Monte Carlo and/or data, depending on the channel. The modelled signal and background distributions are generically referred to as templates. The top quark mass is extracted from a maximum likelihood procedure which compares the observed data distribution(s) to the signal and background templates. Assumptions made in the modelling of signal and background are included as sources of systematic uncertainty.
3 Top Quark Mass Measurement in the Dilepton Topology
Both CDF and D0 have reported measurements of the top quark mass in the Dilepton decay topology. Because these events are presumed to have two neutrinos, the kinematics of the system (including the top quark mass) cannot be uniquely determined. A measurement of the top quark mass can however be made by comparing the measured observables with the expectation from and background. Each experiment employs two techniques to measure the top quark mass from their respective samples.
3.1 CDF Dilepton Mass Measurements
The first Dilepton mass measurement uses the energies of the 2 highest jets in the candidate events as a discriminator for the top quark mass measurement. From a sample of 8 events, with an expected background of 1.10.3 events, the analysis yields a top quark mass of 15923(stat)11(syst) . A second analysis exploits the fact that, in the W-boson rest frame of the decay, the top quark mass can be related to the invariant mass of the b-jet and lepton () to which it decays. Among the two possible pairings of the 2 leptons with the 2 highest jets, the pair with the smaller sum of invariant masses is chosen. From this analysis, the top quark mass is measured to be 16320(stat)6(syst) . The jet energy scale, and signal and background modelling dominate the systematic uncertainty. The two measurements are combined taking into account the correlations in uncertainties to obtain a top quark mass of 16117(stat)10(syst) .
3.2 D0 Dilepton Mass Measurements
Both techniques which D0 employs uses MC simulations to calculate a probability that the observed kinematics of the event are consistent with top of an assumed mass. This probability is mapped out as a function of assumed top mass in the range from 80 to 280 . The probability in the first technique is based on: (a) the probability for the charged leptons to have come from decay at the assumed mass, and (b) the probability for the event to have been produced by valence quarks with momentum fractions and . The second technique calculates a probability based on the difference between the measured and calculated in the event. The calculation of the is facilitated by assuming values for the pseudorapidity of the two neutrinos ( and ), and then integrating over the , phase space. For both techniques, detector resolution effects are included as well as trying both lepton-(b-quark) combinations. Based on the data sample of 6 events and an expected background of 1.42 events, the mass is measured to be 168.112.4(stat)3.6(syst) using the first technique, and 169.914.8(stat)3.6(syst) using the second technique. The dominant systematics are the same as those mentioned for the CDF dilepton analyses. The measurements are combined to obtain a top quark mass of 168.412.3(stat)3.6(syst) .
4 Top Quark Mass Measurement in the l+jets Topology
Both CDF and D0 have measured the top quark mass in the l+jets topology. The l+jets decay channel currently allows for the most accurate determination of the top quark mass. The measurement benefits from a relatively large branching ratio and the ability to fully reconstruct the top mass on an event-by-event basis. The momentum of all final state particles are assumed to be measured, with the exception of the unobserved neutrino, . The transverse momentum components of the neutrino however can be inferred from the in the event, leaving only its Z-component unmeasured. Three kinematic constraints are implied by the decay hypothesis. Namely, we require that , , and , where = or jet, =non- jet, =W-boson mass, and are invariant masses formed from the reconstructed 4-vectors of the indicated objects. Because events are expected to contain 2 b-quarks, as compared to only a few percent for background events, identifying b-jets improves the signal to background ratio (S/B). B-jets are tagged by either reconstructing the secondary decay vertices of B-hadrons (SVX tagged jet), or by identifying charged tracks which are consistent with coming from semileptonic b-hadron decay (SLT tagged jet). Each event is fit to the topology, requiring b-tagged jets to be assigned to b-quarks, All allowable permutations are tried, and the top mass corresponding to the solution with the lowest is taken as the reconstructed top mass () for a given event. The ensemble of reconstructed masses (one per event) are fit using a likelihood procedure to extract the best estimate of the top quark mass.
4.1 CDF l+jets Mass Measurement
The initial sample selection requires 1 isolated lepton with , , , jets with , , and a fourth jet with and . After applying these selection criteria and the cut on the kinematic fit, the sample consists of 151 events, of which 35% are estimated to be from . Motivated by the different S/B and top mass resolution for events with SVX, SLT, or no tags, MC simulations were used to determine an optimal way to partition the sample as to obtain the best precision on the top quark mass measurement. Studies showed that an optimal partitioning consists of subdividing the events into the four statistically independent categories shown in Table 1. The table shows the numbers of events in each subsample, the expected background fraction , and the fitted top mass.
| Data Sample | #Events | (%) | Top Mass () |
|---|---|---|---|
| SVX Double (2 SVX tagged jets) | 5 | ||
| SVX Single (1 SVX tagged jet) | 15 | ||
| SLT tagged (1 SLT tagged jets, no SVX tags) | 14 | ||
| No Tags (4 jets with , ) | 42 | ||
| Combined | 76 | - |
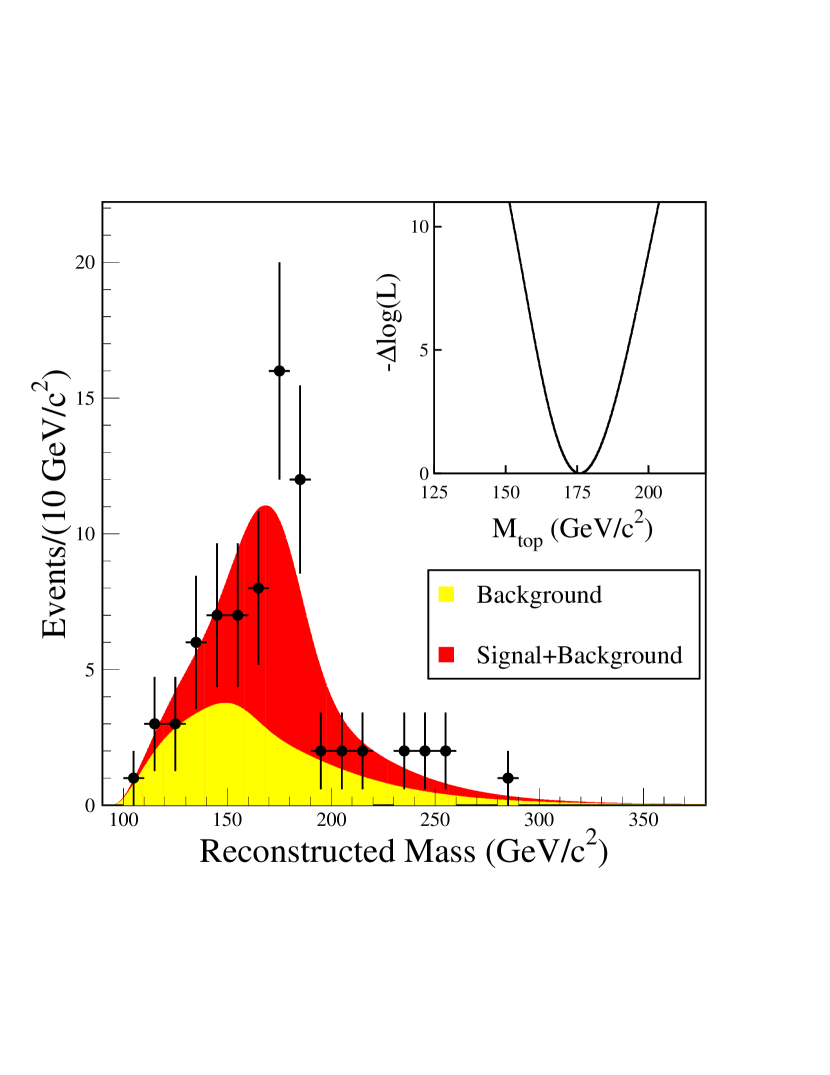
Since the four subsamples are statistically independent, the joint likelihood for the 76 events is given by the product of the four subsample likelihoods. Each subsample likelihood uses parameterized signal and background probability densities, along with a constraint on the the background fraction (see Table 1), to evaluate the likelihood for observing the measured set of masses as a function of the top mass. The results of the likelihood fit for each subsample and the combined result are shown in Table 1. The results of the combined fit for the 76 data events and are shown in Fig. 1. Including the systematic uncertainties presented in Table 3, the top quark mass is measured to be 175.94.8(stat.)4.9(syst.) for events in the l+jets topology.
4.2 D0 l+jets Mass Measurement
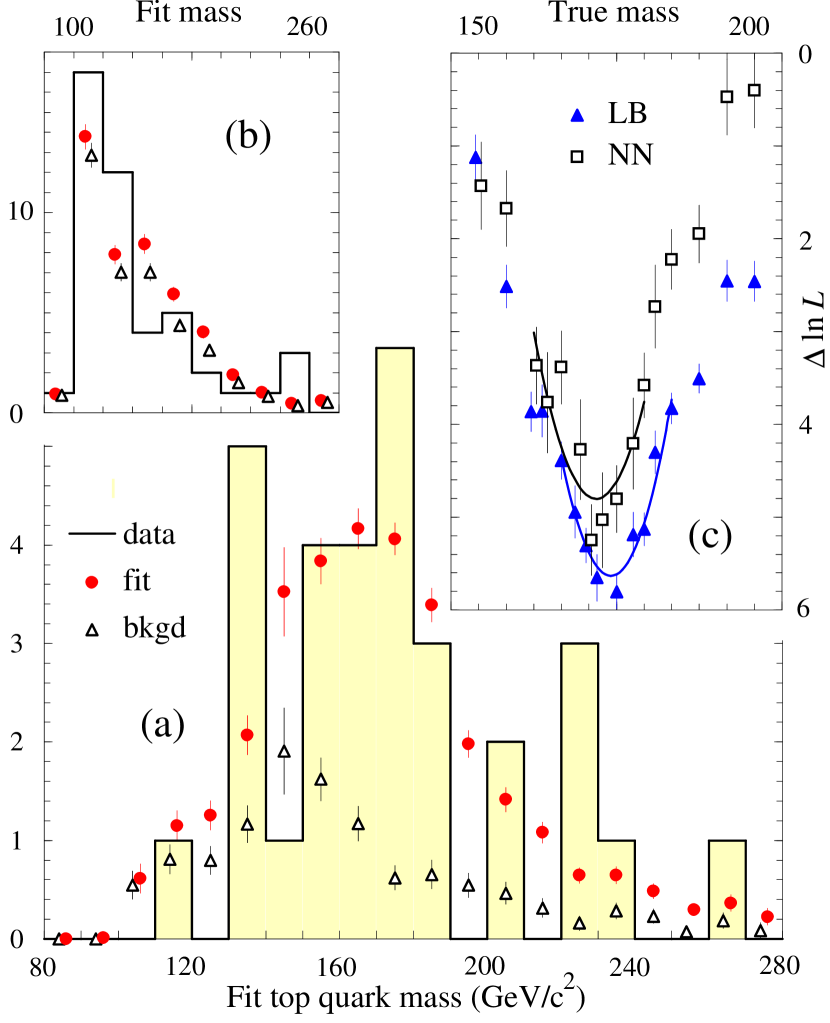
The event selection for the D0 analysis is similar to CDF. The main differences are a larger cut for the charged lepton (from the W-boson decay) and all four jets are required to have . After the event selection criteria and the kinematic cut, 77 events remain of which 5 are SLT tagged (D0 did not have a silicon vertex detector in Run 1). D0 extends the likelihood procedure by including an additional variable which provides discrimination between signal and background events. Two versions of the discriminant are tried. The first is a low-bias version , and the second, , was the output from a neural network trained on signal and background events. Both discriminants provide similar levels of discrimination between signal and background events. Two-dimensional signal templates of vs are generated for many input values for the top mass and a single template for the background. For each top mass value, a likelihood is minimized with respect to the number of signal and background events. The corresponding negative log-likelihood values are fit to a quadratic function of top mass, and the measured top mass is taken to be where the function is a minimum. The fits to the data are presented in Table 2 and shown in Fig. 2 For illustrative purposes, the data sample is separated into (a) signal depleted and (b) signal enhanced subsamples. Also shown are the likelihood fits for the two methods. Including the systematic uncertainties shown in Table 3, the top quark mass is measured to be 173.35.6(stat.)5.5(syst.) .
| Method | () | Fitted | Fitted |
|---|---|---|---|
| LB | 174.05.6 | 248 | 5310 |
| NN | 171.36.0 | 299 | 4810 |
| LB+NN | 173.35.6 | - | - |
| Source | CDF | D0 |
|---|---|---|
| Energy Scale | 4.4 | 4.0 |
| Signal Model | 1.8 | 1.9 |
| Background | 1.3 | 2.5 |
| Noise/M.I. | - | 1.3 |
| b-tagging bias | 0.4 | - |
| Likelihood Method | - | 1.3 |
| Total | 4.9 | 5.5 |
5 CDF All-Hadronic Top Mass Measurement
This measurement requires 6 or more jets with , and , and at least one b-tagged jet. Additional cuts, based on MC simulations, were employed to improve the S/B ratio. An event-by-event top mass is evaluated using the measured jet energies and the kinematic constraints mentioned previously. All thirty combinations are tried, and the top mass having the lowest is taken as the top mass for the event. The data sample consists of 136 events, of which 1089 events are expected to come from background sources. A likelihood procedure (with a gaussian background constraint) was used to extract a measured top mass of 18610(stat.)12(syst.) . The systematic uncertainties are dominated by the jet energy scale signal modelling, and the fitting method.
6 Combining the top mass measurements
The measurement in each decay topology may be combined to improve the resolution on the top quark mass measurement. Each experiment combines their measurements into a single measurement, taking into account correlations in uncertainties between the measurements. Combining the three CDF measurements, the top quark mass is measured to be 175.66.8 . The two D0 measurements yield a top quark mass of 172.17.1 . These two mass measurements are combined assuming a 2 correlated systematic uncertainty. The top quark mass at the Tevatron is therefore measured to be 173.95.2 . The values of versus for several (standard model) Higgs masses are shown in Fig. 3 The data tend to favor a mass below 500 , but clearly more data is needed to reduce the uncertainties. In Run 2, we expect to measure to within 1-2 and to within 40 . This will clearly narrow the search window for future Higgs’ searches.
I would like to thank my collaborators at CDF for their assistance in preparing this talk. I would also like to thank the D0 top group, particularly Scott Snyder and Erich Varnes for answering questions regarding their top mass analyses.
References
References
- [1] F. Abe et al., Phys. Rev. D 50, 2966 (1994). Phys. Rev. Lett. 73, 225 (1994).
- [2] F. Abe et al., Phys. Rev. Lett. 74, 2626 (1995).
- [3] S. Abachi et al., Phys. Rev. Lett 74, 2632 (1995).
- [4] M. Jezabek and J. H. Kuhn, Phys. Rev. D 48, 1910 (1993); Erratum, ibid. Phys. Rev. D 49, 4970 (1994)
- [5] I. I. Bigi, Yu L. Dokshitzer, V. A. Khoze, J. H. Kuhn, and P. Zerwas, Phys. Lett. B181, 157 (1986).
- [6] S. L. Glashow Nucl. Phys. 22, 579 (1961); S. Weinberg, Phys. Rev. Lett. 19, 1264 (1967); A. Salam, in Elementary Particle Theory: Relativistic Groups and Analyticity (Nobel Symposium No. 8), edited by N. Svartholm (Almqvist and Wiksell, Sweden, 1968), p367.
- [7] The missing , is defined to be the magnitude of the vector sum of the transverse energy of all calorimeter towers.
- [8] G. Marchesini and B. R. Webber, Nucl. Phys. B310, (1988), 461; G. Marchesini et al., Comput. Phys. Comm. 67, 465 (1992).
- [9] F. Abe et al. Phys. Rev. Lett. 80, 2779 (1998)
- [10] S. Abachi et al. Phys. Rev. Lett. 80, 2063 (1998)
- [11] F. Abe et al., Phys. Rev. Lett. 80, 2767 (1998).
- [12] S. Abachi et al., Phys. Rev. Lett. 79, 1197 (1997).
- [13] K. Tollefson, Ph.D. Thesis, University of Rochester (1997).
- [14] The background fractions, , are defined as the expected number of background events in a given subsample divided by the total number of events in that subsample.
- [15] F. Abe et al. Phys. Rev. Lett. 79, 1992 (1997).