SLAC–PUB–7831
May 1998
B PHYSICS AT SLD:
and LIFETIMES, MIXING
AND SEARCH FOR DECAYS***Work supported by
Department of Energy contract DE–AC03–76SF00515.
Stéphane Willocq
Stanford Linear Accelerator Center
Stanford University, Stanford, CA 94309
Representing
The SLD Collaboration
Abstract
We report new preliminary Physics results obtained with 300,000 hadronic decays collected by the SLD experiment at the SLC between 1993 and 1997. Three analyses are presented: a measurement of and lifetimes, a study of the time dependence of mixing, and a search for decays of the type . All analyses benefit from the small and stable interaction point and the excellent resolution and efficiency provided by the pixel-based CCD Vertex Detector. The analysis also exploits the particle identification capabilities of the Cherenkov Ring Imaging Detector.
Invited talk presented at the 33rd Rencontres de Moriond:
Electroweak Interactions and Unified Theories
Les Arcs, France
14-21 March 1998
1. Introduction
In this paper, we focus primarily on decay studies for which colliders at the pole are particularly well-suited due to the high hadron boost: lifetimes and time-dependent mixing. We also report the results of an inclusive search for decays. Furthermore, the SLD experiment is particularly well-equipped to study decays. First, the SLC interaction region is small and stable, with transverse dimensions of the order of 1 m. Second, the small interaction point (IP) can be tracked using the combined information from the Central Drift Chamber and the pixel-based CCD Vertex Detector (VXD) with an uncertainty of 4.4 m transverse to the beam direction. The IP position along the beam axis is measured with an accuracy of 15 (35) m for () decays. The impact parameter resolution at high momentum is determined from decays to be m and m. Multiple scattering yields an additional momentum-dependent contribution parameterized as , where the momentum is expressed in GeV/c. Note that the above describes the performance of the new vertex detector (VXD3) installed prior to the start of the 1996 run. For the performance of the previous detector (VXD2), as well as a general introduction to the SLD detector, see Ref. [1].
All measurements presented below are preliminary.
2. and Lifetimes
The study of exclusive hadron lifetimes provides an important test of our understanding of hadron decay dynamics. Lifetimes are especially useful to probe the strong interaction effects arising from the fact that quarks are not free particles but are confined inside hadrons. In the naive spectator model, the quarks are treated as if they were free and one therefore expects . However, the measured charm hadron lifetimes follow the pattern . These factors are predicted to scale with the inverse of the heavy quark mass squared and the hadron lifetimes are thus expected to differ by only 10-20% [2, 3].
The measurement technique used by SLD takes advantage of the excellent 3-D vertexing capabilities of the VXD to reconstruct the decays inclusively. The goal is to reconstruct and identify all the charged particles originating from the decay chain. This then allows charged and neutral mesons to be separated by simply measuring the total charge of tracks associated with the decay.
The analysis [4] uses an inclusive topological vertexing technique [5] to tag and reconstruct decays. Secondary vertices are found in 65% of hemispheres but in only 20% of hemispheres and in less than 1% of hemispheres (for VXD3). The sample purity is increased by reconstructing the vertex mass , which includes a partial correction for missing decay products. Requiring GeV yields a hadron sample with 98% purity and 50% efficiency. In the hadronic event sample collected between 1993 and 1997, we select 35,947 decay candidates by requiring the vertices to have a mass GeV, a decay length mm, and a transverse distance from the IP (2.2) cm for VXD2 (VXD3).

The sample comprises 14,064 neutral and 21,883 charged vertices corresponding to reconstructed decays with total charge and , respectively, where is the charge sum of all tracks associated with the vertex. Monte Carlo (MC) studies show that the ratio between the number of and decays in the charged sample is 1.55 (1.72) for VXD2 (VXD3), and the ratio between and decays in the neutral sample is 1.96 (2.24) for VXD2 (VXD3)†††Reference to a specific state (e.g., ) implicitly includes its charge conjugate (i.e., )..
The and lifetimes are extracted with a simultaneous binned maximum likelihood fit to the decay length distributions of the charged and neutral samples (see Fig. 1). The fit yields lifetimes of ps, ps, with a lifetime ratio of . The main contributions to the systematic error on the ratio come from uncertainties in the detector modeling, lifetime, -baryon fraction, fit systematics, and MC statistics. These measurements are the most statistically precise to date and confirm the expectation that the and lifetimes are nearly equal.
3. Mixing
Transitions between flavor states and take place via second order weak interactions “box diagrams.” A measurement of the oscillation frequency for mixing determines, in principle, the value of the Cabibbo-Kobayashi-Maskawa (CKM) matrix element , which in turn gives information on the Standard Model (SM) CP-violating phase and the parameter —both of which are currently poorly constrained. However, theoretical uncertainties in calculating hadronic matrix elements are large ( [6]) and thus limit the current usefulness of precise measurements. These uncertainties are significantly reduced ( 6–10%) for the ratio between and . Thus, combining measurements of the oscillation frequency of both and mixing translates into a measurement of the ratio and provides a strong constraint on the CKM parameters and .
Experimentally, a measurement of the time dependence of mixing requires three ingredients: (i) the decay proper time has to be reconstructed, (ii) the flavor at production (initial state ) needs to be determined, as well as (iii) the flavor at decay (final state ). At SLD, the time dependence of mixing has been studied using three different methods described below: lepton+“D”, lepton+tracks, and Charge Dipole. All three use the same initial state flavor tag but differ by the method used to either reconstruct the decay and/or tag its final state flavor. The data consists of some 150,000 hadronic decays collected with VXD3 in 1996 and 1997.
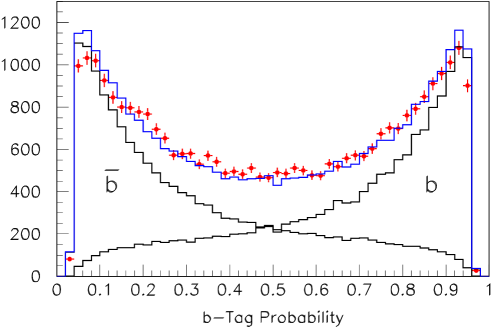
Initial state tagging takes advantage of the large longitudinal polarization of the electron beam () and the pronounced polarization-dependent forward-backward asymmetry in decays. For left- (right-) handed electrons and forward (backward) decay vertices, the initial quark is tagged as a quark; otherwise, it is tagged as a quark. The initial state tag is augmented by the following information from the hemisphere opposite that of the reconstructed vertex: momentum-weighted track charge, vertex charge, vertex charge dipole, kaon charge and lepton charge. These various tags are combined to yield an initial state tag with 100% efficiency and effective average right-tag probability of 85%. Figure 2 shows the computed -quark probability for data and MC simulation, and clearly illustrates the separation between and components.

The lepton+“D” analysis aims at reconstructing the charged track and vertex topologies of semileptonic decays. It proceeds by first selecting event hemispheres containing an identified lepton ( or ). Then, a “D” vertex is reconstructed using a similar topological technique as that used for the lifetime analysis described earlier. This vertex is constrained to lie near the plane containing the lepton and the IP, and to be downstream of the lepton, thereby reducing the confusion between primary and secondary tracks and thus allowing efficient reconstruction of semileptonic decays at short decay lengths. Several cuts are added to clean up the vertex candidate and reduce the contamination from cascade charm semileptonic decays (). In particular, the lepton momentum transverse to the trajectory is required to be greater than 0.9 GeV/c and the for fitting the lepton and vertex tracks to a single vertex is required to be larger than that obtained for the vertex tracks alone. The decay vertex is reconstructed by intersecting the lepton and trajectories. The decay length resolution for direct ) decays is shown in Fig. 3. Reconstruction of the hadron boost uses both tracking and calorimeter information. The proper time resolution is a function of the proper time : ; it is dominated by the decay length resolution at small proper time with Gaussian widths of ps (60% fraction) and 0.18 ps, whereas at large proper time it is dominated by the boost resolution and grows with increasing . In order to enhance the fraction in the sample, the total charge of all tracks associated with the decay is required to be 0. For this and the other analyses, the event purity is enhanced by requiring that a tag exists in either event hemisphere.
The lepton+tracks analysis proceeds by selecting identified leptons ( or ) with large transverse momentum ( GeV/c) with respect to the nearest jet axis as a means to produce a sample enriched in direct decays. A decay vertex is then reconstructed by intersecting all well-measured tracks inside the jet with the lepton trajectory and by forming a weighted mean intersection point. The weights are designed such as to enhance the contribution from secondary tracks vs. primary tracks. This method makes efficient use of the whole lepton sample, but has slightly worse decay length and boost resolution than the lepton+“D” method.
The Charge Dipole analysis aims at reconstructing the and vertex topologies in inclusive decays and tags the or decay flavor based on the charge difference between the and vertices. This analysis technique is unique to SLD. Topological vertices with GeV are selected as in the lifetime analysis and the total track charge is required to be 0 to enhance the fraction of decays in the sample and to increase the quality of the charge difference reconstruction for neutral decays. To select decays with non-negligible separation between the and decay points, the probability for fitting all tracks to a single vertex is required to be less than 5%. The tracks are then rearranged into various two-vertex combinations and that with the lowest overall is selected. The vertex closer to the IP is labelled “” and that further away is labelled “.” MC studies indicate that the track assignment to the () vertex is 66% (71%) correct. A “Charge Dipole” is defined as , where is the distance between the two vertices and () is the charge of the () vertex. Positive (negative) values of tag () decays and the correct tag probability increases with increasing up to approximately 80% for decays at least 1 mm away from the IP.
| lepton+“D” | lepton+tracks | Charge Dipole | |
| fraction | 0.156 | 0.098 | 0.152 |
| fraction | 0.03 | 0.162 | 0.025 |
| mistag rate | 0.21 | 0.27 | 0.38 |
| (m) | 107 | 135 | 131 |
| 0.60 | 0.70 | 0.60 | |
| (m) | 330 | 614 | 500 |
| 0.070 | 0.073 | 0.080 | |
| 0.60 | 0.50 | 0.60 | |
| 0.22 | 0.26 | 0.26 |
From the 1996-97 data, the number of events selected is 1009, 4035, and 4634, in the lepton+“D”, lepton+tracks, and Charge Dipole analyses, respectively. The relevant properties of these samples have been extracted from the simulation and are presented in Table 1. The study of the time dependence of the oscillations is performed with the amplitude method [7] in which the oscillation amplitude is measured at a series of fixed values. The oscillation probability becomes . This method is equivalent to performing a Fourier transform analysis and has the advantage of straightforward combination of several measurements with correlated statistical and systematic uncertainties.
The measured amplitudes for the three analyses are combined and shown in Fig. 4, taking care of the statistical overlap between the two semileptonic methods by removing 445 lepton+“D” events from the lepton+tracks sample. The dominant sources of systematic uncertainty have been examined. The fraction of produced in the simulated decays was varied according to , and the resolution for both decay length and boost reconstruction was varied by . The combined amplitude measurements allow the following regions to be excluded at the 95% C.L.: ps-1 and ps-1. These regions obey the requirement . This is to be compared with an expected 95% C.L. lower limit sensitivity of 4.6 ps-1 corresponding to the value of for which .
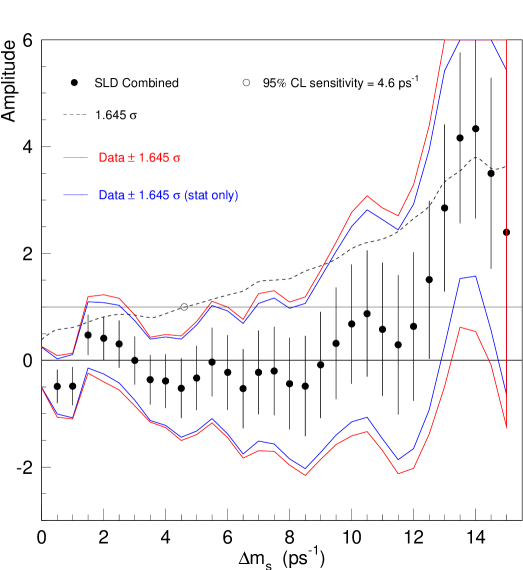
The excellent proper time resolution results in a relatively small growth of with increasing , indicating that SLD will be sensitive to high values of with a modest increase in statistics. Studies show that a 95% C.L. lower limit sensitivity of 20 ps-1 can be achieved with a million hadronic decays.
4. Search for Decays
It has been suggested that the long-standing puzzle of the low semileptonic branching ratio in conjunction with a low charm yield could be resolved by an enhanced branching ratio ( rather than 0.2% in the SM) for transitions of the type [8]. Such a large branching ratio would be clearly visible in the decay kaon spectrum at high momentum [8]. SLD has searched for an enhancement in the decay kaon momentum transverse to the flight direction using the 1993-95 data sample of 150,000 hadronic decays [9]. The search concentrates on a sample of topological vertices containing kaons identified in the Cherenkov Ring Imaging Detector and with transverse momentum GeV/c. Vertices are required to have GeV and vertex fit probability greater than 5% to enhance the fraction of signal events. The difference between the number of kaons in the data and the MC (which includes only the dominant transition) was found to be (stat) (syst). This analysis has been updated with another 150,000 hadronic decays collected in 1996-97 and the (data-MC) difference is found to be (stat) (syst) in that sample. As a check of the detector simulation, the distributions of identified muons attached to the vertex for data and MC are compared and found to agree well. Furthermore, good overall agreement between data and MC is obtained in the kaon distribution for vertices with fit probabilities —a sample significantly enhanced in decays to single- and double-charm final states.
Thus, no significant enhancement is observed in the data (see Fig. 5) indicating no evidence for enhanced transitions.

References
- [1] K. Abe et al. (SLD Collaboration), Phys. Rev. D 53, 1023 (1996).
- [2] I. I. Bigi et al., in B Decays, ed. S. Stone (World Scientific, New York, 1994), p. 132.
- [3] M. Neubert and C.T. Sachrajda, Nucl. Phys. B483, 339 (1997).
- [4] K. Abe et al. (SLD Collaboration), Measurement of the and Lifetimes using Topological Vertexing at SLD, SLAC-PUB-7635, Aug. 1997.
- [5] D. Jackson, Nucl. Instrum. Meth. A 388, 247 (1997).
- [6] P. Paganini, F. Parodi, P. Roudeau, A. Stocchi, Measurements of the and Parameters of the Matrix and Perspectives, hep-ph/9711261 and hep-ph/9802289.
- [7] H.-G. Moser and A. Roussarie, Nucl. Instrum. Meth. A 384, 491 (1997).
- [8] A. Kagan and J. Rathsman, Hints for Enhanced from Charm and Kaon Counting, hep-ph/9701300.
- [9] M. Daoudi et al. (SLD Collaboration), Search for CP Violation and in Inclusive B Decays, SLAC-PUB-7682, Dec. 1997.