Measurement of from LEP2
In 1997 each LEP experiment collected approximately of data at a center-of-mass energy of GeV. These data yield a sample of candidate events from which the mass of the W boson, , is measured. The LEP combined result, including data taken at and GeV and assuming the Standard Model relation between the W decay width and mass, is GeV, where the errors correspond to experimental, colour-reconnection/Bose-Einstein, and LEP beam energy uncertainties respectively.
1 Introduction
The success of the Standard Model (SM) over the last two decades should not obscure the importance of thoroughly investigating the weak interaction. It is interesting to consider that 15 years ago, when neutrino scattering experiments had measured , the following SM constraints were available :
| (1) | |||||
| (2) |
Tree level deviations could be accommodated in those errors! Today we have measured to , to GeV, and to GeV — the success of the SM is so thorough that it can only be wrong at the quantum loop level, and even then, beyond leading order. Despite this rousing success, it is still necessary to test the SM by confronting experimental observations with theoretical predictions as any deviations might point to new physics. As a fundamental parameter of the SM, the mass of the W boson, , is of particular importance.
Aside from being an important test of the SM in its own right, the direct measurement of can be used to set constraints on the mass of the Higgs boson, , by comparison with theoretical predictions involving radiative corrections sensitive to . The constraints imposed using are complimentary to the constraints imposed by the asymmetry (, , ,…) and width (, , ,…) measurements. For example, the very precise asymmetry measurements presently yield the tightest constraints on , but are very sensitive to the uncertainty in the hadronic contribution to the photon vacuum polarisation, . In contrast, the constraint afforded by a direct measure of is comparably tight but with a much smaller sensitivity to , and is presently dominated by statistical uncertainties .
1.1 WW Production at LEP
At LEP W bosons are predominantly produced in pairs through the reaction , with each W subsequently decaying either hadronically (), or leptonically (, , , or ). This yields three possible four-fermion final states, hadronic (), semi-leptonic (), and leptonic (), with branching fractions of , , and respectively. The production cross-section varies from pb at GeV to pb at GeV. These can be contrasted with the production cross-sections for the dominant backgrounds pb, pb, pb, and pb. Aside from the process, which falls from pb at GeV, these background cross-sections vary slowly for GeV, when the process begins to turn-on.
1.2 LEP Measurement Techniques
There are two main methods available for measuring at LEP2. The first exploits the fact that the production cross-section is particularly sensitive to for . In this threshold (TH) region, assuming SM couplings and production mechanisms, a measure of the production cross-section yields a measure of . In early 1996 the four LEP experiments collected roughly of data at GeV, resulting in a combined determination of the W boson mass of GeV, where the errors correspond to experimental and LEP beam energy uncertainties respectively .
The second method uses the shape of the reconstructed invariant mass distribution to extract a measure of . This method is particularly useful for GeV where the production cross-section is larger and phase-space effects on the reconstructed mass distribution are smaller. Each experiment collected roughly at GeV in later 1996, and in 1997, roughly at GeV. Since most of the LEP2 data has been collected at center-of-mass energies well above the threshold, the LEP2 determination is dominated by these direct reconstruction (DR) methods. For this reason, the rest of this article will concentrate on the details of this method.
2 Direct Reconstruction of
To measure using direct reconstruction techniques one must
-
1.
Select events.
-
2.
Obtain the reconstructed invariant mass,, for each event.
-
3.
Extract a measure of from the distribution.
Each of these steps are discussed in detail in the section below and in Reference [5]. It should be noted that none of the LEP experiments presently exploits the final state in the DR methods aaaA measure of can be obtained from the channel by using the lepton energy spectrum. However, it is estimated to be a factor of 4-5 less sensitive than the measurements available from the other final states.; it is therefore discussed no further.
2.1 Event Selection
The expected statistical error on varies as, , so that high efficiency, high purity selections are important. The selection efficiencies and purities are given in Table 1 for each of the four LEP experiments.
For the data taken at GeV, these efficiencies and purities give approximately 700 candidate events per experiment, about 100 of which are non- background. The selection efficiencies have a total uncertainty of about (absolute) and have a negligible effect ( MeV) on the determination. The accepted background cross-sections have a total uncertainty of (relative) and effect the determination at the MeV level (cf. Section 4).
| channel | experiment | ||||
|---|---|---|---|---|---|
| A | D | L | O | ||
| (%) | 83 | 85 | 88 | 85 | |
| (%) | 83 | 65 | 80 | 80 | |
| (%) | 89 | 71 | 87 | 90 | |
| (%) | 96 | 94 | 96 | 94 | |
| (%) | 64 | – | 59 | 75 | |
| (%) | 93 | – | 87 | 83 | |
2.2 Invariant Mass Reconstruction
There are several methods available for reconstructing the invariant mass of a candidate. The best resolution is obtained by using a kinematic fit which exploits the fact that the center-of-mass energy of the collision is known a priori bbbStrictly speaking, this is not true since any initial state radiation (ISR) reduces the collision energy to less than twice the beam energy. The kinematic fits assume no ISR. The effect of ISR uncertainties is incorporated in the total systematic error discussed in Section 4.. The are two “flavours” of kinematic fit:
-
1.
4C-fit: Enforces constraints; yields two reconstructed masses per event, , one for each in the final state.
-
2.
5C-fit: In addition to the four constraints above, ignores the finite width of the and requires that ; yields a single reconstructed mass per event.
The type of fit used depends on the final state. For instance, in the and channels, because the prompt neutrino from the leptonic decay takes three degrees-of-freedom (), , the fits effectively become 1C and 2C fits respectively. For the channel, high energy neutrinos from the -decay itself lose at least one additional and so require that all 5 constraints be used, thus yielding a 1C fit cccSuch a fit is possible only if one assumes that the -lepton direction is given by the direction of the visible decay products associated with the ..
In the channel, since there are (nominally) four jets, there exist three possible jet-jet pairings. This pairing ambiguity gives rise to a combinatoric background unique to the channel. Each LEP experiment employs a different technique for choosing the best combination(s). Opal and L3 use the 5C-fit probabilities (the equal mass constraint yields a different fit for each combination) to choose the two best combinations per event. At the cost of some additional combinatorics, this algorithm has the correct combination among those chosen about of the time. Delphi and Aleph employ a 4C-fit and exploit information from the mass difference, , and the dijet opening angles to choose the best combination. The algorithm employed by Aleph chooses a single combination per event; this combination corresponds to the correct combination approximately of the time at no additional cost in combinatorics. Delphi uses all combinations and weights each according to the probability that it corresponds to the correct combination.
2.3 Extracting
The ensemble of selected events yields a distribution from which a measure of is extracted. There are several methods available for extracting . Aleph , L3 , and Opal all employ a traditional maximum likelihood comparison of data to Monte Carlo (MC) spectra corresponding to various . In addition to its simplicity, this method has the advantage that all biases (ie. from resolution, ISR, selection, etc.) are implicitly included in the MC spectra. The disadvantage of this method is that it does not make optimal use of all available information. Delphi employs a convolution technique, which makes use of all available information; in particular, events with large fit-errors are de-weighted relative to fits with small fit-errors. The convolution has the limitations that it requires various approximations (ie. the resolution is often assumed to be Gaussian) and often requires an a posteriori correction as the fit procedure does not account for all biases, notably from ISR and selection.
| channel | ||
|---|---|---|
| exp | ||
| A | ||
| D | ||
| L | ||
| O | ||
| LEP | ||
| channel | ||
|---|---|---|
| exp | ||
| A | ||
| D | ||
| L | ||
| O | ||
| LEP | ||
3 Results
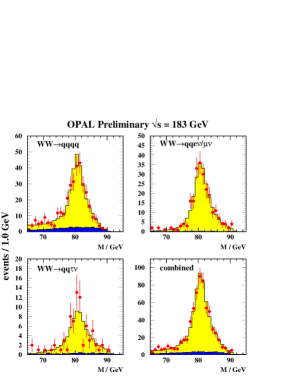
The results from each LEP experiment, using data collected at GeV, are given in Table 2 for channel and in Table 3 for the channel. Also included is the mass obtained when combining all four measurements. For the LEP combinations, the ISR, hadronization, LEP beam energy, and color-reconnection/Bose-Einstein (CR) uncertainties are taken as completely correlated between the four experiments. Note that these numbers are preliminary. The errors given correspond to the observed statistical and the total systematic (including that associated with the LEP beam energy) uncertainties respectively. For the channel, the error associated with CR uncertainties is given separately and is taken as a MeV common error. Also shown in Tables 2 and 3 is the expected statistical error, , for each experiment. As an example, the Opal fits are shown in Figure 1.
Using all data taken at GeV, the LEP combined using DR methods for the and channels separately is:
| (3) | |||||
| (4) |
These are consistent with one another within of their statistical errors.
4 Systematic Errors
The systematic errors for a typical LEP experiment are given in Table 4. It should be noted that for all four LEP experiments the errors associated with ISR, hadronization, and four-fermion interference uncertainties are limited by the statistics of the comparison. Uncertainties associated with the selection efficiencies and accepted backgrounds are included in the line labeled “fit procedure”. For the channel the single largest systematic uncertainty is due to uncertainties associated with detector effects (eg. energy scales, resolutions, and modelling). These errors are expected to decrease as more data is collected. For the channel the dominant systematic uncertainty is due to CR effects. An additional of data will yield results that begin to constrain the available models and thus improve these errors. See the summaries by G.Duckeck and H.Hoorani in these proceedings for more details.
5 Conclusions
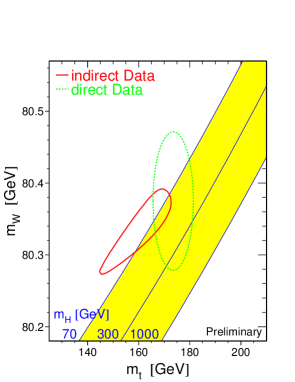
Using approximately of data collected at and 172 GeV and at GeV the LEP experiments have measured the mass of the W boson. The LEP combined result, including data from all center-of-mass energies and assuming the Standard Model relation between the W decay width and mass, is GeV, where the errors correspond to experimental, colour-reconnection/Bose-Einstein, and LEP beam energy uncertainties respectively. Figure 2 compares the contour for the direct measurements of and to the contour inferred from precision electroweak measurements at LEP, SLD, and the TeVatron .
During 1998 LEP is expected to deliver per experiment at GeV. This additional data will increase the present statistics available for the DR method by more than a factor of two and will allow for experimental constraints on various color-reconnection and Bose-Einstein models in the final state.
Acknowledgements
Many thanks to my colleagues in the LEP Electroweak working group for their comments and suggestions.
| systematic | (MeV) | |
|---|---|---|
| source | ||
| initial state radiation | 15 | 15 |
| hadronization | 25 | 30 |
| four fermion | 20 | 20 |
| detector effects | 45 | 50 |
| fit procedure | 30 | 30 |
| Sub-total | 65 | 70 |
| beam energy | 30 | 30 |
| CR/BE | – | 100 |
| Total | 71 | 126 |
References
References
- [1] W.J. Marciano and A.Sirlin, Phys. Rev. D 29, 945 (1984).
- [2] LEP Electroweak Working Group, A Combination of Preliminary Electroweak Measurements and Constraints on the Standard Model, LEPEWWG/98-01, April 1998.
- [3] See for example G. Degressi, et al., Phys. Lett. B 418, 209 (1998).
- [4] Opal Collaboration, Phys. Lett. B 389, 416 (1996); Delphi Collaboration, Phys. Lett. B 397, 158 (1997); L3 Collaboration, Phys. Lett. B 398, 223 (1997); Aleph Collaboration, Phys. Lett. B 401, 347 (1997).
- [5] L3 Collaboration, Phys. Lett. B 413, 176 (1997); Opal Collaboration, Eur. Phys. J. C 1, 395 (1998); Aleph Collaboration, Phys. Lett. B 422, 384 (1998); Delphi Collaboration, Measurement of the W Pair Cross-section and of the W Mass in Interactions at 172 GeV, submitted to Euro.Phys.J. C.
- [6] D0 Collaboration, Phys. Rev. Lett. 80, 3008 (1998); Cdf Collaboration, Phys. Rev. Lett. 75, 11 (1995).
- [7] Cdf Collaboration, Phys. Rev. Lett. 80, 2779 (1998); Cdf Collaboration, Phys. Rev. Lett. 80, 2767 (1998); D0 Collaboration, Direct Measurement of the Top Quark Mass, submitted to Phys.Rev. D.