Study of the atmospheric neutrino flux
in the multi-GeV energy range
The Super-Kamiokande Collaboration
Y.Fukudaa, T.Hayakawaa, E.Ichiharaa, K.Inouea, K.Ishiharaa, H.Ishinoa, Y.Itowa, T.Kajitaa, J.Kamedaa, S.Kasugaa, K.Kobayashia, Y.Kobayashia, Y.Koshioa, K.Martens111Present address: Department of Physics and Astronomy, State University of New York, Stony Brook, M.Miuraa, M.Nakahataa, S.Nakayamaa, A.Okadaa, M.Oketaa, K.Okumuraa, M.Otaa, N.Sakuraia, M.Shiozawaa, Y.Suzukia, Y.Takeuchia, Y.Totsukaa, S.Yamadaa, M.Earlb, A.Habigb, E.Kearnsb, S.B.Kimb,222Present address: Department of Physics, Seoul National University, Seoul 151-742, Korea, M.D.Messierb, K.Scholbergb, J.L.Stoneb, L.R.Sulakb, C.W.Walterb, M.Goldhaberc, T.Barszczakd, W.Gajewskid, P.G.Halversond,333Present address: NASA, JPL, Pasadena, CA 91109, USA, J.Hsud, W.R.Kroppd, L.R. Priced, F.Reinesd, H.W.Sobeld, M.R.Vaginsd, K.S.Ganezere, W.E.Keige, R.W.Ellsworthf, S.Tasakag, J.W.Flanaganh,444Present address: Accelerator Laboratory, High Energy Accelerator Research Organization (KEK), A.Kibayashih, J.G.Learnedh, S.Matsunoh, V.Stengerh, D.Takemorih, T.Ishiii, J.Kanzakii, T.Kobayashii, K.Nakamurai, K.Nishikawai, Y.Oyamai, A.Sakaii, M.Sakudai, O.Sasakii, S.Echigoj, M.Kohamaj, A.T.Suzukij, T.J.Hainesk,d E.Blaufussl, R.Sanfordl, R.Svobodal, M.L.Chenm, Z.Connerm,555Present address: Enrico Fermi Institute, University of Chicago, Chicago, IL 60637 USA J.A.Goodmanm, G.W.Sullivanm, M.Morin,666Present address: Institute for Cosmic Ray Research, University of Tokyo, J.Hillo, C.K.Jungo, C.Maugero, C.McGrewo, E.Sharkeyo, B.Vireno, C.Yanagisawao, W.Dokip, T.Ishizukap,777Present address: Dept. of System Engineering, Shizuoka University Hamakita, Shizuoka 432-8561, Japan, Y.Kitaguchip, H.Kogap, K.Miyanop, H.Okazawap, C.Sajip, M.Takahatap, A.Kusanoq, Y.Nagashimaq, M.Takitaq, T.Yamaguchiq, M.Yoshidaq, M.Etohr, K.Fujitar, A.Hasegawar, T.Hasegawar, S.Hatakeyamar, T.Iwamotor, T.Kinebuchir, M.Kogar, T.Maruyamar, H.Ogawar, A.Suzukir, F.Tsushimar, M.Koshibas, M.Nemotot, K.Nishijimat, T.Futagamiu, Y.Hayatou,888Present address: Institute of Particle and Nuclear Studies, High Energy Accelerator Research Organization (KEK), Y.Kanayau, K.Kaneyukiu, Y.Watanabeu, D.Kielczewskav,d,999Supported by the Polish Committee for Scientific Research., R.Doylew, J.Georgew, A.Stachyraw, L.Waiw, J.Wilkesw, K.Youngw
aInstitute for Cosmic Ray Research, University of Tokyo, Tanashi,
Tokyo 188-8502, Japan
bDepartment of Physics, Boston University, Boston, MA 02215, USA
cPhysics Department, Brookhaven National Laboratory, Upton, NY 11973, USA
dDepartment of Physics and Astronomy, University of California, Irvine,
Irvine, CA 92697-4575, USA
eDepartment of Physics, California State University,
Dominguez Hills, Carson, CA 90747, USA
fDepartment of Physics, George Mason University, Fairfax, VA 22030, USA
gDepartment of Physics, Gifu University, Gifu, Gifu 501-1193, Japan
hDepartment of Physics and Astronomy, University of Hawaii,
Honolulu, HI 96822, USA
iInstitute of Particle and Nuclear Studies, High Energy Accelerator
Research Organization (KEK), Tsukuba, Ibaraki 305-0801, Japan
jDepartment of Physics, Kobe University, Kobe, Hyogo 657-8501, Japan
kPhysics Division, P-23, Los Alamos National Laboratory,
Los Alamos, NM 87544, USA.
lPhysics Department, Louisiana State University,
Baton Rouge, LA 70803, USA
mDepartment of Physics, University of Maryland,
College Park, MD 20742, USA
nDepartment of Physics, Miyagi University of Education, Sendai,
Miyagi 980-0845, Japan
oDepartment of Physics and Astronomy, State University of New York,
Stony Brook, NY 11794-3800, USA
pDepartment of Physics, Niigata University,
Niigata, Niigata 950-2181, Japan
qDepartment of Physics, Osaka University, Toyonaka, Osaka 560-0043, Japan
rDepartment of Physics, Tohoku University, Sendai, Miyagi 980-8578, Japan
sThe University of Tokyo, Tokyo 113-0033, Japan
tDepartment of Physics, Tokai University, Hiratsuka, Kanagawa 259-1292,
Japan
uDepartment of Physics, Tokyo Institute for Technology, Meguro,
Tokyo 152-8551, Japan
vInstitute of Experimental Physics, Warsaw University, 00-681 Warsaw,
Poland
wDepartment of Physics, University of Washington,
Seattle, WA 98195-1560, USA
Abstract
The flavor ratio of the atmospheric neutrino flux and its zenith angle dependence have been studied in the multi-GeV energy range using an exposure of 25.5 kiloton-years of the Super-Kamiokande detector. By comparing the data to a detailed Monte Carlo simulation, the ratio was measured to be . In addition, a strong distortion in the shape of the -like event zenith angle distribution was observed. The ratio of the number of upward to downward -like events was found to be 0.52, with an expected value of , while the same ratio for the -like events was consistent with unity.
Introduction
Cosmic ray interactions in the atmosphere produce neutrinos. The flavor ratio of the atmospheric neutrino flux, has been calculated to an accuracy of better than 5% in the range from 0.1 GeV to higher than 10 GeV[1, 2]. The calculated flux ratio has a value of about two for energies 1 GeV and increases with increasing neutrino energy. For neutrino energies higher than a few GeV, the fluxes of upward and downward going neutrinos are expected to be nearly equal; geomagnetic field effects on atmospheric neutrinos in this energy regime are expected to be small because the primary cosmic rays that produce these neutrinos have rigidities exceeding the geomagnetic cutoff rigidity (10 GeV/).
The flavor ratio of the atmospheric neutrino flux has been studied by several massive underground detectors. In these experiments, the ratio of the number of -like to the number of -like neutrino interactions observed in the detector was compared with Monte Carlo (MC) simulation; i.e., the ratio was measured to study the atmospheric neutrino flavor ratio . In the measurement of , uncertainties in the neutrino flux and cross sections cancel. The expected value for is unity if there is agreement between the experiment and the theoretical prediction. Three experiments – Kamiokande [3], IMB-3 [4] and Soudan 2 [5] – observed an smaller than unity in the energy region 1 GeV, although two experiments – Frejus [6] and NUSEX [7] – reported no deviation from unity with smaller data samples. Super-Kamiokande [8] recently reported a small for 1.33 GeV. The measured small values of suggest the possibility of neutrino oscillations.
The value of in the “multi-GeV” ( 1 GeV) energy region has been studied by fewer experiments. Kamiokande [9] observed a value of smaller than unity, as well as a dependence of this ratio on the zenith angle. Since there is a large difference in the neutrino path-length between upward-going ( 10,000 km) and downward-going neutrinos ( 20 km), a zenith angle dependence of can be interpreted as additional evidence for neutrino oscillations. IMB-3 has reported a result in a similar energy range [10], but its smaller data sample neither confirmed nor ruled out the Kamiokande results.
In this paper, the atmospheric neutrino measurement in the multi-GeV energy range from the Super-Kamiokande detector is presented. With an analyzed fiducial volume exposure of 25.5 kiloton-years, and the zenith angle dependence of the flux in this region were measured with much higher statistics than previous experiments. In addition to higher statistics, due to the much larger dimensions of the detector, Super-Kamiokande can contain multi-GeV muon events, making possible for the first time a measurement of the momentum spectrum of -like events up to 8 GeV/.
Super-Kamiokande is a cylindrical 50 kiloton ring imaging water Cherenkov detector. The detector consists of an inner detector volume completely surrounded by an outer detector layer. The two detectors are optically separated by a pair of opaque sheets which enclose a dead region 55 cm in thickness. The inner detector is 36.2 m high and 33.8 m in diameter; these dimensions are sufficient to contain muons of momentum up to 8 GeV/. The inner detector is lined with 11,146 50 cm diameter photomultiplier tubes (PMT). The photocathode coverage of the inner wall surface is 40%. The outer layer of water is 2.6 2.75 m thick and is instrumented with 1885 outward facing 20 cm diameter PMTs. To maximize light collection, a reflective surface of Tyvek covers the walls of the outer detector, and each PMT is fitted with a 60 cm 60 cm plate of wavelength shifter. The outer detector is used to reduce background entering from the surrounding rock and to identify penetrating muons. The trigger required at least 29 inner detector PMT hits, corresponding to the mean number of hit PMTs for a 5.7 MeV electron. The atmospheric neutrino data reduction was applied to raw input triggers from 414 live days of exposure.
Data reduction
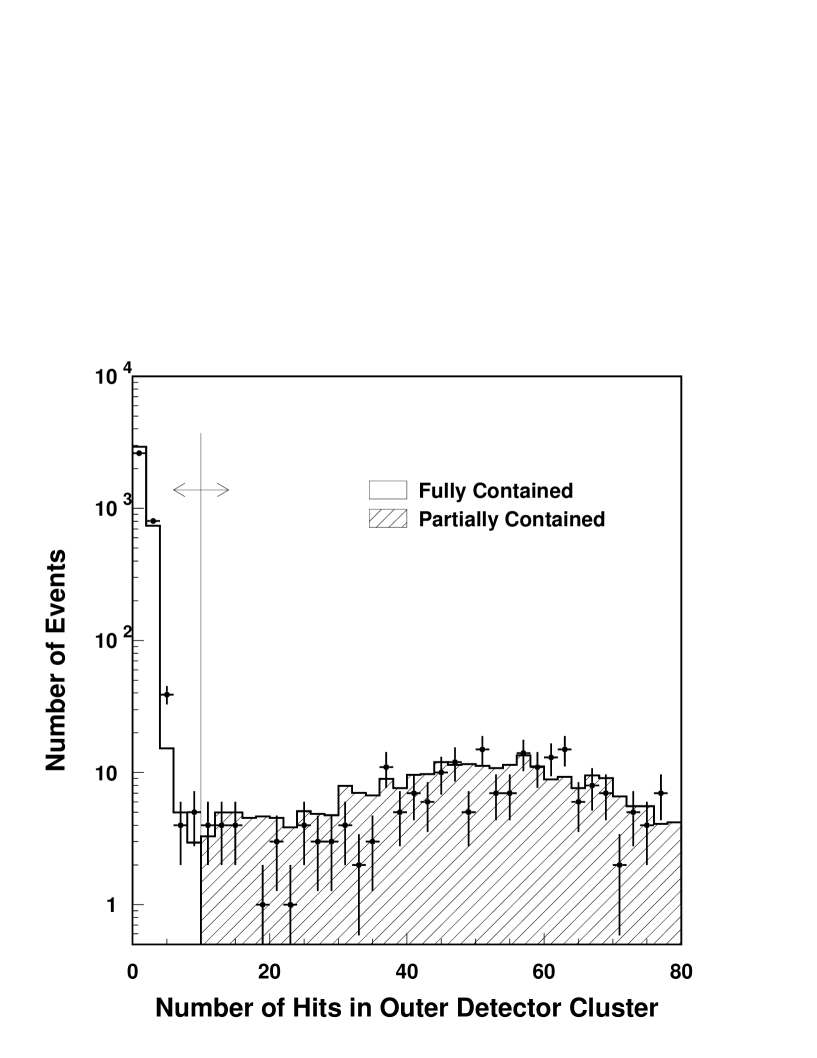
Atmospheric neutrino events have two basic topologies which determine the data reduction stream. If all of the visible energy is contained within the inner detector, the event is called “fully contained” (FC). An event for which some of the produced particles deposit visible energy in the outer detector is called “partially contained” (PC). More precisely, a clustering algorithm is applied to the hits in the outer detector: 10 hits are required in an outer detector cluster for an event to be classified as PC, or 10 hits to be classified as FC. Figure 1 shows the distribution of the number of hits in an outer detector cluster for atmospheric neutrino interactions. The separation between FC and PC events is clearly seen. For both topologies, the interaction vertex is required to be inside the 22.5 kton fiducial volume, defined as the volume 2 m from the inner detector PMT planes.
The multi-GeV FC reduction and reconstruction chains are identical to those used for the sub-GeV event sample, which have been described in detail in another paper [8]. The multi-GeV FC data differed from the sub-GeV FC data only in that we required 1.33 GeV. The total number of multi-GeV FC events in the fiducial volume was 792.
According to Monte Carlo estimates, the PC data is a 980.3% pure sample of charged current (CC) scattering events. PC events are typically characterized by a single muon with energy sufficient to escape the inner detector. The data reduction for PC events differed significantly from the reduction for FC events, mainly due to the presence of additional hits in the outer detector. Because of these extra hits from the exiting muon, a simple criterion based on the number of hit outer detector tubes could not be used to reject cosmic ray background. Several automated data reduction criteria were used to eliminate background in the PC sample before a final reduction by physicist scanners based on a visual display of the event data.
(i) Low energy events with fewer than 1000 total p.e. were removed, corresponding to muons (electrons) with momentum less than 310(110) MeV/. By definition, an exiting (PC) particle must have reached the outer detector from the inner fiducial volume, and so must have had a minimum track length of about 2.5 meters (corresponding to muons with MeV/ momentum).
(ii) The time distribution and spatial clustering of hits in the inner and outer detectors were used in the next reduction step. Events for which the width of the time distribution of hits in the outer detector exceeded 240 nanoseconds were rejected, as well as events with two or more spatial clusters of outer detector hits. These cuts eliminated many through-going muons, which typically left two well separated clusters in the outer detector. Muons which clipped the edges of the detector were eliminated based upon the topology of the outer detector cluster. Cosmic ray muons which entered and stopped in the inner volume of the detector were eliminated by excluding events with a relatively small number of inner detector photoelectrons near the outer detector cluster (1000 p.e. within 2 m). This cut did not remove PC neutrino events because PC events produced large numbers of photoelectrons in the region where the particle exited.
(iii) In the next step, a simple vertex fit and charge weighted direction estimate were used. A requirement of hits in the outer detector within 8 meters of the back-extrapolated entrance point was imposed. The remaining background after this cut consisted of muons which left few or no entrance hits in the outer detector. These events were rejected by requiring the angle subtended by the earliest inner detector PMT hit, the vertex, and the back-extrapolated entrance point to be . Remaining corner clipping muons were rejected by requiring a fitted vertex at least 1.5 meters away from the corners of the inner detector volume. A through-going muon fitter was also applied to reject events with a well fit muon track greater than 30 meters long.
(iv) A precise automatic fitting algorithm was applied to further reject entering events, again requiring 10 hits in the outer detector within 8 meters of the more accurately back-extrapolated entrance point. At this stage, a minimum requirement of 3000 total p.e. was applied. This requirement corresponded to 350 MeV of visible energy, well below that of any exiting muon. It was estimated that 0.1% of the PC events in the fiducial volume were eliminated by this requirement. After this step, 758 events remained in the full detector volume.
(v) The remaining events were scanned with an interactive graphical event display to eliminate the remaining background. There were two independent scans of the data, with Monte Carlo events interspersed randomly and in proportion to livetime. Scanners were asked to classify each event as a neutrino (FC or PC), or various types of known background. Most (85%) of the events eliminated by scanning were entering events (through-going or stopping muons). A third and final scan was used to resolve disputes between the first two independent scans. Blind scanning of Monte Carlo events mixed in with the data showed that the scanning efficiency was 99% in the fiducial volume.
Applying the same reduction steps to Monte Carlo generated atmospheric neutrino events yielded an overall data reduction efficiency of 885% for interactions in the fiducial volume. Inefficiency accrued at the few percent level in each automated reduction stage. After the visual scan, 352 (230) PC events remained in the full (fiducial) detector volume.
The vertex resolution for the FC single-ring -like (-like) events was estimated to be 23 (42) cm and for PC events it was estimated to be 104 cm.
Flavor ratio
For the ratio in the multi-GeV region, we used FC single-ring events with Evis 1.33 GeV and PC events. In Table 1, the numbers of observed events are summarized along with the corresponding Monte Carlo predictions. For FC events, lepton flavor was determined by the particle identification method described in Ref.[8]. According to Table 1, the PC events comprise a 98% pure charged-current (CC) sample; therefore we classify all PC events as -like. FC -like (-like) events were a 99% (84%) pure CC (CC ) sample. The relatively low purity of the -like sample was due to the incompleteness of the separation of the electromagnetic shower events from CC and neutral-current (NC) interactions which produced single and multiple pions.
From these data, the ratio for the multi-GeV region was obtained:
where is the number of FC -like events and is the sum of the numbers of FC and PC -like events. The same ratio for FC events only is = 0.64 0.07 0.10. This result is consistent with the previous results from Kamiokande [9] in the same energy range and is also consistent with the results in the lower energy region obtained by Kamiokande [3] IMB-3 [4], Soudan-2 [5] and Super-Kamiokande [8]. It is significantly smaller than unity.
The systematic uncertainty in came from several sources: 5% from uncertainty in the atmospheric flux ratio , 4.3% from the uncertainties in the CC neutrino cross section and nuclear effects in H2O targets, 4.1% from corresponding uncertainties for NC interactions, 1.6% from the uncertainty of the cosmic ray primary energy spectrum, 1% from hadron tracking simulation, 6% from the single and multi-ring separation for FC events, 4% from energy scale determination and 0.5% from energy resolution uncertainty, 3% from PC reduction efficiency, 3% from particle type misidentification, 2% from the vertex reconstruction, 1% from uncertainty in the separation between FC and PC events, and 3% from Monte Carlo statistical uncertainty. In addition, uncertainties on from event sample contamination included: 1% from cosmic muons, less than 0.1% from the neutron-induced background, and less than 0.5% from “flasher” events (Ref.[8]). Adding all of these uncertainties in quadrature, we estimated the total systematic uncertainty on to be 12%.
Fig. 2 shows as a function of the distance of the reconstructed vertex to the nearest inner detector wall . From this figure, there is no evidence for neutron, gamma-ray, or cosmic ray muon background which could change near the edges of the fiducial volume. By scanning FC and PC events, it was determined that the high value of the bin nearest to =0 was mostly due to a contamination of cosmic ray muon background which entered into the inner detector through less efficient regions of the outer detector. However, the high value (by 2 standard deviations) at the bin just inside the fiducial volume was due to a relative deficit of -like events by 2.0 sigma (34% deficit) and a 1.1 sigma excess of FC -like and PC events (16% excess). Scanning of events in this bin showed no evidence for background contamination.
For FC events, lepton energy was reconstructed with 4% uncertainty (3% uncertainty from the estimated energy resolution and 2.5% uncertainty from the absolute energy calibration). Fig. 3 shows reconstructed momentum distributions for : (a) FC -like events, (b) FC -like events and (c) as a function of momentum. The values of /d.o.f. for comparison of the shapes of the MC and data distributions were 4.4/6 and 1.4/3 for the -like and -like distributions respectively. (c) was consistent with a flat distribution within the statistical uncertainty (/d.o.f. was about 2.3/3). For the PC events, only a minimum energy for the muon is measurable. Fig. 4 shows the minimum momentum () distribution assuming that the exiting particle is a muon. The shape is consistent with the Monte Carlo prediction (/d.o.f. = 3.7/5). The mean neutrino energies of our sample were approximately 5 GeV, 3 GeV, 15 GeV and 9 GeV for FC -like, FC -like, PC, and FC -like+PC respectively.
| Data | Monte Carlo | |||||
| total | CC(q.e.) | CC(q.e.) | NC | |||
| FC events | ||||||
| single ring | 394 | 411.6 | 155.4(70.1) | 239.7(125.6) | 16.6 | |
| -like | 218 | 182.7 | 154.1(69.9) | 12.9(1.7) | 15.6 | |
| -like | 176 | 229.0 | 1.2(0.2) | 226.8(123.9) | 0.9 | |
| multi ring | 398 | 433.7 | 129.2(9.0) | 237.2(8.6) | 67.1 | |
| total | 792 | 845.2 | 284.5(79.0) | 477.0(134.3) | 83.7 | |
| PC events | ||||||
| total | 230 | 287.7 | 4.4(0.8) | 281.5(51.6) | 1.9 | |
A second FC event analysis using a completely independent analysis chain was also performed. The reduction and reconstruction steps were identical to those performed for the sub-GeV “Analysis B” FC data sample described in Ref.[8]. For Analysis B, which did not include a PC event selection, the multi-GeV sample comprised events with GeV GeV. The total number of multi-GeV FC events in the fiducial volume was 602. Among the FC multi-GeV single-ring events, 100 events were classified as -like and 109 events were classified as -like. Based on an independent Monte Carlo sample [8] of 10.2 years of equivalent exposure, the predicted numbers of FC -like and -like events were 91.6 and 141.1, respectively. The independent analysis result was .
Differences between the two analyses were consistent with estimated efficiencies and resolutions. Although approximately the same live time was analyzed, there were fewer events in the final Analysis B sample due to the upper energy cut and a tighter single-ring selection. The Analysis B result confirmed that the value of was smaller than unity.
Zenith angle dependence
The angular correlation between the neutrino direction and the produced charged lepton direction for multi-GeV neutrinos is (RMS). Therefore the zenith angle distribution of the leptons reflects that of the neutrinos.
Fig. 5 shows the distribution for (a) FC -like events, (b) FC -like +PC events, (c) FC -like events and (d) PC events, where is the zenith angle of the particle direction, and corresponds to upward-going (downward-going). The neutrino flux calculation has a 20% uncertainty in absolute flux; therefore we compared only the shape of the zenith angle distribution for data and Monte Carlo. The values for the shape analysis were : /d.o.f. = 4.5/4, 27.3/4, 20.0/4 and 16.0/4, for Figs. 5 (a) through (d) respectively. For -like events, the data were consistent with Monte Carlo, but for -like events, there was an obvious discrepancy. Fig. 6 shows as a function of zenith angle. The value of /d.o.f. with respect to a flat line through the mean is about 8.2/4. Fig. 5 and Fig. 6 show that there is a significant deficit in the number of upward-going -like events relative to the number of downward-going ones. The ratio of the number of upward-going () events to the number of downward-going () events is shown in Table 2. Horizontal-going events () were excluded. A significant deficit was present in for both FC -like and PC events. The value of for -like events was consistent with expectations. The statistical significance of the asymmetry for -like data was 5.7. These results confirmed the Kamiokande results [9] with smaller statistical uncertainty.101010From Fig. 3 of Ref. [9], the Kamiokande value for the multi-GeV -like (-like) data was 0.58 (1.38).
Several sources of systematic uncertainty on the up/down ratio were considered. First, the up/down ratios for -like events, -like events and for the two calculated fluxes [1, 2] were compared. Both calculations predicted up/down ratios very close to unity. The predicted ratio differed between the two calculations by 2% and 1% for the -like and -like events, respectively, and the up/down ratio of differed by 2% between the two calculations. These two calculations do not assume the existence of a 1 km mountain over the Super-Kamiokande detector; the rock reduces the neutrino flux due to muons which are stopped before they can decay in flight. We estimated the effect of the presence of rock on the predicted flux: was increased by about 2% and 1.5% for -like and -like events respectively. The presence of rock changed the up/down ratio of by less than 1%. We did not expect any other significant sources of systematic uncertainty in the predicted up/down ratio. The total up/down systematic uncertainty in the Monte Carlo is shown in Table 2.
We estimated that the detector PMT gain was 3% higher for down-going particles than for up-going particles by studying decay electrons from stopping cosmic ray muons [8]. This gain asymmetry caused 2.2% and 3.5% uncertainty in the up/down ratio for the -like and FC -like events, respectively. However, the gain asymmetry caused less than 0.1% uncertainty in the up/down ratio for the PC events due to the looseness of the energy cut in the selection of the PC events. The gain asymmetry caused a 0.6% uncertainty on the up/down ratio of . A contamination of non-neutrino background such as down-going cosmic muons could have directional correlation. The maximum contribution to the uncertainty in the up/down ratio from contamination was estimated to be 0.5%, 2.0% and 2.1% for the -like events, -like events, and , respectively. From these studies, the total systematic uncertainties in the up/down ratios for the data were estimated and are shown in Table 2. The total systematic uncertainty in the up/down ratio of was 3%, which was much smaller than the statistical uncertainty.
The validity of the present analysis can be tested by measuring the azimuth angle distribution of the incoming neutrinos, which is insensitive to a possible influence from neutrino oscillations. The shape of the azimuth angle distributions agreed with the Monte Carlo predictions which were nearly flat. The shape comparison /d.o.f. values were 9.1/7, 3.3/7 and 3.7/7 for -like, FC -like and PC events, respectively. Therefore, the only observed directional distortion was for the -like zenith angle distribution.
| e-like | 76 | 90 | 0.84 0.02 | 0.084 0.077 0.01 | ||
| data | (FC+PC) | 102 | 195 | 0.52 0.01 | 0.313 0.055 0.01 | |
| -like | (FC) | 45 | 96 | 0.47 0.02 | 0.362 0.079 0.02 | |
| (PC) | 57 | 99 | 0.58 0.01 | 0.269 0.077 0.01 | ||
| e-like | 67.6 | 66.8 | 1.01 0.06 0.03 | 0.006 0.029 0.01 | ||
| Monte Carlo | (FC+PC) | 189.3 | 193.6 | 0.98 0.03 0.02 | 0.011 0.017 0.01 | |
| -like | (FC) | 86.8 | 88.5 | 0.98 0.05 0.02 | 0.010 0.025 0.01 | |
| (PC) | 102.5 | 105.1 | 0.98 0.05 0.02 | 0.013 0.023 0.01 |
For Analysis B, the up/down ratio for -like events was 1.170.01 for data and 0.940.08 for Monte Carlo; the up/down ratio for -like events was 0.380.01 for data and 0.990.06 for Monte Carlo. The Analysis B result confirmed the significant up/down asymmetry for -like events.
Several studies were undertaken to evaluate whether it is possible to reproduce the observed distortion of the FC multi-GeV -like zenith angle distribution (in the absence of neutrino oscillations) by assuming various kinds of possible angular-dependent systematic biases. Angular-dependent muon detection efficiency, energy and track reconstruction were considered; in all cases investigated, consistency between Monte Carlo and data for -like events could only be attained by assuming unrealistically large systematic errors. From these studies, we conclude that an angular dependent systematic effect is unlikely to be responsible for the distortion of the -like zenith angle distribution.
Conclusions
The atmospheric neutrino data in the multi-GeV energy range collected from the Super-Kamiokande detector for the first 414 livetime-days are presented in this paper. The mean value of was significantly smaller than unity, . In addition, a strong deviation from expectation in the shape of the -like event zenith angle distribution was observed. The observed up/down asymmetry of the -like events, = 0.52 0.01, deviated from an expected up/down symmetry, whereas the -like distribution was consistent with the expected up/down symmetry. Two independent analyses yielded consistent results on these effects. While the zenith angle dependence of the -like data cannot be explained by any plausible systematic detector effect considered, the relative deficit of upward-going -like events from neutrinos that traveled a long distance suggests the disappearance of via neutrino oscillations.
We gratefully acknowledge the cooperation of the Kamioka Mining and Smelting Company. The Super-Kamiokande experiment has been built and operated from funding by the Japanese Ministry of Education, Science, Sports and Culture, and the United States Department of Energy.
References
-
[1]
M.Honda et al., Phys. Rev. D52(1995) 4985 ;
M.Honda et al, Phys. Lett. B248 (1990) 193. -
[2]
G. Barr et al, Phys. Rev. D39(1989) 3532 ;
V. Agrawal et al, Phys. Rev. D53(1996) 1314 ;
T.K. Gaisser and T. Stanev, Proc. 24th Int. Cosmic Ray Conf.(Rome) Vol.1 (1995) 694. -
[3]
K.S.Hirata et al., Phys. Lett. B205(1988) 416 ;
K.S.Hirata et al., Phys. Lett. B280(1992) 146. -
[4]
R. Becker-Szendy et al., Phys. Rev. D46(1992)
3720;
D. Casper et al., Phys. Rev. Lett. 66(1991) 2561. - [5] W.W.M Allison et al.. Phys. Lett. B391(1997) 491.
- [6] K. Daum et al., Z. Phys. C66(1995) 417.
- [7] M. Aglietta et al., Europhys. Lett. 8(1989) 611.
- [8] Y. Fukuda et al., the Super-Kamiokande Collaboration, Measurement of a small atmospheric neutrino ratio, Phys. Lett. B (1998), accepted for publication.
- [9] Y. Fukuda et al., Phys. Lett. B335(1994) 237.
- [10] R.Clark et al., Phys. Rev. Lett. 79(1997) 345.