DØ Findings on the Top Quark 111presented at the 1998 Rencontres de Physique de la Vallée d’Aoste on Results and Perspectives in Particle Physics, La Thuile, Italy, March 1–7, 1998.
Boaz Klima
Fermilab
for the DØ collaboration
(e-mail: klima@fnal.gov)
1 Introduction
Since the top quark was discovered [1, 2] by the DØ and CDF experiments at the Fermilab Tevatron collider in 1995, much of the effort has been focused on using all available information on the cadidate events to measure the production cross section and the top quark mass as precisely as possible.
In the Tevatron collider at a center of mass energy of top quarks are predominantly produced in pairs through annihilation () or gluon fusion (). According to the standard model a top quark decays almost 100% of the time into a and a quark. Each boson decays either into a charged lepton and a neutrino or into a pair of quarks. Our analysis channels are classified on the basis of the boson decay. The cleanest channel is the dilepton channel, 2 leptons + 2 neutrinos + 2 jets, where both bosons decay into leptons. The branching ratio is for decays into , , and channels. The single lepton ( or ) decay channel, where one boson decays leptonically and the other boson decays hadronically, has a branching ratio of , but it has a sizable background from +jets production. The all-jets decay channel, where both bosons decay hadronically, has a branching ratio of , but it has a huge QCD multijet background.
This paper reports the recent DØ results on the production cross section using the dilepton, single lepton [3], and all-jets [4] decay channels, and on the direct measurement of the top quark mass using the single lepton [5, 6] and dilepton events [7].
The results reported in this paper use the entire data sample with an integrated luminosity of about 125 pb-1, collected during the 1992-1996 collider run. Since our report on the discovery of the top quark [1], our data sample has more than doubled. DØ has optimized the analysis to maximize the expected precision of the production cross section measurement and improved the techniques on the measurements of the top quark mass.
2 Measurement of Production Cross Section
The triggers and the particle identification algorithms used in these analyses are described in detail in DØ publications [1, 8].
2.1 Dilepton Decay Channels
The signature of events in the dilepton decay channels is two high isolated leptons, two or more jets and large missing ( ) due to the presence of the two neutrinos.
The offline event selection requires that the isolated electrons have with and that the isolated muons have with . At least two jets are required to be reconstructed with a transverse energy above with . All jets are reconstructed using a cone algorithm with radius 0.5 in - space. The is required to be above for the channel and to be above for the channel. In addition, we apply a cut on a variable , which is defined as the scalar sum of the ’s of all the jets in the event plus the leading electron . We expect a higher for events than for background events. We require the to be above for the and channels, and to be above for the channel.
The background in these channels is mainly from decays, Drell-Yan, vector boson pair events and events with misidentified leptons.
Five events passed the above selection criteria for the dilepton decay channel, with estimated background events (see Table 1).
2.2 Single Lepton Decay Channels
The signature of events in the single lepton channels is a high isolated lepton, large and high jet multiplicity. We divide the single lepton channel analysis into two complementary and orthogonal analyses: an event shape analysis and a tagging analysis. The main sources of background in the single lepton channels are events with high jet multiplicity and multijet QCD events with fake leptons and due to mismeasurement.
In the event shape analysis the and events are selected by use of topological and kinematic cuts. The offline event selection requires one isolated lepton with with or and at least 4 jets with with . The requirement is 25 GeV for the + jets channel and 20 GeV for the + jets channel. The event shape analysis uses the global event variable aplanarity, , which is defined as of the smallest normalized eigenvalue of the 3-momentum tensor of the boson and jet momenta in the laboratory frame. Background events typically have smaller than signal events. Another variable used in the event shape analysis is , which is defined as the sum of the ’s of all the jets in the event. The events are expected to have a higher than +jets events. In addition we also require the total leptonic , , which is defined as the sum of the charged lepton and , to be above to reject the multijet QCD background. We require the pseudorapidity of the boson that decays leptonically to have to obtain better agreement between background control samples from data and the +jets Monte Carlo (MC) samples [3].

Figure 1 shows scatter plots of vs for DØ single lepton data, () MC events, and the two background sources: multijet background and + 4 jets vecbos [9] MC events. Based on our optimization procedure using MC events, we define the region 0.065 and as the signal region.
+ jets background events and the multijet QCD events are the main source of backgrounds in the lepton + jets channel. Since the number of + jets events is expected to decrease exponentially as a function of the jet multiplicity [10], by fitting the number of + jets events at the lower jet multiplicity and extrapolating it to high jet multiplicities, we can estimate the number of + jets background events in the data sample. We estimate the QCD background from the data itself using the measured jet misidentification probability.
Nineteen events survived all the cuts in the event shape analysis for the single lepton channel, with estimated background events (see Table 1).
In the tagging analysis, the background for the single lepton channel can be significantly reduced by requiring that one of the jets is tagged as a -jet. We tag ’s by detecting a muon in a jet. About 20% of events have a detectable in a jet compared to only about 2% of the 3jets background events. A tag muon is required to have and the distance between the muon and a jet in the - plane must be less than 0.5.
The offline event selection in the tagging analysis requires one isolated lepton with with or , , and 3 or more jets with with . Since we require a tag muon in the event, we use looser cuts on aplanarity and compared to the event shape analysis: 0.040 and . Figure 2 shows the distribution of the jet multiplicity for background events and for single lepton data before the and cuts. The data agrees with the number of events from + jets and QCD processes in the low jet multiplicity region. For the high multiplicity bin we can see a clear excess above background even without the and cuts.

The main background in the tagging analysis is also +jets production. The background is estimated by applying the muon tag rate, which is determined by the fraction of jets tagged in multijet events, to the jets in the background sample after all other cuts described above are applied.
Eleven events passed the above selection criteria in the tagging analysis of the single lepton channel, with estimated background events (see Table 1).
2.3 Decay Channel
In order to identify events in which neutrinos from both decays carry much of the transverse momentum, we perform an decay channel analysis. This analysis is mainly focused on selecting those events that fail the event selection criteria for the , and +jets decay channels. The signature of the events in the decay channel is one high isolated electron, two or more jets and very large which together with the electron, forms a transverse mass much higher than the mass.
The event selection requires events with an isolated electron with with and at least two jets with with . We require that the is above and the transverse mass of the and the electron is above . The dominant background in this channel is +jets production, pair production and a misidentified electron with in QCD multijet events.
Four events survived the selection criteria for the decay channel, with estimated bachground events (see Table 1).
2.4 All-jets Decay Channel
The decay of the top quark through the multi-jets channel represents the dominant decay mode in the standard model (44%). But, without the signature of an isolated lepton in the event, the QCD multi-jets background overwhelms the signal by roughly 1:2000 before any other cuts are applied. This has made the search for top in this channel very challenging. Significant gains in this channel have been made by employing multivariate techniques and a number of novel techniques which are optimized for this search. The current analysis [4] includes the full Run 1 data set.
Artificial neural networks constitute a powerful nonlinear extension of conventional methods of multi-dimensional data analysis [11]. They have been proven extremely well suited to the multi-jets search because they handle information from a large number of inputs and properly account for the nonlinear correlations between these inputs. We note that the output of the neural net is simply a mapping between the multi-dimensional space of variables describing our events and a one-dimensional output space. The analysis may proceed by setting a threshold on the neural net output, corresponding to a cut surface in multi-dimensional space.
This analysis relies on a set of simple topological variables which discriminate between the fundamental properties of the signal and the QCD background. For the background, these properties are:
-
•
The events have a lower overall energy scale; leading jets have lower ; multi-jet invariant masses are small.
-
•
The additional radiated jets are soft (have low ).
-
•
The event topology is more planar (less spherical than top).
-
•
The jets are more forward-backward in rapidity (less central than top).
We employ 10 kinematic parameters which embody these properties. In addition to the kinematic parameters, we use three other parameters based on jet widths, of the tagging muon and the mass likelihood. This set of 13 variables was used as the set of inputs to the neural net. We used the back-propagation learning algorithm in Jetnet [12] to train the network and provide a single variable NN (the neural network output in the range (0,1)).
At the simplest level, each decays into a and boson, and the bosons into light quarks. Barring extra gluon bremsstrahlung, this represents six quark-jets in the final state. The average jet multiplicity for Herwig events (=180 GeV/c2) is 6.9, implying that the contribution from gluons is relatively small. Conversely, the QCD multi-jet background has final-state jets that originate predominantly from underlying gluon radiation. Although gluon splitting can take place, producing both quark and gluon jets, it is expected that there will be a large enhancement in gluon content for QCD jet production. A Fisher discriminant, based on the difference between quark and gluon jet widths is used to differentiate between signal and QCD background.
The of the tagging muon helps to further differentiate between signal and QCD background. Not only does the fragmentation of quarks produce higher objects, but the itself is more boosted in top events than in background. Thus, the muon spectrum is significantly harder in events. The muon serves as a useful tool in differentiating between signal and background.
A mass log-likelihood variable provides discrimination between signal and background by requiring that there are combinations of jets consistent with being from two top decays and the subsequent . The presence of two ’s in events provides significant rejection against QCD background. A further requirement that the two reconstructed top quarks have equivalent masses provides additional discrimination.
The background NN distribution is based upon data events, selected by identical criteria as the signal sample except that a tagging muon is not required. To these events, a muon is added with probability and kinematic distributions as observed in our data. The NN distributions are taken from the Herwig MC, and checked with Isajet.
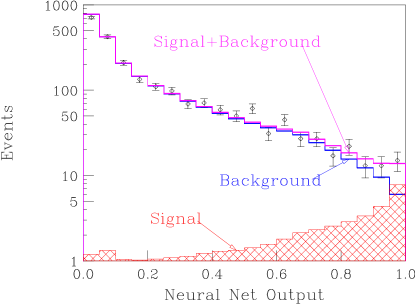
Once the final neural net has been trained, the relative amount of signal and background in the data may be determined by a fit for the amounts for signal and background. Because the shapes of the expected signal and background distributions in neural net output differ significantly, the relative amounts of each may be disentangled. This serves as a useful check of the overall tag rate function and simultaneously provides the top cross section. This technique benefits from the fact that additional information on the top cross section is extracted even in regions where the background level is large. The data (diamonds), and the expected distribution for background and for signal are shown in Fig. 3 along with the combined fit. The result is, = 7.1 2.8 1.5 pb at mt = 172.1 GeV/c2, in good agreement with the DØ result for the leptonic channels [3]. Applying a cut on the neural net output of 0.85 (events shown in Table 1), and using the absolute background predicted, yields a consistent cross section. Additionally, a more restrictive cut on the neural net output of 0.94, chosen for maximum expected significance using Monte Carlo data, leaves 18 events with an expected background of 6.9 0.9. The probability of an upward fluctuation of the background to the observed signal is equivalent to 3.2 standard deviations.
2.5 Production Cross Section
| channel | events | estimated | expected signal |
|---|---|---|---|
| observed | background | =170 GeV/c2 | |
| 1 | 0.50.1 | 1.20.2 | |
| 3 | 0.20.2 | 2.20.5 | |
| 1 | 0.70.3 | 0.60.1 | |
| +jets(event shape) | 9 | 4.50.9 | 8.61.6 |
| +jets(event shape) | 10 | 4.21.0 | 5.51.7 |
| +jets(-tag) | 5 | 1.10.4 | 3.60.6 |
| +jets(-tag) | 6 | 1.40.2 | 2.30.5 |
| 4 | 1.20.4 | 1.70.5 | |
| total (leptonic channels) | 39 | 13.72.2 | 25.74.6 |
| all-jets | 41 | 24.82.4 | 15.92.6 |
Table 1 shows the number of observed events for all nine decay channels, the estimated number of background events, and the expected number of events for ( production cross sections using ref. [13]).
The top production cross section in the leptonic channels is calculated using the formula where is the number of observed events, is the expected background, is the detection efficiency for top, is the branching ratio and is integrated luminosity for channel , where =1,…,8. This cross section is then combined with the aforementioned cross section measured in the all-jets decay channel taking into account appropriate correlations.
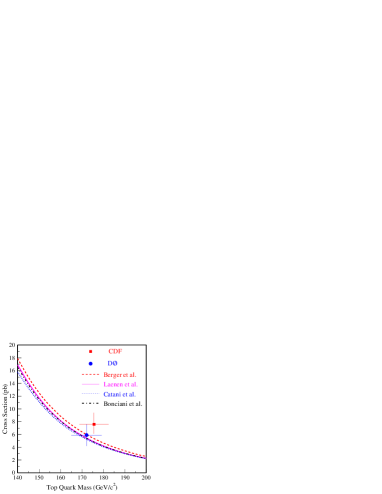
Figure 4 shows the DØ cross section as a function of top quark mass compared with theoretical predictions. We measure the production cross section to be pb at our measured top quark mass of GeV/c2 (see section 3) in good agreement with the standard model predictions [13, 14, 15, 16].
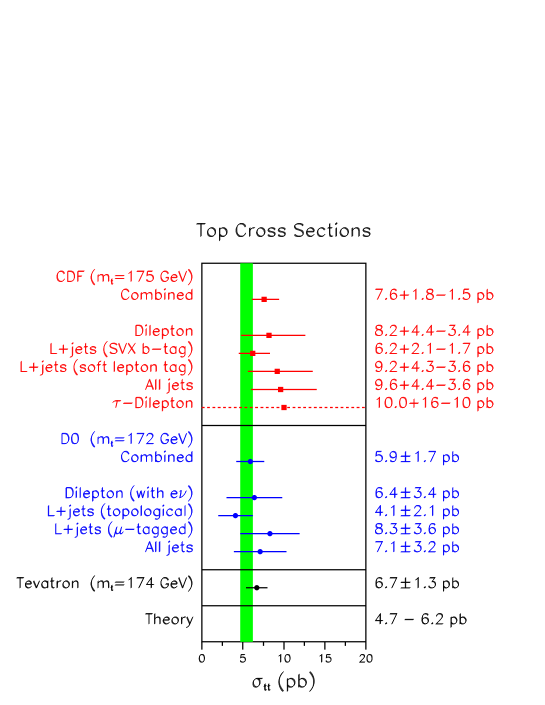
Combining the DØ and the CDF [17] measured cross sections taking into account correlations between systematic errors yields unofficially pb at an averaged top quark mass of GeV/c2. Figure 5 shows the DØ and the CDF measured cross sections as well as the unofficial Tevatron average and a theoretical band which contains the four calculations.
3 Measurement of the Top Quark Mass
Direct measurements of the top quark mass using single lepton and dilepton events are reported here.
3.1 Single Lepton Events
3.1.1 Event Selection
The initial event selection for the top quark mass measurement analysis is similar to that used in the cross section analysis for the single lepton channel, but without and cuts. We require one isolated lepton, or , with GeV and or . We also require GeV for + jets and 20 GeV for + jets. Only the events with four or more jets having GeV with are used. To suppress background in untagged events, we require GeV and for the .
Ninety events passed the event selection requirements. Among these, seven events are -tagged events.
3.1.2 Fitting Algorithm
For each event passing the above selection cuts, we make a two constraint kinematic fit [18] to the hypothesis by minimizing a , where is the vector of the measured (fit) variables and is its error matrix [5]. Both reconstructed masses are constrained to equal the mass and we assume both and quarks have the same fit mass, . Kinematic fits were performed on all permutations of the jet assignments of the four highest jets, with the provision that muon-tagged jets were always assigned to a -quark in the fit. Each fit yields a fitted mass value, and a . The fit with the lowest is chosen to describe the event. Only the events with are used in the top quark mass determination. 77 events passed the cut and among them five events are -tagged events. Although is strongly correlated with the top quark mass, , is not the same as , because of gluon radiation and permutation ambiguities.
3.1.3 Mass and Error Determination
To further separate the signal and background events we use variables that can provide good separation between and background events without much correlation to the fitted mass. The following four variables are chosen to compute the top quark likelihood discriminant ():
-
•
.
-
•
.
-
•
, where is the without the of the leading jet.
-
•
min, where is the minimum between all pairs of the jets and is the smaller jet from the minimum pair.
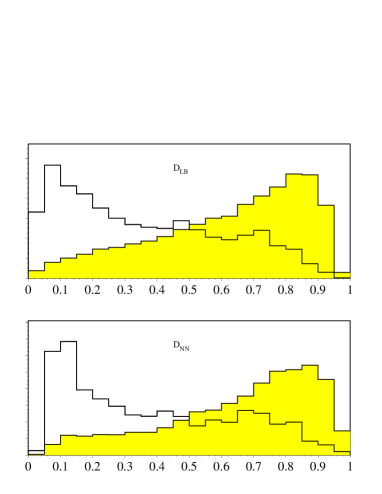
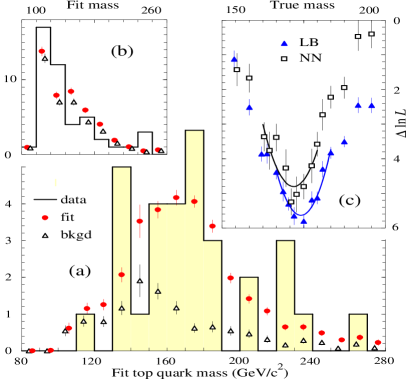
DØ uses two discriminants [5]. One is the (low bias) method, in which we parametrize , where and are the top signal and background densities in each variable, integrating over the others. We then form the log likelihood , where the weights are adjusted slightly away from unity to nullify the average correlation (“bias”) of with . For each event we set . The data are then divided into two bins: a low signal-to-noise bin and a high signal-to-noise bin, according to whether the LB cut is passed. The LB cut is passed if either and GeV, or if a tag exists in the event. Another method uses a neural network [19] with the same four variables as input, five hidden nodes, and one node with output . We divide the data into ten bins in . Figure 6 shows the distribution of the discriminants and for signal and background. They indicate that either discriminant provides good discrimination.
Since the selected event sample contains both and background events, we make a two dimensional likelihood fit of the event sample to the sum of the expected signal plus background in the vs. plane. We make an independent likelihood fit for each top quark mass hypothesis. We use the herwig [20] MC to simulate events. We estimate background using a combination of +jets events from the vecbos [9] MC and fake lepton events obtained directly from DØ data.
Figures 7 (a) and (b) show the distributions of for data (a) passing and (b) failing the LB cut. The histograms are data, the dots are the predicted mixture of signal plus background, and triangles are background. Figure 7 (c) shows the log of the fit likelihood vs. true top quark mass for both the LB and NN fits. The curves are quadratic fits to the lowest point and its 8 nearest neighbor points. The minimum position of each curve yields the measured top quark mass. The width of the curve at 0.5 above the minimum determines the statistical error of the measurement. The LB fit yields GeV/c2. The NN fit yields GeV/c2.
There are several sources of systematic error [5, 6]. The major uncertainties are from the jet energy scale and the MC modelling. We assign a jet energy scale error of (2.5% + 0.5 GeV) based on a detailed study of +jet events in data and MC, particularly focused on the dependence of the balance upon of the jet, and checked by the balance in +jet events. This leads to an error on of 4.0 GeV/c2. The uncertainties in the MC modeling of top and +jet production are estimated to have a systematic error on the top mass of 3.1 GeV/c2. Other effects, including calorimeter noise, multiple interactions, and differences in fits to , contribute 2.2 GeV/c2. All systematic errors sum in quadrature to 5.5 GeV/c2.
Combining from both methods, LB and NN, we determine the top quark mass to be GeV/c2 or GeV/c2, allowing for the ()% correlation between two methods.
3.2 Dilepton Events
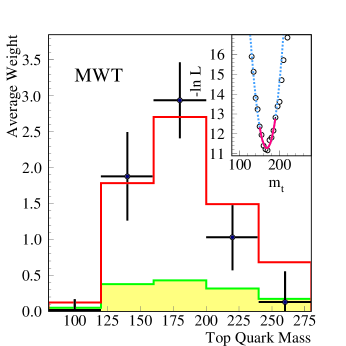
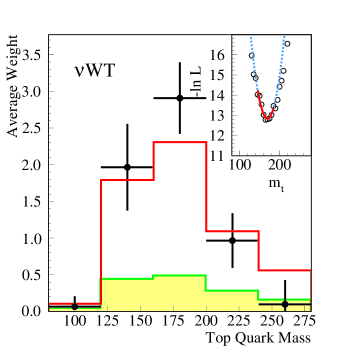
Due to the presence of two neutrinos, dilepton events do not contain enough information for a constrained fit. Therefore, we resort to using mass estimators other than the reconstructed mass. The same technique that was used for the lepton plus jets mass analyses is used to calculate a top quark mass likelihood in the dilepton mass analysis. DØ supplies the missing constraint in the problem by assuming a top quark mass and reconstructing the event for every assumed mass [7]. Based on the reconstructed final state a weight is computed which characterizes the probablity for this event to be from a decay with the assumed mass. There are two algorithms used to determine the weight. The matrix element weighting (MWT) method uses the proton structure functions and the probability density function for the energy of the decay lepton in the rest frame of the top quark (an extension of Ref. [22]). The neutrino weighting method (WT) assigns the weight based on the available phase space for the neutrinos, consistent with the measured . A maximum likelihood fit is performed to the shape of the normalized weight curve summed over all 6 dilepton mass events using MC derived probability density functions for signal and background (see Fig. 8). The results for the two analyses are in excellent agreement : (MWT) and (WT) with a systematic error of 3.7. By combining the two results, taking into account the correlations (77%), we determine the top quark mass in the dilepton channels to be or .
DØ has also combined its dilepton and lepton+jets mass measurements into a single top quark mass measurement of or .
3.3 Combined Top Quark Mass
4 Charged Higgs Search
4.1 Introduction and Strategy
The “minimal” Higgs sector of the Standard Model (SM) is comprised of only one complex Higgs doublet, which manifests itself in a single physical neutral Higgs scalar ( is a free parameter of the SM). However, the scalar sector of the SM is not yet constrained by experiment, and it is possible that the Higgs content is richer and its structure more complicated. A strong motivation for extending the Higgs sector comes from supersymmetry, where two Higgs doublets are needed to provide masses to the charged fermions. Two-higgs doublets appear in many theories, both in the context of the SM and extended models such as the superstring-inspired model. Charged Higgs bosons appear in these as well as in several more general theories [23].
The minimal extension to the Higgs sector has two complex (isospin ) Higgs doublets with opposite hypercharge [24]. In the Minimal Supersymmetric Model (MSSM) there are three parameters: the mass of the boson (), the ratio of the two neutral Higgs VEVs ( ), and the mass of the charged scalar (). If kinematically allowed, BR( ) can be comparable to, or even larger than, BR( ) depending on and . At the Tevatron one can therefore search for a light charged Higgs boson in the decay of top quarks.
There is a direct lower limit from LEP experiments corresponding to GeV at 95% CL [25]. Based on their direct and indirect searches, the CDF experiment has recently excluded additional regions in the [,] plane [26]. Also, an independent analysis of CDF data led to similar conclusions for high [27]. Our analysis is based on a somewhat different strategy and is sensitive to similar but not identical regions of the parameter space.
The value of the production cross section and the mass of the top quark from direct observation at DØ [3, 5] are based on the assumption of BR() = 1. The topic of present interest is based on the violation of this assumption. We therefore cannot use those measurements in this analysis. Consequently, in the process of setting limits in the [, ] plane, and serve as input parameters. Production of takes place via strong interactions, and the cross section is not affected by the existence of a charged Higgs boson lighter than the top quark. One can therefore use a theoretical prediction based purely on the SM for . There is also no rigorous reason to use the directly measured value of when considering a region where , but in the absence of a compelling reason to start elsewhere, one can choose in the 170 - 175 GeV range as a starting point. In our analysis we have considered so far charged Higgs predominantly decaying into the heaviest quarks or leptons, i.e. or , (and the charged conjugate decays). The branching ratios for these decays depend on . Neglecting other decays into and , BR()+BR()=1.
The selection criteria of the DØ standard measurement of were optimized for . In the end, the number of observed events in excess of the estimated backgrounds is interpreted as arising entirely from , and was calculated assuming . In our indirect search, we replace this last assumption with a more general one: . We then appply the same selection criteria to our simulated signal and determine, for given values of , and , what values of are unlikely to produce the number of events observed in our data sample (). With selection criteria tuned for high acceptance to events, the value of is statistically significant, and in excellent agreement with the predicted for (i.e., ). Therefore, regions of parameter space that imply a high can be excluded if the acceptance (using our normal selection criteria) for is small, because it is not possible to explain the large value of in these regions. This is the strategy of our “disappearance” analysis.
For the time being, we limit ourselves to the lepton+jets final states, which accounts for 30 of the 39 candidate events on which the current DØ standard measurement of is based. One very appealing feature of the indirect search is that the selection criteria are already tuned and the non-top backgrounds, as well as the systematic uncertainties, have been thoroughly studied and are well understood through the previous analysis. For an indirect search, one generates the charged Higgs signal using Monte Carlo, and studies its acceptance for the standard event selection criteria. Events are generated for one channel at a time for any given . Subsequently, a sample for a particular value of can be obtained by adding events from different channels in a proportion appropriate for that [, ]. A single set of selection criteria is applied to all samples, each of which correspond to a unique [, ].
4.2 Results and Discussion
For a given set of the three parameters (, , ), we determine the probability distribution of . There is no generally applicable strict upper or lower limit on . However, validity of the perturbation theory implies upper bounds on the value of the charged Higgs–fermion Yukawa couplings. Requirements on the couplings yield an approximate region of phenomenological interest of [32]. These limits are sensitive to .
We compute minimum and maximum (one-sided) limits on at 95% confidence level. Since represents a physical parameter, it must have some discrete value and not a continuous distribution. It is therefore appropriate to provide minimum and maximum values for separately. For a given set of [,], the maximum allowed values of can be plotted as a function of , and, similarly, the minimum allowed values can be plotted. These form the boundaries of the regions in the [, ] plane that are excluded at 95% CL.
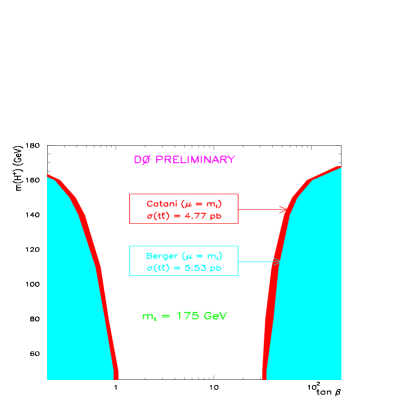
The lightly shaded region in Fig. 10 represents the region of [, ] excluded for = 175 GeV and pb. The cross section of 5.5 pb is the one calculated by Berger et al., for = 175 GeV, using for the renormalization scale [14]. The reason for choosing this particular cross section is that it is the largest among the theoretical predictions at this , and therefore, for a given number of observed events, the most conservative in terms of setting exclusion limits on the existence of a charged Higgs. The darkly shaded region demarcates the additional excluded regions if one chooses the cross section calculated by Catani et al., ( pb), for the same renormalization scale [15].
For = 170 GeV we have pb (Berger et al., ). According to this cross section, given our lepton+jets signal and background acceptances, we are most likely to have seen 33 or 34 events if . This means that favors a non-zero contribution from channels in which at least one of the pair-produced tops decays into a charged Higgs. Since the acceptance of the selection criteria for such channels is smaller than that for , the larger the assumed production cross section, the greater the need for a contribution from a charged Higgs to explain the observed deficit. A cross section smaller than that found in the standard analysis would yield a likelihood distribution with a single peak at , where has a maximum. As the assumed production cross section is reduced, the likelihood distribution becomes narrower (and the area under the curve decreases), which results in a larger region of excluded on either side of the peak value. Like , the value of also affects the derived range of excluded [,].
It is important to note that these results are still preliminary. Two aspects of the analysis are being worked on and will probably change the results. The first one is taking into account another decay channel, , which becomes important at once one considers GeV or so. Incorporating this additional mode is expected to somewhat weaken the lower limit on at large values of . The second issue which needs further studies is the effect of increased widths of top and near the upper and lower boundaries of the range of under consideration.
5 Future Prospects - Run 2
The next Tevatron collider run (Run 2) is scheduled to begin in the year 2000 with increased luminosity and energy. DØ will increase its integrated luminosity compared to that accumulated during Run 1 by about a factor of 20 (to 2 fb-1). Combined with the increased Tevatron c.m. energy (from 1.8 to 2.0 TeV) which will yield a 35% increase in the production cross section and with detector improvements, the number of observed top quark events will increase by about a factor of 40. Details of the expected precision for top related measurements during Run 2, including some which were not done in Run 1 due to the small statistics, are described in refs [35, 36].
6 Conclusions
DØ has made direct measurements of the top quark mass from single lepton and from dilepton events using the entire data sample from the 1992-1996 running period with an integrated luminosity of 125 pb-1. The top quark mass is determined to be GeV/c2. DØ has also measured the production cross section. Thirty nine events were observed in eight different leptonic decay channels with an estimated background of events. In the all-jets mode 41 events were observed with an estimated background of 24.82.4 events. The production cross section is measured to be pb at GeV/c2.
7 Acknowledgments
I would like to express my appreciation to the organizers of this excellent conference for their hospitality. We acknowledge the support of the US Department of Energy and the collaborating institutions and their funding agencies in this work.
References
- [1] DØ Collaboration, S. Abachi et al., Phys. Rev. Lett. 74, 2632 (1995).
- [2] CDF Collaboration, F. Abe et al., Phys. Rev. Lett. 74, 2626 (1995).
- [3] DØ Collaboration, B. Abbott et al., Phys. Rev. Lett. 79, 1203 (1997).
- [4] DØ Collaboration, B. Abbott et al., FERMILAB-PUB-98/130-E (Submitted to Phys. Rev. D).
- [5] DØ Collaboration, B. Abbott et al., Phys. Rev. Lett. 79, 1197 (1997).
- [6] DØ Collaboration, B. Abbott et al., FERMILAB-PUB-98/031-E, hep-ex/9801025 (Submitted to Phys. Rev. D).
- [7] DØ Collaboration, B. Abbott et al., Phys. Rev. Lett. 80, 2063 (1998).
- [8] DØ Collaboration, S. Abachi et al., Phys. Rev. D52, 4877 (1995).
- [9] F.A. Berends et al., Nucl. Phys. B 357, 32 (1991), release 3.0.
- [10] F. A. Berends, H. Kuijf, B. Tausk, and W. T. Giele, Nucl. Phys. B357, 32 (1991).
-
[11]
R. Beale and T. Jackson, Neural Computing: An
Introduction, Adam Hilger, New York, (1991).
J. Hertz, A. Krogh, and R. G. Palmer, Introduction to the Theory of Neural Computation, Addison-Wesley, (1990). - [12] C. Peterson and T. Rögnvaldsson, JETNET 3.0 - A Versatile Artifical Neural Network Package, CERN-TH.7135/94 (1994).
- [13] E.Laenen et al., Phys. Rev. Lett. 321B, 254 (1994).
- [14] E. L. Berger and H. Contopanagos, Phys.Rev. D54 3085 (1996).
- [15] S. Catani, M. L. Mangano, P. Nason, and L. Trentadue, Phys. Lett. B378 329 (1996).
- [16] R. Bonciani, S. Catani, M.L.Mangano and P.Nason, hep-ph/9801375.
- [17] G. Velev, these proceedings.
- [18] S. Snyder, Ph.D. thesis, State Univ. of New York, Stony Brook, 1995 (unpublished),
- [19] E.K. Blum and L.K. Li, Neural Networks 4, 511 (1991).
- [20] G. Marchesini et al., Comput. Phys. Commun. 67, 465 (1992), release 5.7.
- [21] F. Paige and S. Protopopescu, BNL Report BNL38034, 1986 (unpublished), release 7.21.
- [22] R.H. Dalitz and G.R Goldstein, Phys. Rev. D45, 1531 (1992), OUTP-92-07P; K. Kondo, Journal of the Physical Society of Japan 57, 4126 (1988) and 60, 836 (1991).
- [23] J. F. Gunion, H. E. Haber, G. Kane, and S. Dawson, “The Higgs Hunter’s Guide” (Addison-Wesley, 1990).
- [24] M. Drees and D. P. Roy, CERN-TH.6080/91 (1991).
- [25] V. Ruhlmann, “Higgs searches at LEP”, proceedings of Rencontres de Moriond on “QCD and High Energy Hadronic Interactions”, Les Arcs, France, Mar. 21-28, 1998.
- [26] CDF collaboration, F. Abe et al., Phys. Rev. Lett. 79, 357 (1997).
- [27] M. Guchait and D. P. Roy, Phys. Rev. D 55, 7263 (1997).
- [28] CDF collaboration, F. Abe et al., Phys. Rev. Lett. 80, 2773 (1998).
- [29] CDF collaboration, F. Abe et al., Phys. Rev. Lett. 80, 2767 (1998).
- [30] V. D. Barger and R. J. N. Phillips, “Collider Physics” p 281 (Addison-Wesley, 1988).
- [31] F. Paige and S. Protopopesscu, BNL Report BNL38034, 1986 (unpublished), release V7.21.
- [32] V. Barger, J. L. Hewett, and R. J. N. Phillips, Phys. Rev. D 41, 3421 (1990); A. Buras, P. Krawczyk, M. E. Lautenbacher, and C. Salazer, Nucl. Phys. B337 284 (1990); J. F. Gunion and B. Grzadkowski, Phys. Lett. B 243 301 (1990).
- [33] P. R. Bevington and D. K. Robinson “Data Reduction and Error Analysis for the Physical Sciences”, 2nd ed. p 233 (McGraw-Hill, 1992).
- [34] F. James, “The statistics of very small samples - Bayesian and classical approaches”, CERN Lecture Series, Dec 15-17, 1986, DØ internal note 1686 (unpublished).
- [35] “Future Electroweak Physics at the Fermilab Tevatron”, Report of the TeV2000 Study Group, D. Amidei and R. Brock, editors, Fermilab-PUB-96/082.
- [36] K. Del Signore, “The Physics program for Tevatron Run II and TeV33”, proceedings of Rencontres de Moriond on “QCD and High Energy Hadronic Interactions”, Les Arcs, France, Mar. 21-28, 1998.