CLNS 98/1551 CLEO 98-6 A limit on the mass of the
Abstract
A limit
on the mass of the tau neutrino is derived from
tau pairs produced in an integrated luminosity of
5.0 of
reactions at center of mass energies 10.6 GeV.
The measurement technique involves a two-dimensional extended likelihood
analysis, including the dependence of the end-point population
on , and allows for the first time an explicit
background contribution. We use the
the decays and
to obtain an upper limit of 30 MeV/ at C.L.
PACS: 14.60Lm, 12.15Ff, 13.35Dx
Keywords: Tau Neutrino Mass
R. Ammar,1 P. Baringer,1 A. Bean,1 D. Besson,1 D. Coppage,1 C. Darling,1 R. Davis,1 S. Kotov,1 I. Kravchenko,1 N. Kwak,1 L. Zhou,1 S. Anderson,2 Y. Kubota,2 S. J. Lee,2 J. J. O’Neill,2 R. Poling,2 T. Riehle,2 A. Smith,2 M. S. Alam,3 S. B. Athar,3 Z. Ling,3 A. H. Mahmood,3 S. Timm,3 F. Wappler,3 A. Anastassov,4 J. E. Duboscq,4 D. Fujino,4,***Permanent address: Lawrence Livermore National Laboratory, Livermore, CA 94551. K. K. Gan,4 T. Hart,4 K. Honscheid,4 H. Kagan,4 R. Kass,4 J. Lee,4 H. Schwarthoff,4 M. B. Spencer,4 M. Sung,4 A. Undrus,4,†††Permanent address: BINP, RU-630090 Novosibirsk, Russia. A. Wolf,4 M. M. Zoeller,4 S. J. Richichi,5 H. Severini,5 P. Skubic,5 M. Bishai,6 J. Fast,6 J. W. Hinson,6 N. Menon,6 D. H. Miller,6 E. I. Shibata,6 I. P. J. Shipsey,6 M. Yurko,6 S. Glenn,7 Y. Kwon,7,‡‡‡Permanent address: Yonsei University, Seoul 120-749, Korea. A.L. Lyon,7 S. Roberts,7 E. H. Thorndike,7 C. P. Jessop,8 K. Lingel,8 H. Marsiske,8 M. L. Perl,8 V. Savinov,8 D. Ugolini,8 X. Zhou,8 T. E. Coan,9 V. Fadeyev,9 I. Korolkov,9 Y. Maravin,9 I. Narsky,9 V. Shelkov,9 J. Staeck,9 R. Stroynowski,9 I. Volobouev,9 J. Ye,9 M. Artuso,10 F. Azfar,10 A. Efimov,10 M. Goldberg,10 D. He,10 S. Kopp,10 G. C. Moneti,10 R. Mountain,10 S. Schuh,10 T. Skwarnicki,10 S. Stone,10 G. Viehhauser,10 J.C. Wang,10 X. Xing,10 J. Bartelt,11 S. E. Csorna,11 V. Jain,11,§§§Permanent address: Brookhaven National Laboratory, Upton, NY 11973. K. W. McLean,11 S. Marka,11 R. Godang,12 K. Kinoshita,12 I. C. Lai,12 P. Pomianowski,12 S. Schrenk,12 G. Bonvicini,13 D. Cinabro,13 R. Greene,13 L. P. Perera,13 G. J. Zhou,13 M. Chadha,14 S. Chan,14 G. Eigen,14 J. S. Miller,14 M. Schmidtler,14 J. Urheim,14 A. J. Weinstein,14 F. Würthwein,14 D. W. Bliss,15 D. E. Jaffe,15 G. Masek,15 H. P. Paar,15 S. Prell,15 V. Sharma,15 D. M. Asner,16 J. Gronberg,16 T. S. Hill,16 D. J. Lange,16 R. J. Morrison,16 H. N. Nelson,16 T. K. Nelson,16 D. Roberts,16 B. H. Behrens,17 W. T. Ford,17 A. Gritsan,17 J. Roy,17 J. G. Smith,17 J. P. Alexander,18 R. Baker,18 C. Bebek,18 B. E. Berger,18 K. Berkelman,18 K. Bloom,18 V. Boisvert,18 D. G. Cassel,18 D. S. Crowcroft,18 M. Dickson,18 S. von Dombrowski,18 P. S. Drell,18 K. M. Ecklund,18 R. Ehrlich,18 A. D. Foland,18 P. Gaidarev,18 L. Gibbons,18 B. Gittelman,18 S. W. Gray,18 D. L. Hartill,18 B. K. Heltsley,18 P. I. Hopman,18 J. Kandaswamy,18 D. L. Kreinick,18 T. Lee,18 Y. Liu,18 N. B. Mistry,18 C. R. Ng,18 E. Nordberg,18 M. Ogg,18,¶¶¶Permanent address: University of Texas, Austin TX 78712. J. R. Patterson,18 D. Peterson,18 D. Riley,18 A. Soffer,18 B. Valant-Spaight,18 C. Ward,18 M. Athanas,19 P. Avery,19 C. D. Jones,19 M. Lohner,19 S. Patton,19 C. Prescott,19 J. Yelton,19 J. Zheng,19 G. Brandenburg,20 R. A. Briere,20 A. Ershov,20 Y. S. Gao,20 D. Y.-J. Kim,20 R. Wilson,20 H. Yamamoto,20 T. E. Browder,21 Y. Li,21 J. L. Rodriguez,21 T. Bergfeld,22 B. I. Eisenstein,22 J. Ernst,22 G. E. Gladding,22 G. D. Gollin,22 R. M. Hans,22 E. Johnson,22 I. Karliner,22 M. A. Marsh,22 M. Palmer,22 M. Selen,22 J. J. Thaler,22 K. W. Edwards,23 A. Bellerive,24 R. Janicek,24 D. B. MacFarlane,24 P. M. Patel,24 and A. J. Sadoff25
1University of Kansas, Lawrence, Kansas 66045
2University of Minnesota, Minneapolis, Minnesota 55455
3State University of New York at Albany, Albany, New York 12222
4Ohio State University, Columbus, Ohio 43210
5University of Oklahoma, Norman, Oklahoma 73019
6Purdue University, West Lafayette, Indiana 47907
7University of Rochester, Rochester, New York 14627
8Stanford Linear Accelerator Center, Stanford University, Stanford, California 94309
9Southern Methodist University, Dallas, Texas 75275
10Syracuse University, Syracuse, New York 13244
11Vanderbilt University, Nashville, Tennessee 37235
12Virginia Polytechnic Institute and State University, Blacksburg, Virginia 24061
13Wayne State University, Detroit, Michigan 48202
14California Institute of Technology, Pasadena, California 91125
15University of California, San Diego, La Jolla, California 92093
16University of California, Santa Barbara, California 93106
17University of Colorado, Boulder, Colorado 80309-0390
18Cornell University, Ithaca, New York 14853
19University of Florida, Gainesville, Florida 32611
20Harvard University, Cambridge, Massachusetts 02138
21University of Hawaii at Manoa, Honolulu, Hawaii 96822
22University of Illinois, Urbana-Champaign, Illinois 61801
23Carleton University, Ottawa, Ontario, Canada K1S 5B6
and the Institute of Particle Physics, Canada
24McGill University, Montréal, Québec, Canada H3A 2T8
and the Institute of Particle Physics, Canada
25Ithaca College, Ithaca, New York 14850
Although the tau neutrino has never been directly observed, the question of its mass is an important issue in particle physics and cosmology. While the requirement that the density of primordial relic neutrinos from the Big Bang not over-close the Universe restricts the mass of a stable neutrino to be less than 100 eV/ [1, 2, 3], unstable neutrinos are less restricted. Big Bang nucleosynthesis models allow for a massive neutrino in the 10 to 31 MeV/ range for lifetimes in the 0.01 to 40 second interval [4]∥∥∥ Recently [5] it has been pointed out that these arguments do depend upon which set of astrophysical observations are used.. This astrophysically allowed range currently overlaps the experimentally accessible bounds. The most stringent accelerator-based limits on are derived from one-dimensional mass fits and two-dimensional energy versus mass fits of the hadrons in tau decays. The sensitivity of the method is largest when the invariant hadronic mass is large, and there is little phase space for the (unseen) neutrino such as in the decays modes and . In addition, due to its large branching ratio, the decay can be used in spite of its lower inherent sensitivity per event resulting from its low average hadronic decay product mass.
The lowest published upper limit******All neutrino mass upper limits quoted herein are at the 95 confidence level., by the ALEPH collaboration [6], is 24 MeV/ and is obtained with a two-dimensional likelihood fit to a region near the endpoint of 25 candidate events. By doubling this dataset and adding in decay candidates, the ALEPH collaboration [7] has recently reported an upper limit of 18.2 MeV/. The DELPHI collaboration [8] has claimed a limit of 33 MeV/ in the mode from a mass fit, but notes that this limit is sensitive to the contribution of a possible higher mass resonance in the mass distribution. DELPHI estimates that the model dependence in the mode decreases the limit to 62 MeV/. The OPAL collaboration [9] quotes a 35.3 MeV/ limit from a two-dimensional fit to the missing momentum and missing mass in decays using the event thrust axis as an estimator of the tau direction. Combining this with an earlier limit of 74 MeV/ from decays [10], a 29.9 MeV/ limit is obtained. ARGUS [11, 12] has published a 31 MeV/ limit based on a one-dimensional mass fit to 20 events. The previous CLEO limit [13] of 32.6 MeV/ was set with a fit to the mass spectrum of 60 events, and 53 events.
The current analysis uses data collected with the CLEO II detector [14] at the Cornell storage ring (CESR) at center of mass energies near 10.6 GeV. The data set consists of 5.0 of integrated luminosity corresponding to 4.5 million produced tau pairs. The tau’s, created mainly via , have the full beam energy of 5.29 GeV and recoil back to back, modulo initial state radiation effects. The decay modes studied are and recoiling against a leptonically-decaying tau (the “tag”). An upper limit on is obtained from a two-dimensional likelihood fit to hadronic mass and energy in these decays. The likelihood includes for the first time a background contribution, as well as a factor describing the expected number of events as a function of neutrino mass, and measured event errors for hadronic mass and energy.
In order to avoid a spuriously low limit from a background event, the event selection criteria are chosen to obtain a very pure event sample of or , and roughly follow those of our last publication [13]. A clean sample of tau’s is obtained by selecting events in which the tag decays leptonically: or . We thus require the event to contain an isolated lepton ( or ) in the barrel () recoiling against 5 or 3 charged tracks, with event hemispheres defined by the event thrust axis. Exactly 6 or 4 charged tracks consistent with production at the nominal interaction point are required, after pairs of tracks consistent with photon conversions and Dalitz or decays are rejected. Backgrounds from two photon events are minimized by requiring that the total missing momentum point away from the beamline, and that the total energy transverse to the beam axis be above 200 MeV. To supress hadronic events, the total visible energy is required to be below 90% of the total center of mass energy. All hadronic tracks must also have a specific ionization () consistent with that of a pion. We correct for energy loss when computing energies and invariant masses.
Isolated showers in the calorimeter with photon-like lateral shower profiles are identified as photons. In the barrel, photon candidates must have an energy above 60 MeV, while in the range , they must have an energy above 100 MeV. Exactly 0 or 2 neutral pions must be reconstructed on the signal side, with none on the tag side. These candidates must have an opening angle of less than and a mass constrained fit of the candidates must have a confidence level greater than 5%. If the photon candidates can be combined into s in multiple ways, we select the combination with the smallest total for the mass hypothesis. We permit calorimeter showers that are unassociated with charged tracks or s to remain. The summed energy of all showers within of the lepton direction must be less than 100 MeV in each of the barrel and endcap region of the calorimeter. For the signal hemisphere, the energy requirement is increased to 200 MeV.
The selection criteria above were designed to minimize backgrounds, which arise primarily from non-tau decays such as or or from feedthrough from other tau decay modes. A data sample which satisfies the above selection criteria on the signal side of the event, but with an invariant mass above the tau mass on the tag side, is used as an estimator of non-tau backgrounds. The background estimate is obtained by scaling the number of these estimator events above the tau mass on the signal side to the number of data events above the tau mass on the signal side minus the Monte Carlo predicted number of taus misreconstructed above the tau mass. The background estimates obtained in this way are consistent with those obtained by using Lund [15] generated Monte Carlo events. Monte Carlo events with full detector simulation [16] based on the event generators KORALB [17] and PHOTOS [18] were used to estimate tau decay backgrounds in the signal hemisphere (feed-across).
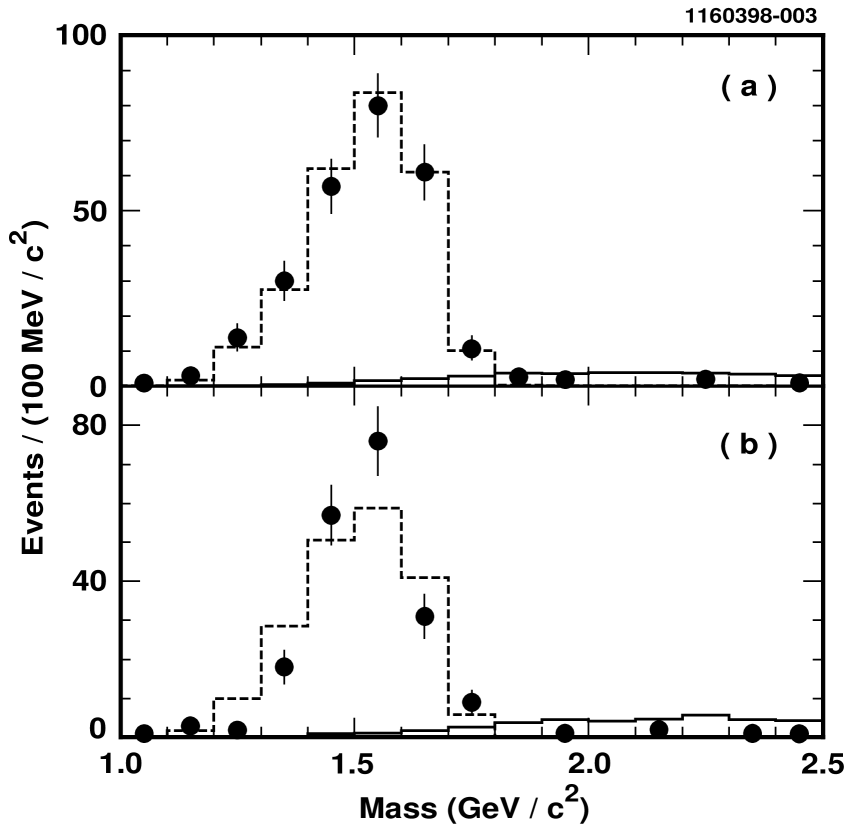
The resulting event distributions, shown in Fig. 1, contain 266 events in the final state, of which 8 are above the tau mass. The mode contains 207 events, of which 13 are above the tau mass. Monte Carlo simulations show a reconstruction efficiency of for the mode and for the mode. In both modes the number of events observed is consistent with the expectation from the world average branching fractions [19].
Each signal event is represented by a point in the two-dimensional plane formed by the hadronic energy scaled to the beam energy () versus hadronic mass (), with the estimated errors represented by an ellipse. The sensitivity to neutrino mass is largest in the region near and , as shown in Fig. 2.
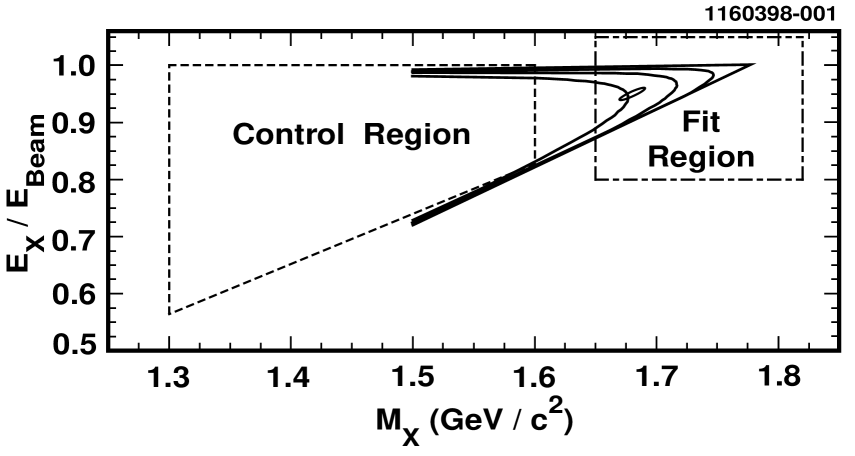
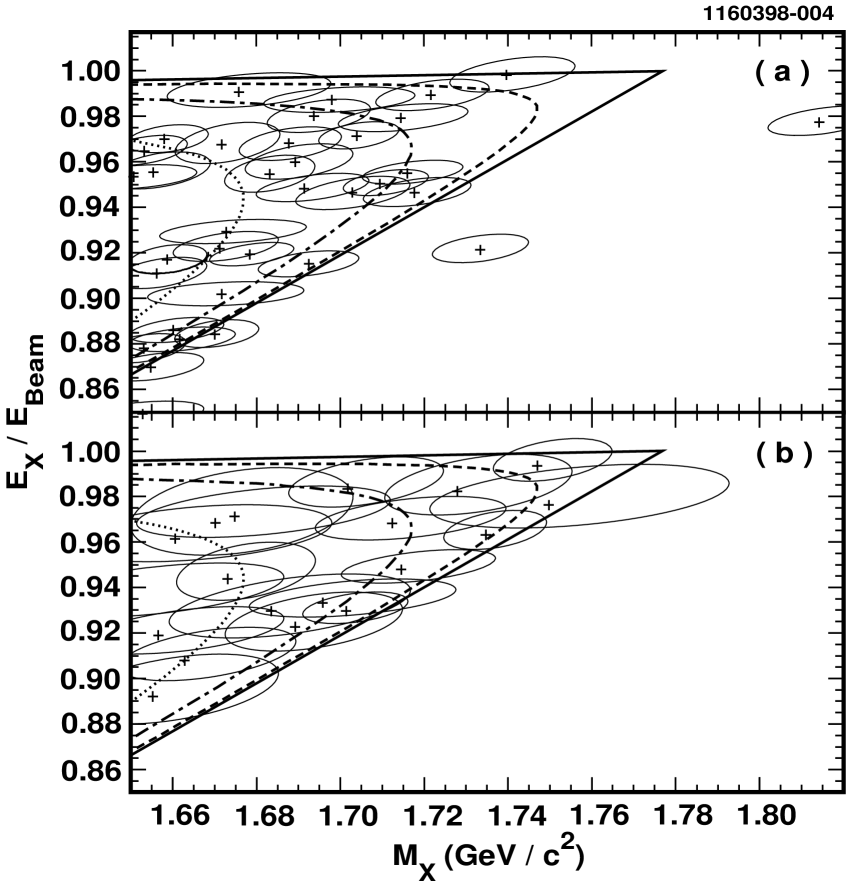
The data events are shown in Fig. 3. We determine the tau neutrino mass using the events lying in the fit region shown in Fig. 2. There are 36 events in the fit region, with negligible tau backgrounds and an estimated 0.3 events from non-tau backgrounds. There are 19 events in the fit region, with 1.0 of these expected as feed-across from other tau decay modes and 0.4 expected from non-tau backgrounds. Details of the analysis are summarized in Table I.
| Mode | ||
|---|---|---|
| Total Events | 266 | 207 |
| Events in Fit Region | 36 | 19 |
| Signal Region Purity () | 99 | 93 |
| Selection Efficiency () | 3.08 | 0.43 |
| Typical Mass Resolution (MeV/) | 15 | 25 |
| Typical Energy Resolution (MeV) | 25 | 50 |
| Upper Limit 95 CL (MeV/) | 31 | 33 |
We extract a measurement of the tau neutrino mass using an unbinned extended maximum likelihood technique. The procedure fits for one parameter (), taking as input the measured hadronic energy and mass of the events in the fit region shown in Fig. 2. The likelihood function, detailed in the appendix, is composed of a Poisson factor, expressing the number of events expected, times the sum of a signal term and a background term. The likelihood is calculated as a function of neutrino mass using a novel technique. Instead of using explicit parameterizations of the Monte Carlo in a likelihood convolution [20], Monte Carlo signal events are used in the evaluation of the likelihood, directly implementing the best knowledge of all physics effects including initial state radiation and detector acceptance. The only explicitly parameterized term is the detector smearing function.
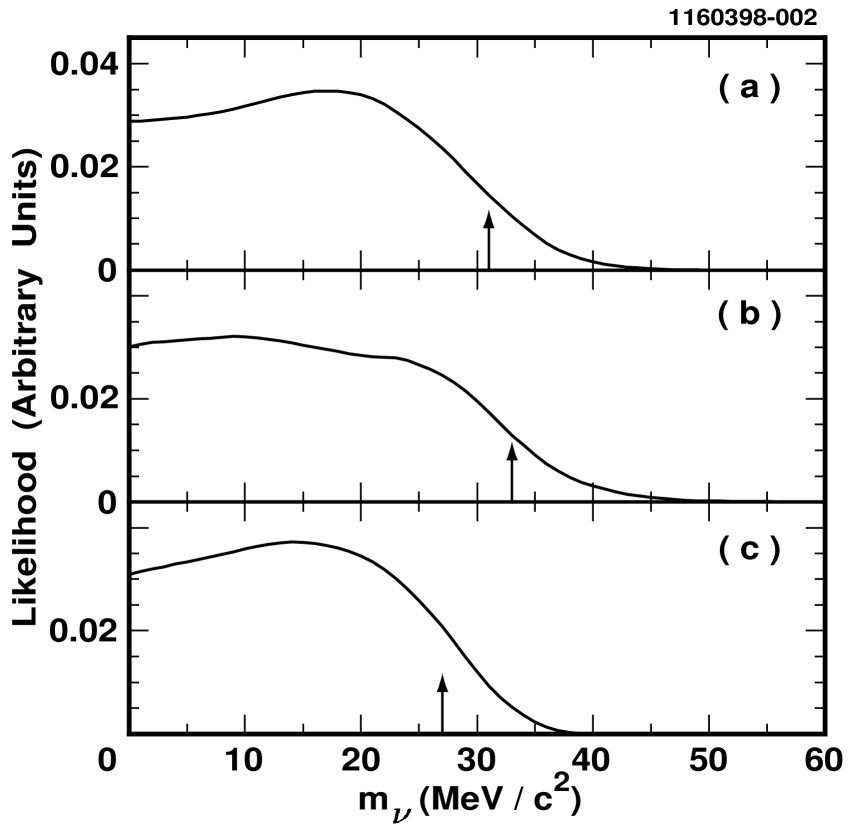
The resulting extended likelihood is shown in Fig. 4. We define††††††The method for extracting an upper limit from a likelihood distribution at a given confidence level is not unambiguously defined; the method used here differs from that used in the analysis of Ref. [6]. Therefore comparisons of upper limits among different experiments must be done with care. the 95% confidence level (CL) upper limit by integrating defined likelihood above zero mass to its ninety-fifth percentile. We find 95% CL upper limits of 33, 31, and 27 MeV/ for the , and combined samples. A separate analysis using only mass information yields a combined upper limit of 31 MeV/.
The interpretation of this limit as a meaningful statement about probability is conditional upon the measured likelihood being representative of an ensemble of similar experiments. The event distribution and the observed number of events at the endpoint are consistent with our Monte Carlo estimation with zero neutrino mass, using the spectral function tuned to the data as described below. An ensemble of Monte Carlo experiments using statistics compatible with those we observe reveal that a smaller upper limit is obtained in 67% of experiments with a massless neutrino. The average expected upper limit given our sample size is found to be 25 MeV/.
Following the conservative prescription used by the LEP experiments [20], a linear systematic error, , is added to the limit. The error is defined by
where the sum is over systematic error sources, and the difference represents the change in the nominal upper limit from each error source. Systematic errors are summarized in Table II.
| Source | Error (MeV/) |
|---|---|
| Spectral Function | 1.9 |
| Smearing Tails | 1.6 |
| Mass Scale | 1.1 |
| Smearing Parameters | 0.7 |
| MC Statistics | 0.6 |
| Background | 0.4 |
| Energy Scale | 0.3 |
| Total | 2.9 |
The largest systematic error is due to uncertainties in the spectral functions. We obtain the spectral functions from a fit to a statistically independent sample of decays recoiling against pionic decays of the tau, excluding the 100 MeV/ near the tau mass and including a background term. Each fit is a sum of two phenomenologically inspired spectra [21, 22, 23]; the dominant spectrum is the distribution predicted for the 5 pion decay of the tau as derived from the CVC predictions for 4 pion decay and soft pion theorems, and the other is the harder spectrum CVC predicts for 6 pion decays. The systematic variation for the spectral function is taken as the allowed variation in the fit parameters and results in errors of 1.5 MeV/ from the mode and 1.1 MeV/ from the mode.
The next largest systematic error comes from the modeling of the detector smearing function. The smearing function is approximated by a sum of three two-dimensional Gaussians to model its extended tails. The smearing function parameters are derived from the Monte Carlo simulation, while the widthes of each Gaussian are proportional to the event error, as estimated from the propagated tracking error matrix and the photon reconstruction errors. The errors from the modeling of the tails of the smearing function are estimated by using a fourth Gaussian component in separate fits to charm and decay data. The mass (energy) smearing is studied with charm () decays to final states with similar numbers of tracks as our samples. decays are used since the , created nearly at rest in the CLEO detector frame, allows the comparison of reconstructed energy with the beam energy. This smearing uncertainty is 1.4 MeV/ for the mode and 0.6 MeV/ for the mode. In addition, all smearing function parameters are allowed to vary within their fitted uncertainties, resulting in another 0.5 MeV/ uncertainty for each of the two modes.
The uncertainty in the absolute mass and energy scales of 1 MeV/ (as estimated from charm decays) and 2.7 MeV (from decays), respectively, contribute 1.1 MeV/ and 0.3 MeV/ to the final systematic error estimate.
Other sources of error considered are the Monte Carlo statistics used in the likelihood evaluation and the background size. The total systematic error from all sources added in quadrature is 2.9 MeV/, resulting in a final 95% C.L. upper limit on the mass of the tau neutrino of 30 MeV/.
The use of the Poisson term in this analysis’ likelihood is an improvement over a previous technique [6] because it reduces the variance in fitted neutrino mass, thus decreasing the probability of a spuriously low limit in the presence of a massive neutrino. The present analysis also uses measured event errors to avoid a possible bias. The smearing shape used in previous analyses [6, 10] depends on repeated Monte Carlo simulation of the data points, using the measured values as input to the Monte Carlo event generator. Such a method neglects the fact that events reconstructed near the endpoint stand a larger chance of being upward fluctuations from low mass events than do events in the middle of the accepted distribution, and thus tends to underestimate the mass and energy errors associated with each data point.
In summary, using the world’s largest sample of candidate and decays, we obtain a 95% confidence level upper limit on of 30 MeV/. The method used properly takes into account the change in the number of events expected at the endpoint as a function of , as well as a background contribution, and a detailed detector smearing function.
We gratefully acknowledge the effort of the CESR staff in providing us with excellent luminosity and running conditions. J.R. Patterson and I.P.J. Shipsey thank the NYI program of the NSF, M. Selen thanks the PFF program of the NSF, M. Selen and H. Yamamoto thank the OJI program of DOE, J.R. Patterson, K. Honscheid, M. Selen and V. Sharma thank the A.P. Sloan Foundation, M. Selen thanks Research Corporation, S. von Dombrowski thanks the Swiss National Science Foundation, and H. Schwarthoff thanks the Alexander von Humboldt Stiftung for support. This work was supported by the National Science Foundation, the U.S. Department of Energy, and the Natural Sciences and Engineering Research Council of Canada.
Appendix
The likelihood is given by:
The first factor is the Poisson probability of the number of events observed in the fit region, . The second factor is the product likelihood over the data events observed , and their associated errors , given an expected number of background events, .
The Poisson factor is
The expected number of signal events in the fit region , , is a function of neutrino mass and is extrapolated from the number of events seen in the control region using the partial width:
The control region is chosen away from the neutrino mass sensitive region so that the number of events expected in it does not depend strongly on the neutrino mass (see Fig. 2). The partial width is fit from an independent data sample as described in the text.
The event likelihood can be expanded as:
The first term of this expression is the neutrino mass likelihood for a pure signal. The second term expresses the background shape. The likelihoods and are normalized over the fit region and neutrino mass. The notation is to stress that we use the reconstructed (smeared) variables for the data.
The background likelihood, , is a parameterization of the background event distribution from the high tag-mass sample described in the text.
The signal likelihood, , is determined from Monte Carlo simulations, taking into account detector smearing, the physics of tau decays, and initial state radiation effects. The analytic expression for this likelihood, as used in previous analyses (see for instance [20]), can be written as:
where
-
is the reconstructed data point coordinate: ;
-
represents the physics, and is a convolution over the differential decay rate , and corrections due to initial state radiation, and beam energy smearing;
-
, a detector smearing function, is the probability of an observed given a true and an estimated error ;
-
is the total detector efficiency.
Noting that Monte Carlo events are naturally generated with a probability density proportional to , the signal likelihood for a given data event is rewritten as :
The sum is taken over all accepted Monte Carlo events, generated with a massless neutrino. The term represents the relative weight of the Monte Carlo event for a massive neutrino compared to a massless neutrino. It is calculated at the generated rather than the reconstructed , and is written as:
This is simply the ratio of differential decay rates of a tau at the (generated) value of appropriate for this Monte Carlo event and this value of neutrino mass relative to a massless neutrino. Note that the matrix element factorizes and that the hadronic currents cancel in this ratio. The function ensures that only Monte Carlo events which remain physical at the new neutrino mass are used, and is implemented by checking that the scaled energy of the Monte Carlo event falls into the physically allowed interval:
The kinematic limits are given by:
The factor ensures that the probability density used in the event likelihood is normalized for any neutrino mass:
The likelihood function used has been tested on Monte Carlo samples of decays with both massless and massive neutrinos and reproduces the input neutrino mass with no apparent bias.
REFERENCES
- [1] R. Cowsik and J. McClelland, Phys. Rev. Lett. 29 (1972) 669.
- [2] E. Kolb and M. Turner, The Early Universe, Addison-Wesley, New York, 1990.
- [3] P.J.E. Peebles, Physical Cosmology , Princeton University Press, Princeton, 1993.
- [4] M. Kawasaki et al., Nucl. Phys. B 419 (1994) 105.
- [5] J.B. Rehm, G.G. Raffelt, A. Weiss, Astronomy and Astrophysics 327 (1997) 443.
- [6] ALEPH Collaboration, D. Buskulic et al., Phys. Lett. B 349 (1995) 585.
- [7] ALEPH Collaboration, R. Barate et al., CERN PPE/97-138, submitted to Z. Phys. C.
- [8] DELPHI Collaboration, A. Galloni, R. McNulty et al., A Limit on the Tau Neutrino Mass , submitted to HEP97, Jerusalem, 1997.
- [9] OPAL Collaboration, R. Akers et al., Z. Phys. C 72 (1996) 231.
- [10] OPAL Collaboration, R. Akers et al., Z. Phys. C 65 (1995) 183.
- [11] ARGUS Collaboration, H. Albrecht et al., Phys. Lett. B 202 (1988) 149.
- [12] ARGUS Collaboration, H. Schröder, Mod. Phys. Lett. A 8 (1993) 573.
- [13] CLEO Collaboration, D. Cinabro et al., Phys. Rev. Lett. 70 (1993) 3700.
- [14] CLEO Collaboration, Y. Kubota et al., Nucl. Inst. and Meth. A 320 (1992) 66.
- [15] S.J. Sojstrand, LUND 7.3, CERN-TH-6488-92 (1992).
- [16] R. Brun et al., GEANT v. 3.14, CERN Report No. CC/EE/84-1 (1987).
- [17] KORALB (v2.2)/ TAUOLA (V2.4): S. Jadach and Z. Was, Comp. Phys. Com. 36 (1985) 191 and ibid 64 (1991) 267; S. Jadach, J.H. Kühn and Z. Was, Comp. Phys. Com. 64 (1991) 275, ibid, 70 (1992) 69, and ibid, 76 (1993) 361.
- [18] E. Barbiero, B. van Eijk and Z. Was, CERN-TH-5857/90 (1990).
- [19] Particle Data Group, R.M. Barnett et al, Phys. Rev. D54 (1996).
- [20] L. Passalacqua, Nucl. Phys. B (Proc. Suppl.) 55C (1997) 435.
- [21] Y.S. Tsai, Phys. Rev. D 4 (1971) 2821.
- [22] F. Gilman and D. Miller, Phys. Rev. D 17 (1978) 1846.
- [23] T.N. Pham, C. Roiesnel and T.N. Truong, Phys. Lett. B 78 (1978) 623.