Radiative Decay Modes of the Meson
Abstract
In this paper we describe a search for four radiative decay modes of the meson: , , , and . We obtain 90% CL upper limits on the branching ratios of these modes of , , and respectively.
D. M. Asner,1 J. Gronberg,1 T. S. Hill,1 D. J. Lange,1 R. J. Morrison,1 H. N. Nelson,1 T. K. Nelson,1 D. Roberts,1 A. Ryd,1 R. Balest,2 B. H. Behrens,2 W. T. Ford,2 A. Gritsan,2 H. Park,2 J. Roy,2 J. G. Smith,2 J. P. Alexander,3 R. Baker,3 C. Bebek,3 B. E. Berger,3 K. Berkelman,3 K. Bloom,3 V. Boisvert,3 D. G. Cassel,3 D. S. Crowcroft,3 M. Dickson,3 S. von Dombrowski,3 P. S. Drell,3 K. M. Ecklund,3 R. Ehrlich,3 A. D. Foland,3 P. Gaidarev,3 L. Gibbons,3 B. Gittelman,3 S. W. Gray,3 D. L. Hartill,3 B. K. Heltsley,3 P. I. Hopman,3 J. Kandaswamy,3 P. C. Kim,3 D. L. Kreinick,3 T. Lee,3 Y. Liu,3 N. B. Mistry,3 C. R. Ng,3 E. Nordberg,3 M. Ogg,3,***Permanent address: University of Texas, Austin TX 78712. J. R. Patterson,3 D. Peterson,3 D. Riley,3 A. Soffer,3 B. Valant-Spaight,3 C. Ward,3 M. Athanas,4 P. Avery,4 C. D. Jones,4 M. Lohner,4 S. Patton,4 C. Prescott,4 J. Yelton,4 J. Zheng,4 G. Brandenburg,5 R. A. Briere,5 A. Ershov,5 Y. S. Gao,5 D. Y.-J. Kim,5 R. Wilson,5 H. Yamamoto,5 T. E. Browder,6 Y. Li,6 J. L. Rodriguez,6 T. Bergfeld,7 B. I. Eisenstein,7 J. Ernst,7 G. E. Gladding,7 G. D. Gollin,7 R. M. Hans,7 E. Johnson,7 I. Karliner,7 M. A. Marsh,7 M. Palmer,7 M. Selen,7 J. J. Thaler,7 K. W. Edwards,8 A. Bellerive,9 R. Janicek,9 D. B. MacFarlane,9 P. M. Patel,9 A. J. Sadoff,10 R. Ammar,11 P. Baringer,11 A. Bean,11 D. Besson,11 D. Coppage,11 C. Darling,11 R. Davis,11 S. Kotov,11 I. Kravchenko,11 N. Kwak,11 L. Zhou,11 S. Anderson,12 Y. Kubota,12 S. J. Lee,12 J. J. O’Neill,12 R. Poling,12 T. Riehle,12 A. Smith,12 M. S. Alam,13 S. B. Athar,13 Z. Ling,13 A. H. Mahmood,13 S. Timm,13 F. Wappler,13 A. Anastassov,14 J. E. Duboscq,14 D. Fujino,14,†††Permanent address: Lawrence Livermore National Laboratory, Livermore, CA 94551. K. K. Gan,14 T. Hart,14 K. Honscheid,14 H. Kagan,14 R. Kass,14 J. Lee,14 M. B. Spencer,14 M. Sung,14 A. Undrus,14,‡‡‡Permanent address: BINP, RU-630090 Novosibirsk, Russia. A. Wolf,14 M. M. Zoeller,14 B. Nemati,15 S. J. Richichi,15 W. R. Ross,15 H. Severini,15 P. Skubic,15 M. Bishai,16 J. Fast,16 J. W. Hinson,16 N. Menon,16 D. H. Miller,16 E. I. Shibata,16 I. P. J. Shipsey,16 M. Yurko,16 S. Glenn,17 S. D. Johnson,17 Y. Kwon,17,§§§Permanent address: Yonsei University, Seoul 120-749, Korea. S. Roberts,17 E. H. Thorndike,17 C. P. Jessop,18 K. Lingel,18 H. Marsiske,18 M. L. Perl,18 V. Savinov,18 D. Ugolini,18 R. Wang,18 X. Zhou,18 T. E. Coan,19 V. Fadeyev,19 I. Korolkov,19 Y. Maravin,19 I. Narsky,19 V. Shelkov,19 J. Staeck,19 R. Stroynowski,19 I. Volobouev,19 J. Ye,19 M. Artuso,20 F. Azfar,20 A. Efimov,20 M. Goldberg,20 D. He,20 S. Kopp,20 G. C. Moneti,20 R. Mountain,20 S. Schuh,20 T. Skwarnicki,20 S. Stone,20 G. Viehhauser,20 X. Xing,20 J. Bartelt,21 S. E. Csorna,21 V. Jain,21,¶¶¶Permanent address: Brookhaven National Laboratory, Upton, NY 11973. K. W. McLean,21 S. Marka,21 R. Godang,22 K. Kinoshita,22 I. C. Lai,22 P. Pomianowski,22 S. Schrenk,22 G. Bonvicini,23 D. Cinabro,23 R. Greene,23 L. P. Perera,23 G. J. Zhou,23 M. Chadha,24 S. Chan,24 G. Eigen,24 J. S. Miller,24 C. O’Grady,24 M. Schmidtler,24 J. Urheim,24 A. J. Weinstein,24 F. Würthwein,24 D. W. Bliss,25 G. Masek,25 H. P. Paar,25 S. Prell,25 and V. Sharma25
1University of California, Santa Barbara, California 93106
2University of Colorado, Boulder, Colorado 80309-0390
3Cornell University, Ithaca, New York 14853
4University of Florida, Gainesville, Florida 32611
5Harvard University, Cambridge, Massachusetts 02138
6University of Hawaii at Manoa, Honolulu, Hawaii 96822
7University of Illinois, Urbana-Champaign, Illinois 61801
8Carleton University, Ottawa, Ontario, Canada K1S 5B6
and the Institute of Particle Physics, Canada
9McGill University, Montréal, Québec, Canada H3A 2T8
and the Institute of Particle Physics, Canada
10Ithaca College, Ithaca, New York 14850
11University of Kansas, Lawrence, Kansas 66045
12University of Minnesota, Minneapolis, Minnesota 55455
13State University of New York at Albany, Albany, New York 12222
14Ohio State University, Columbus, Ohio 43210
15University of Oklahoma, Norman, Oklahoma 73019
16Purdue University, West Lafayette, Indiana 47907
17University of Rochester, Rochester, New York 14627
18Stanford Linear Accelerator Center, Stanford University, Stanford, California 94309
19Southern Methodist University, Dallas, Texas 75275
20Syracuse University, Syracuse, New York 13244
21Vanderbilt University, Nashville, Tennessee 37235
22Virginia Polytechnic Institute and State University, Blacksburg, Virginia 24061
23Wayne State University, Detroit, Michigan 48202
24California Institute of Technology, Pasadena, California 91125
25University of California, San Diego, La Jolla, California 92093
I Introduction
Motivated by the successful CLEO II search for decays[1], we have looked for analogous decays in the charm sector. In this paper we consider decays of the pseudo-scalar meson to final states consisting of a vector meson (,,or ) plus a photon.
Unlike decays, the short-range amplitudes relevant to are expected to be overwhelmed by much larger long-range electro-magnetic effects. The dominant diagrams describing these electro-magnetic amplitudes are shown in Figure 1. In each case, a pair of vector mesons is produced. Providing the quantum numbers are correct, one of these can couple to a photon. The phenomenology of such interactions, called “Vector Meson Dominance” (VMD), has been well studied [2]. Using VMD, one can make rough estimates of the expected rates for the modes studied in this paper. If the coupling of the photon to the transverse component of a results in a vector conversion with about 1% probability, we can use the Particle Data Group [3] value for the branching ratio, , and expect that BR() is about , where is the fraction of ’s produced in the decay of the which are transversely polarized. Detailed calculations of the long-range, -exchange and other contributing processes have been published by several groups [4, 5, 6, 7, 8]. The predictions range from to and are listed in Table I.
In the sector, observation of the decay at the measured rate provided compelling evidence for the existence of a “penguin” contribution to the mesons decay amplitude into this channel. The analogous short range penguin diagrams for the radiative decay of mesons are expected to contribute at the level of [4, 9], making them relatively unimportant.
The long range electro-magnetic contributions that are expected to dominate decay amplitudes also contribute in the sector. Their contribution to , for example, may be as big as 20%[10]. It is hoped that a study of these effects in the charm sector can improve our understanding of their relevance to bottom decay.
The CLEO collaboration has recently published a complimentary analysis searching for flavor changing neutral currents in decays[11].
II Dataset and Event Selection
The data used for the analysis described in this paper were acquired with the CLEO II detector [12] at the Cornell Electron Storage Ring (CESR), and represents a total integrated luminosity of .
When searching for decays we apply several selection criteria on both the photon and vector meson candidates before attempting to reconstruct the [13]. We look for and require . We also demand that the time of flight and specific ionization of both daughter tracks be consistent with Kaon hypotheses. We require candidates to decay into and have . Both photons from the are required to be in the central region of the detector, , and the invariant mass must be consistent with a with . To improve the measurement of the 4-vector, the photons are kinematically fit to the known mass.
We look for and require . In this mode we also make a cut on the decay angle of the daughter particles in the rest frame, requiring , since signal events should follow a distribution due to angular momentum conservation. Finally, we reconstruct ’s through the decay and require .
In all cases we require that the “radiative” photon be in the central region of the calorimeter, have an energy greater than 830 MeV, and have a calorimeter shower isolated from charged tracks in the event. To avoid background from decays we veto photons that are part of a candidate with .
In this analysis, all candidates are required to come from a decay. The additional kinematic constraint provided by the is used to significantly reduce the otherwise large combinatoric background. We require the reconstructed mass difference between the and the , , to be between 144.3 MeV/ and 146.5 MeV/. To further reduce the background, we demand that , where is defined to be the momentum of the candidate divided by the maximum possible momentum.
The specific values of the cuts discussed above were chosen after a systematic study of for each of the modes, using large samples of GEANT[14] based Monte-Carlo data to model each specific signal as well as the background.
III Backgrounds
To learn about possible sources of background for each of the four decay modes, a large sample of Monte-Carlo generated events was analyzed. The predominant background source found was real decays where the decayed in channels involving ’s, which in turn decayed such that one of the photons had very little energy and went undetected. Since the decay in the above sequence is real, backgrounds of this kind will result in a false signal that peaks in the mass difference distribution. Additional peaking in the mass spectrum will depend on kinematics.
This type of background is most severe for the analysis because poorly reconstructed decays, where one of the ’s photons is missed, will peak in the signal region. Figure 2 shows the mass distribution for a set of events analyzed as .
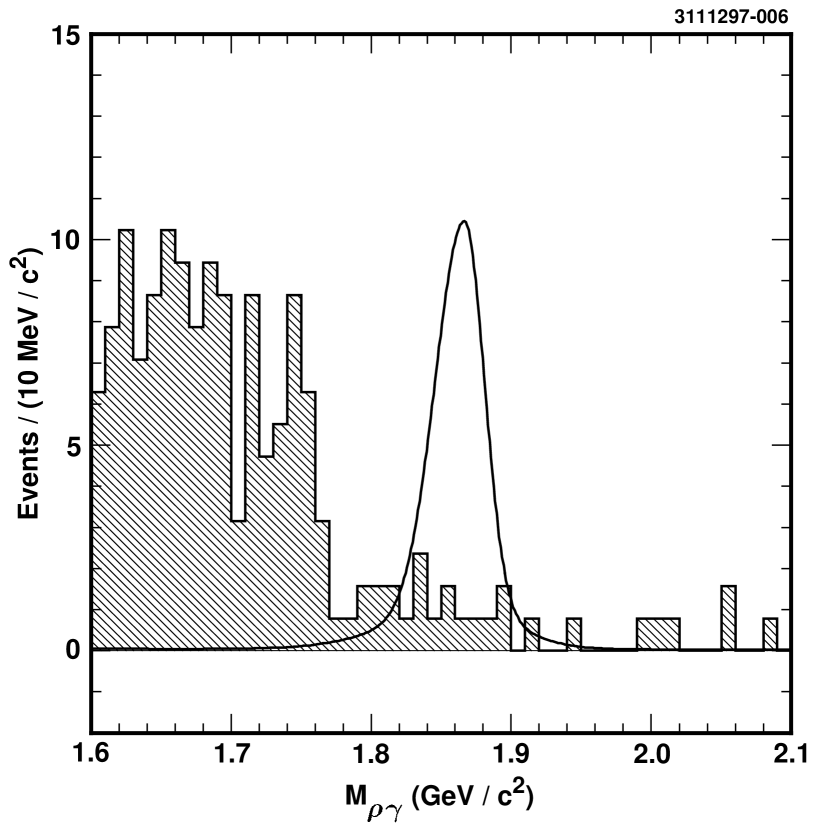
In the case of the problem is less severe since there is no background decay mode which peaks in the signal region of our invariant mass distribution, although misreconstructed events cause the upward distortion of the invariant mass spectrum just below the expected mass. Figure 3 shows the distribution of these events when analyzed as .
For the modes and there are no decay modes with large enough branching ratios to cause noticeable peaking in the reconstructed invariant mass distribution, hence we expect the background in the mass spectra of these to be smooth.
IV Signal Yields and Limits
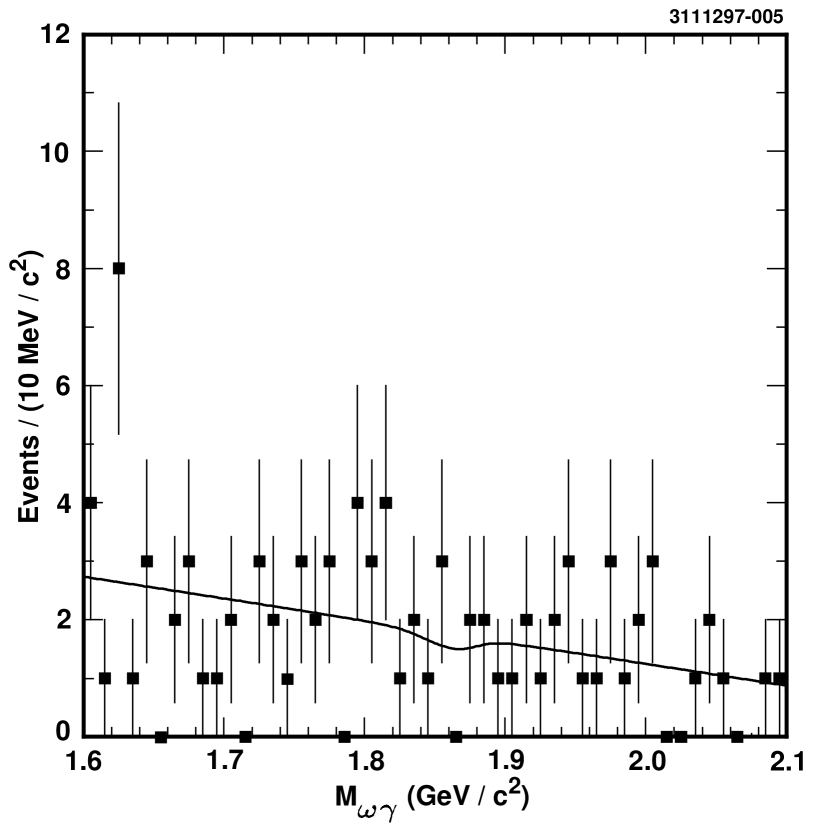
All yields were obtained by fitting the mass spectra. The signal in all cases was parameterized by a double bifurcated Gaussian whose mean and width were determined using Monte-Carlo. The background shape used depended on the mode. In the cases of and the background is expected to be smooth and likelihood fits were done using simple linear background. The data and fits for these modes are shown in Figures 4 and 5.
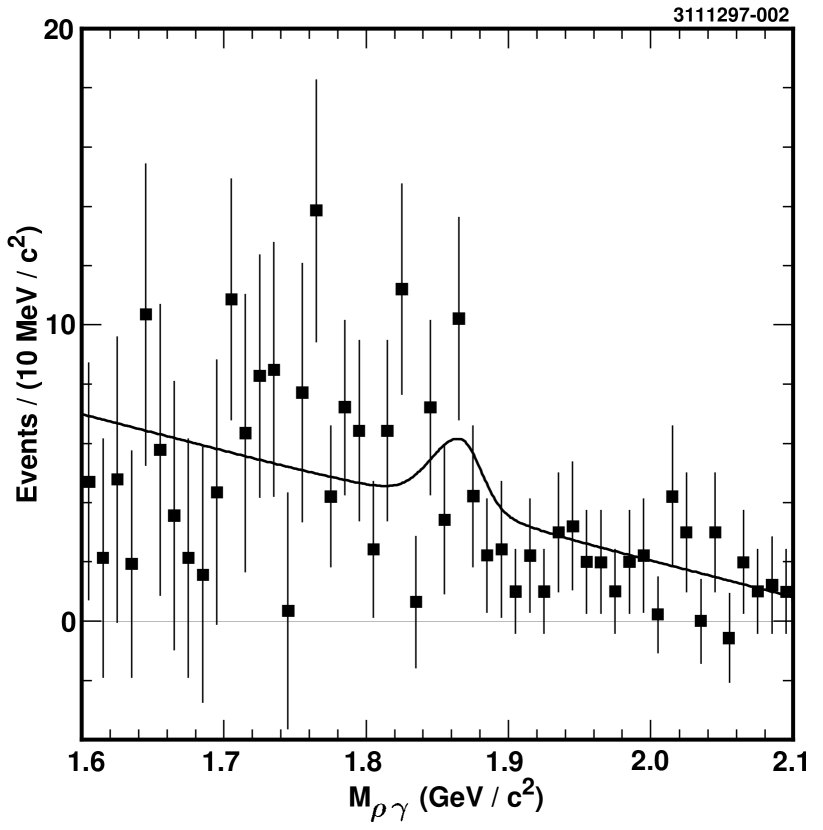
In the cases of and , we know the background shape is significantly modified by misreconstructed decays. Using Monte-Carlo, we determined the magnitude and shape of this contribution to the invariant mass spectrum, and in both cases included an additional component in our fits to compensate. The absolute normalization of this additional component was determined from a previous analysis of decays[15]. Figures 6 and 7(b) show the mass spectra and fits for these modes after subtracting the contribution from misreconstructed .
The results are summarized in Table I. The efficiency for each mode was determined by analyzing samples of GEANT[14] based Monte-Carlo “signal” events, and is also presented in Table I. To obtain branching ratios from the efficiency corrected yields we performed a parallel analysis looking for , decays. Our yield in this mode was events with an overall analysis efficiency of () %, determined using Monte-Carlo. Using the PDG value of () % for the branching ratio we find the initial number of decays in our data sample was .
V Systematic Errors
Several sources of possible systematic error were investigated, and the results are presented in Table II. With the exception of , the uncertainty in each case is dominated by uncertainties in fitting. To investigate this error we systematically changed either the combinatorial background shape, the normalization of the background component (in the and cases only), the signal shape, and the number of bins used in the fits. Constant, linear and quadratic background functions were tried. Signal shapes were parameterized by Gaussian, Double Gaussian, bifurcated Gaussian and the double bifurcated Gaussian shapes. In each case we took the largest variation as our estimate of the systematic error.
As an additional check we excluded the signal region and fit only the background, using simple event counting in the signal region combined with Poisson statistics to obtain the upper limits. The result of this procedure for , the mode having the otherwise biggest fitting uncertainties, is shown in Figure 7(a). In this case we fitted the data with a linear combinatorial component plus the absolutely normalized Monte-Carlo predicted background, excluding the region between and from the fit. We then count data and predicted background events in the same region to obtain a net yield of . Using a conservative yield of events results in a 90% CL upper limit yield of 39 events, consistent with the original fitted result.
The vector meson mass cuts were studied by varying them to produce a 10% change in efficiency and reanalyzing both data and Monte-Carlo with the new values to estimate the systematic error.
To estimate the errors associated with analysis requirements common to all of the studied modes (the mass difference and scaled momentum) while avoiding the problem of low statistics in the modes of interest, we used numbers obtained in a previous measurement of [15].
From a CLEO study of the decays and , we assign a 5.5% systematic error for uncertainty in the overall finding efficiency and a 2.5% uncertainty for each individual photon. The systematic error due to particle identification was estimated by removing that cut entirely and noting the change.
The systematic errors on the yield and the efficiency were treated separately when calculating the final upper limits. The efficiency and normalization errors were combined in quadrature and the efficiency was reduced by the resulting factor. The fitting systematic errors were used to increase the 90% CL upper limit yields.
VI Conclusion
Using data representing of integrated luminosity acquired by the CLEO II detector at the Cornell Electron Storage Ring, we have conducted a search for radiative decay modes of the meson. The final results for the 90% confidence level upper limit branching ratios for the modes studied are:
We note that all of these values are well above the theoretical expectations as shown in Table I. We hope that with more data from CESR, KEK and PEP-II B-factories it will be possible to provide improved measurements in the future.
We gratefully acknowledge the effort of the CESR staff in providing us with excellent luminosity and running conditions. J.P.A., J.R.P., and I.P.J.S. thank the NYI program of the NSF, M.S. thanks the PFF program of the NSF, G.E. thanks the Heisenberg Foundation, K.K.G., M.S., H.N.N., T.S., and H.Y. thank the OJI program of DOE, J.R.P., K.H., M.S. and V.S. thank the A.P. Sloan Foundation, M.S. thanks Research Corporation, and S.D. thanks the Swiss National Science Foundation for support. This work was supported by the National Science Foundation, the U.S. Department of Energy, and the Natural Sciences and Engineering Research Council of Canada.
REFERENCES
- [1] CLEO Collaboration, M.S. Alam et al., Phys. Rev. Lett. 74, 2885 (1995).
- [2] M. Gell-Mann, D. Sharp and W.G. Wagner, Phys. Rev. Lett. 8, 261 (1962).
- [3] R. M. Barnet et al., Phys. Rev. D 54, 1 (1996).
- [4] G. Burdman, E. Golowich, J. Hewett and S. Pakvasa, Phys. Rev. D 52, 6383 (1995).
- [5] B. Bajc et al., Phys. Rev. D 54, 5883 (1996).
- [6] B. Bajc et al., Phys. Rev. D 51, 2230 (1996).
- [7] H. Cheng et al., Phys. Rev. D 51, 1199 (1995).
- [8] S. Fajfer, S. Prelovsek and P. Singer. Hep-ph/9801279.
- [9] C. Greub, T. Hurth, M. Misiak and D. Wyler, Phys. Lett. B 382, 415 (1996).
- [10] E. Golowich and S. Pakvasa, Phys. Rev. D 51, 1215 (1995).
- [11] CLEO Collaboration, A. Freyberger et al. Phys. Rev. Lett. 76, 3065 (1996).
- [12] CLEO Collaboration, Y. Kubota et al. Nucl. Instrum. Methods Phys. Res., Sect. A 320, 66 (1992).
- [13] Charge conjugation is implied throughout.
- [14] R. Brun et al., CERN Report No. CERN-DD/EE/84-1, 1987 (unpublished).
- [15] CLEO Collaboration, B. Barish et al., Phys. Lett. B 373, 334 (1996).
The upper limit yields extracted from the likelihood fit and the resulting 90% confidence level upper limits on the branching fractions incorporating systematic uncertainties in yield and efficiency determination. Mode 90% CL Upper Limit Yield 8.9 7.7 38.5 21.6 Detection Efficiency (%) Branching Fraction 90% CL Upper Limit Theoretical Prediction [4, 5, 6, 7, 8]
Estimated systematic errors for the four modes. Mode Normalization 3.87% 3.87% 3.87% 3.87% Monte-Carlo Stat. 2.25% 2.4% 2.3% 2.3% Branching Ratio of the Vector Meson 1.2% 0.8% 0.1% 0% Photon and Eff. 2.5% 8.5% 2.5% 2.5% Vector-meson Mass Cut 3.4% 2.6% 2.3% 3.0% Other Cuts 1.5% 1.5% 1.5% 1.5% Particle ID 9.2% — — — Yield/Fitting 11.8% 7.3% 38.8% 23.6% Total Systematic Error 16% 12% 39% 24%
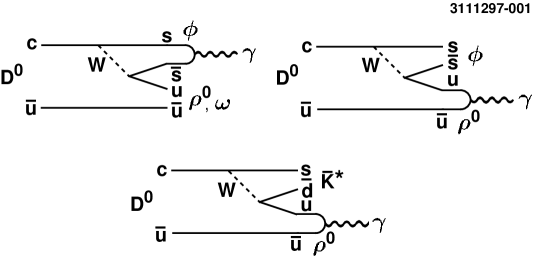
Feynman diagrams for the long distance electro-magnetic contributions.
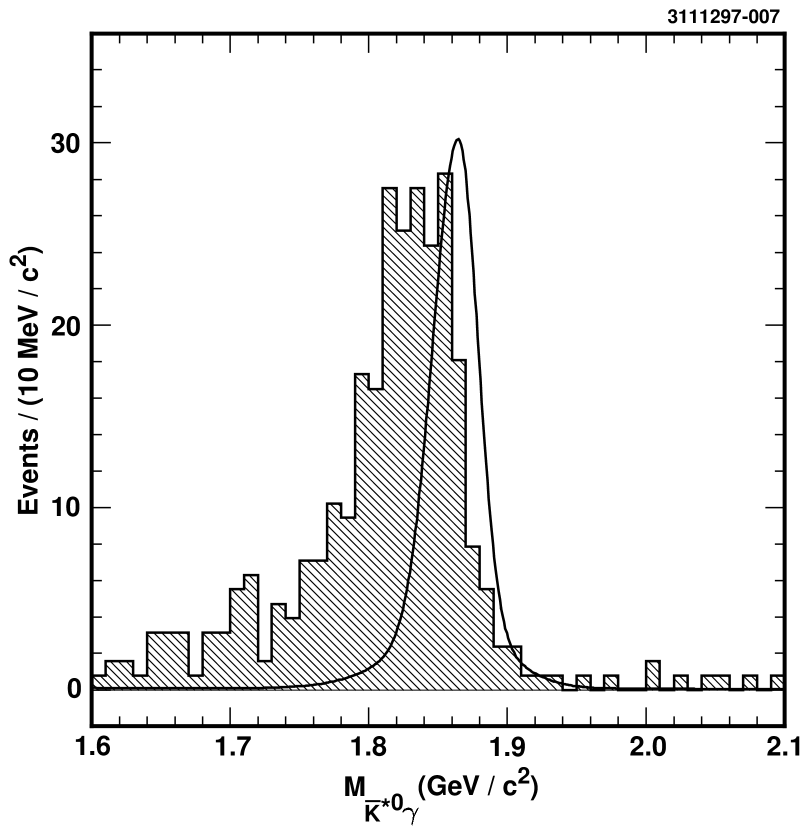
The correctly normalized background contribution from Monte-Carlo events to the invariant mass distribution (shaded histogram). The solid line shows the expected position and shape for real events, also determined using Monte-Carlo.
The correctly normalized background contribution from Monte-Carlo events to the invariant mass distribution (shaded histogram). The solid line shows the expected position and shape for real events, also determined using Monte-Carlo.
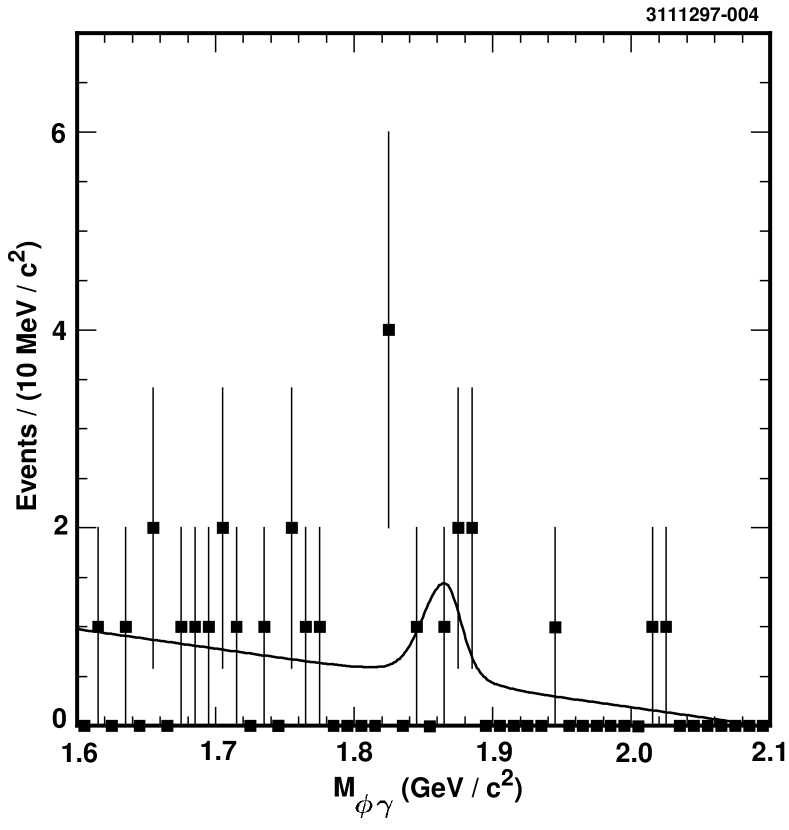
Data and fit for the decay mode.
Data and fit for the decay mode.
Data and fit for the decay mode. This plot shows the data after subtraction of the background estimation from Monte-Carlo.
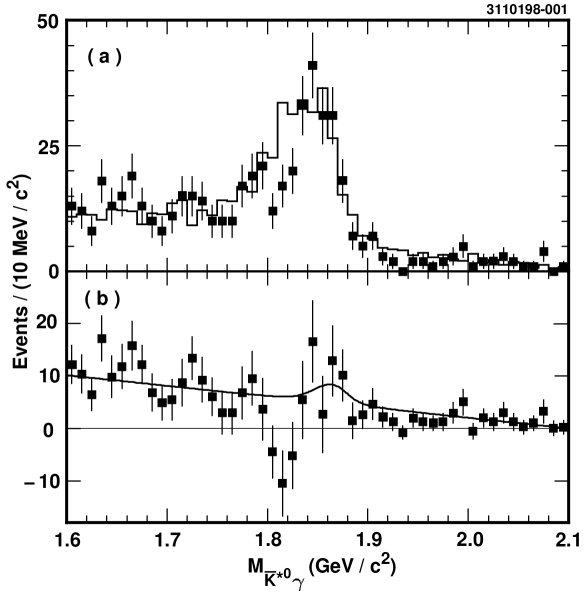
(a) The observed data (points with error bars) and Monte-Carlo predicted background (solid histogram).
(b) Data and fit for the decay mode after subtraction of the background prediction.
.