Experimental Measurements of Atmospheric Neutrinos
Abstract
This talk reports the latest indications of an anomaly in the measurements of atmospheric neutrinos. New results from Soudan-2 and Super-Kamiokande provide evidence that the ratio of to interactions is not as expected. High energy Super-Kamiokande data indicates the cause is a deficit of upward-going , and the zenith angle dependence of the effect is consistent with neutrino oscillations. Upward-going muon measurements by several detectors are discussed, but in total they provide inconclusive evidence for the anomaly.
1 Introduction
Large underground detectors originally built to search for proton decay are also exposed to a flux of neutrinos created by cosmic ray showers in the upper atmosphere. Neutrino interactions in the detector can mimic proton decay, and therefore a great effort has gone into predicting the rate and topology of the neutrino background. A byproduct of this effort has been the recognition of an anomaly: the relative rate of and interactions disagrees with expectation, and the baseline and energy dependence of the disagreement suggests that neutrino oscillation may be the culprit.
The nature of these experiments is to measure the rate of neutrino interactions in the detector and to compare that rate with theoretical prediction. The theoretical task is to predict the neutrino flux as a function of energy, direction, and flavor, taking into account measurements of cosmic ray flux, geomagnetic cutoff, and production and decay of secondary mesons. Detailed Monte Carlo programs are used to estimate the cross section for neutrino interaction and simulate the response of the detector. The experimental task is to measure as much as possible about the neutrino interaction, in particular, the energy, direction, and flavor of the final state lepton, from which the neutrino properties are inferred.
2 Flux prediction
One of the tenets of the atmospheric neutrino anomaly is that the flux ratio111technically () is more accurately predicted that the or flux alone. The principal effect is that cosmic ray showers consist mostly of pions, which decay to , and the decays to to , resulting in a flux ratio (. The authors of detailed calculations of the flux models have collaborated to compare results[1] and reached an understanding of many of the differences between their earlier publications. Two updated calculations[2, 3] cover a wide energy range (10 MeV–10 TeV) and are used by current experiments. There are now also an assortment of new high altitude measurements available for comparison [4, 5, 6]. Further details of flux calculations were presented at this meeting by T. Stanev[7]. However, there is currently no indication that poor knowledge of the predicted flux could be responsible for the experimental anomalies described below.
3 Summary of results
To study the () flux ratio, most experiments calculate the double-ratio or ratio-of-ratios:
| (1) |
where refers to the number of events where the final state lepton is classified as -like or -like by some identification algorithm. As mentioned above, the ratio of to flux is accurately predicted; in addition, other theoretical and experimental uncertainties largely cancel. Table 1 lists previous measurements222The first uncertainty quoted is statistical, the second is systematic; this convention will be used throughout the paper. of for GeV, including the new results from Soudan and Super-Kamiokande discussed in this paper. The kinematic limits differ somewhat from experiment to experiment, with minimum lepton momenta requirements from 100 to 200 MeV/c. Kamiokande restricted their sample to333Visible energy () is defined as the energy of an electromagnetic shower that produces a given amount of Cherenkov light. GeV, IMB to GeV; the other experiments did not specify an upper limit, but all results are dominated by GeV neutrinos.
| Experiment | kt-yr | events | R (data/MC) |
|---|---|---|---|
| Super-K[8] | 25.5 | 1853 | |
| IMB[9] | 7.7 | 610 | |
| Kam.[10] | 7.7 | 482 | |
| Soudan-2[12] | 3.2 | 200 | |
| Fréjus[13] | 2.0 | 200 | |
| NUSEX[14] | 0.7 | 50 |
Kamiokande also studied events with 1.33 GeV (multi-GeV) and included partially contained (PC) events where a track was detected exiting the inner detector[15]. They measured a low value for of , but more interesting was the dependence of on zenith angle. Neutrinos that travelled km from below showed a small value of , but those that travelled km from above agreed with expectation, suggesting an oscillation length somewhere in between.
Most of the IMB multi-GeV exposure had a restriction on the maximum number of PMT hits (to concentrate on proton decay); the restriction was eventually removed, so they made a separate analysis[16] of their last 2.1 ktyears for GeV and measured with no zenith dependence. The caveats are: limited statistics of 72 events (some overlapping with Ref.[9]); no outer detector to help identify PC muons; coarser sampling (4% photon coverage), resulting in only 90% correct identification.
4 Soudan-2
Until recently, atmospheric neutrino results seemed to be divided between water Cherenkov detectors [9, 10] (anomalous) and iron calorimeters [13, 14] (as expected). The Soudan-2 collaboration, which operates a fine-grained iron tracking calorimeter in Minnesota, U.S.A., has recently published results [11] which support the anomaly seen in the water Cherenkov experiments.
At this meeting, T. Kafka has updated the results from Soudan-2 to 3.2 ktyears[12]. They measure 91 single-prong track events (mostly charged current (CC) ) with MeV/c, and 137 shower events (mostly CC-) with MeV/c. The interaction vertex is allowed as close as 20 cm from the edge of the detector; with only 32 gm/ of shielding they observe a significant (25-30%) background from gamma rays and neutrons associated with nearby cosmic rays. However, they use an active shield of proportional tube planes lining the detector hall to veto most nearby cosmic rays, as well as separately estimate the remaining background rate as a function of flavor, depth into the detector, and energy.
After background subtraction, the number of shower events matches their Monte Carlo prediction; however they observe 37% fewer tracks than they predict. Since the total flux is uncertain, it is better to consider the double-ratio, which they measure to be . Regarding the atmospheric neutrino anomaly, this is a considerable new piece of information, as the systematics are very different from the water Cherenkov detectors. Although there are no demonstrated nuclear effects that would change the ratio of to cross sections[17], it interesting that the anomaly has also been seen in Fe as well as in . What the difference is between these results and those of Fréjus and NUSEX (beyond what may be encompassed by large uncertainties) remains to be explained.
5 Super-Kamiokande
Super-Kamiokande is the next generation water Cherenkov experiment after IMB and Kamiokande. The detector resides nearby the old Kamiokande detector in a mine near Kamioka, Japan. However, it is much larger (22.5 kton fiducial mass, versus 1 kton for Kamiokande and 3.3 kton for IMB). It is instrumented with 11,146 PMTs, each 50 cm across, such that 40% of the inner surface area is active photocathode. The PMTs and electronics are of advanced design, with 2.5 ns RMS timing for single photoelectrons. The inner detector is surrounded by an outer volume of water 2.7 m thick that shields against incoming radioactivy and is instrumented with PMTs to tag penetrating muons. Further description of the detector, as well as new measurements of the solar neutrino flux were presented at this conference by K. Inoue[18].
The measurement from Super-Kamiokande is the result of a 414.2 live-day exposure (25.5 ktonyrs) during the period from May 1996 to October 1997. The data is reduced from approximately 800K events per day to about 30 events per day by a series of software cuts. The most powerful requirement is the absence of hits in the outer detector, which indicates a fully contained (FC) interaction. The remaining events are then filtered by a visual scan, where the principal backgrounds are: (1) cosmic ray muons that evade the outer detector veto, typically by entering along cable bundles and then stopping in the detector, and (2) “flashing” PMTs that emit light due to internal corona discharge. The partially contained sample is formed by a different reduction program from the same exposure444The results quoted here are updated from previous conference presentations, where PC livetime was somewhat less than FC livetime, and PC data was scaled (by ) when FC+PC results were plotted., since outer detector hits are now expected, and the background rejection of entering cosmic rays is different. A 10.0 live-year Monte Carlo sample of interactions is passed through the same reduction chains, except for the visual scan.
The remaining events, both data and Monte Carlo, are passed through the same reconstruction code to: (a) fit the vertex of the interaction, by residual PMT timing, (b) count the number of Cherenkov rings, (c) estimate the direction of each ring, (d) estimate the energy of each ring, (e) determine the particle type (-like,-like) for each ring, and (f) count the number of -decay electrons that follow each event. Most of the analysis is then done with the sample of events in which the number of rings found in (b) is exactly one. In most cases, this is the final state lepton from a charged current neutrino interaction; the principal contamination is single pion production associated with neutral current (NC) interactions.
The absolute energy scale was determined to accuracy using several calibration signatures: LINAC electrons, radioactive sources, s and cosmic ray muons. About 9 photoelectrons are recorded for 1 MeV of visible energy. Conversion to lepton momentum takes into account the Cherenkov cutoff for muons.
Data samples are defined using the same kinematic criteria as in the Kamiokande experiment: , , and for sub-GeV; for multi-GeV FC. The partially contained sample is specified by a vertex in the inner detector and correlated hits in the outer detector; the minimum visible energy required is MeV. Because is GeV for the PC sample, these data are added to to the FC multi-GeV sample; the CC lepton is assumed to be a muon, and no single-ring is required. The fiducial sample is restricted to events with vertex 2 m from the PMT wall (22.5 kton).
| Monte Carlo prediction | Monte Carlo breakdown | |||||
| Data | Bartol[3] | Honda[2] | CC- | CC- | NC | |
| sub-GeV -like | 983 | 788.9 | 812.2 | 2% | 88% | 10% |
| sub-GeV -like | 900 | 1185.4 | 1218.3 | 96% | 0.5% | 4% |
| sub-GeV multi-ring | 696 | 753.7 | 759.2 | 43% | 24% | 33% |
| multi-GeV -like | 218 | 190.9 | 182.7 | 7% | 84% | 9% |
| multi-GeV F.C. -like | 176 | 229.7 | 229.0 | 99% | 0.5% | 0.4% |
| multi-GeV P.C. (-like) | 230 | 305.0 | 287.7 | 98% | 1.5% | 0.6% |
| multi-GeV multi-ring | 398 | 450.1 | 433.6 | 55% | 30% | 15% |
The event totals are listed in Table 2 along with the totals for the Monte Carlo samples, scaled to 25.5 ktonyrs. These yield the following values of :
For both the high and low energy samples there is a significant deviation of the ratio from the expected value of 1. The leading contributions to the systematic uncertainty in are: () flux (5%), neutrino cross section (4.6% for sub-GeV and 5.8% for multi-GeV), and single-ring selection (3% for sub-GeV and 6% for multi-GeV).
It is informative to check the relative rate of -decay associated with the event sample. The decay electrons are detected as time separated hits from the neutrino interaction; most come either from associated , or directly from in CC- interactions. The performance of identification algorithms is no longer in question [19], but the measured -decay fractions check that the associated pion production is reasonably modeled in the Monte Carlo. Table 3 shows that the expected fraction of -decay agrees well with the prediction; the fraction of -decay found in stopping cosmic ray muons verifies the efficiency of the reconstruction.
| Percentage of events with -decay | ||
|---|---|---|
| Data | Monte Carlo | |
| stopping CR | ||
| -like | ||
| -like | ||
| Percentage of events with -decay | ||
| Data | M.C. | |
| stopping CR | ||
| -like | ||
| -like | ||
The Super-Kamiokande group had two independent analysis efforts that were used to check each other and minimize the possibility that some mistake would be made. The data were separated after electronics calibration of the PMT data to photoelectrons and nanoseconds. Otherwise, everything was coded independently, including event reduction and reconstruction, Monte Carlo generation, and estimation of the energy scale. Beyond the independent code, the major differences in the second analysis were: (a) data reduction involved no scanning, (b) single-ring selection was based on an algorithm that classified events as single-ring or multiple-ring without attempting to count the number of rings, (c) identification was somewhat simpler and less efficient (97% vs 99%), (d) some details of vertex and direction reconstruction were different.
Upon comparison, the independent analyses were in exceptional agreement. Of the sub-GeV events found in the fiducial volume by the second analysis, 99.9% were found in the data sample of the first analysis, with 89% in the fiducial volume, consistent with the vertex fit resolution. Single-ring classification was in agreement 90% of the time. Comparing common events in the fiducial single-ring sub-GeV sample, vertices agreed to 84 cm RMS, direction agreed to 2.5∘, momentum agreed to 0.5%, 97% of the events agreed in particle identification. The value of for the sub-GeV sample of the second analysis is: 0.650.030.05; the difference in value from the first analysis is understood to be due to differences in analysis methods and within their systematic uncertainties. In sum, the independent analysis provides reassurance that the deviation of from unity is not due to experimental mistakes.
To consider that the anomalous is due to neutrino oscillation, one looks for a path length or energy dependence of the effect. The probability of two-flavor neutrino oscillation from to is given by:
| (2) |
where and are fundamental parameters that govern the neutrino mixing, and and are the path length and energy of the neutrino. The final state lepton direction and energy are correlated with the incoming neutrino; for the sub-GeV sample, the mean opening angle for – is , for – it is ; for the multi-GeV sample it improves to .
The samples are divided into 5 bins where is the angle between the outgoing lepton direction and the nadir555Caveat: the IMB collaboration used the opposite definition, so down-going neutrinos are near in their publications.; so down-going neutrinos that are produced directly overhead, with short travel distance, populate the bin near . Calculating for each zenith bin results in Fig. 1. A slight asymmetry is evident in the sub-GeV sample, and a strong asymmetry is evident in the multi-GeV sample. If there were no anomaly, the values would be around 1; for hypothetical oscillation parameters of and , the dashed line is expected, and is a better match to the data.

It is interesting to check the result as a function of position in the detector because (a) some reconstruction algorithms are less certain for vertices close to the PMT wall, and (b) possible backgrounds, such as neutrons from nearby cosmic rays [21, 22], or entering events that evade the outer detector veto, would accumulate near the fiducial boundary. Figure 2a shows versus distance from the PMT wall, where the fiducial volume is found at 2 meters. Figure 2b shows the zenith angle dependence of R, dividing the data into two approximately equal fiducial volumes: an outer volume between 2–5 m from the PMT wall and an inner volume greater than 5 m from the wall. There is no variation of the result due to the fiducial boundary evident in either figure.

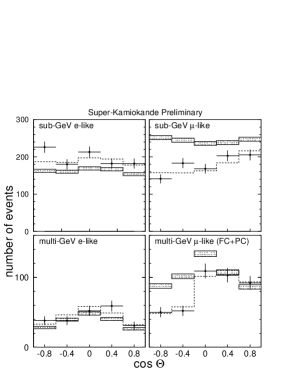
The double-ratio of to is useful to illustrate the effect, but it does not indicate whether or rates (or both) are affected. Furthermore, is not so practical for statistical tests. Figure 3 shows the and rates separately for sub-GeV and multi-GeV (FC+PC) compared to Monte Carlo prediction. The solid bands are the absolute prediction, where the height of the band is equal to the Monte Carlo statistical uncertainty. Not shown is the normalization uncertainty, which is highly correlated bin-to-bin, between and , and between sub-GeV and multi-GeV. Even accounting for this uncertainty, it is apparent that the anomalous is dominated by a deficit of -like events coming from below ().
The significance of this result can be easily evaluated by calculating the up-down asymmetry ) where up and down are defined by and respectively (Tab.4). Besides other interesting possibilities[20], the distribution of is nicely described by a gaussian variance. For multi-GeV events, and should be nearly symmetrical, whereas for -like data (FC+PC) differs from expectation by greater than .
| Sample | |||
|---|---|---|---|
| -like data | 102 | 195 | 0.3130.055 |
| -like data | 76 | 90 | 0.0840.077 |
| -like MC | 1669 | 1707 | 0.0130.017 |
| -like MC | 596 | 589 | -0.0060.029 |
The dashed line in Fig.3 represents an oscillation hypothesis666The values represent a test point; the exact best fit location can change when the technique or data sample changes since the minimum is fairly flat. of (,) for disappearance. The overall normalization is adjusted upward (thus the -like rate increases to better match the data, even when mixing is not considered) while (2) is used to calculate the probability of disappearance and reweight the Monte Carlo. The travel distance is calculated as a function of energy and flavor based on a production height model[23]. The oscillation hypothesis provides a reasonable fit to the data, certainly better than the null hypothesis.
The exact details of fitting the data to estimate possible mixing parameters are still being evaluated. Using a method similar to that used by Kamiokande[15], terms are formed between the data and Monte Carlo prediction [modified by ], binned in zenith angle, energy, and flavor (values of are not used directly in the fit). The normalization, ratio and systematic terms are allowed to adjust and contribute to the . For the Super-Kamiokande data, the minimum is found to be rather likely, 30% depending on the details. From the fit, a confidence interval is drawn based on (90% CL) such as shown in Fig. 4.

The preferred interval for is found near because the upward zenith bin with km, presumably has averaged over several oscillation lengths and is one half. In a scenario where more than two flavors are mixing, the average value can be less than one half. The range is determined by the shape of the zenith angle, also considering dependence on . This 90% confidence interval from Super-Kamiokande prefers a lower range in than that found by the Kamiokande collaboration[15], which had a minimum of .
6 Upward-Going Muons
The above discussion covered neutrino interactions in the fiducial volume of the detector. The other class of atmospheric neutrino event studied is that of interactions in the rock around the detector, where the final state muon enters the sensitive region of the detector. To separate these from ordinary cosmic ray muons, the muon must be upward-going, or come from the direction of a known thick overburden. The parent neutrino energy is – GeV, significantly higher than for contained events.
There are several current measurements of the total rate of upward-going muons. In addition to the water Cherenkov detectors described elsewhere in this paper, MACRO and Baksan are large area scintillator detectors that distinguish upward-going muons by time-of-flight; T. Montaruli (MACRO) and S. Mikheyev (Baksan) have presented updated results at this conference. The measured and expected event rates are compared in Table 5; the experiments are listed in order of increasing absorber depth for directly vertical muons. The uncertainty in the measured number of events is statistical only; some experiments have estimated that the uncertainty due to experimental systematics could be as large as 8%. The uncertainty in the expected number of events is a common 15–20%, due mostly to the uncertainty in the absolute flux. Considering this, in no case is a significant deficit of muons measured, but the measurements are generally low compared to expectation.
| Number of Events | ||
|---|---|---|
| Experiment | Measured | Expected |
| MACRO[24] | 472 | |
| Baksan[25] | 557 | |
| Kamiokande[26] | 414 | |
| IMB[27] | 550 or 625 | |
| Super-K[28] | 445 | |
There are two other approaches that probe neutrino oscillations[29] using upward-going muons. IMB measured the ratio of stopping upward muons ( GeV) to through-going upward muons ( GeV) to be . Although much of the flux uncertainty cancels out, the usual analytic integration using deep inelastic scattering and parton distribution functions must be handled with care[27, 30], especially at low energy[31]. After these considerations, the predicted rate was .14 or .18 depending on the flux model[27]. Based on the agreement of data with prediction, a small excluded region in , was drawn around , where the strongest deviation would have been found; this happens to be in conflict with the region favored by the Super-K contained vertex data. Super-Kamiokande will also measure the stopping ratio, with the advantage of a very thick detector that stops a large number of upward-going muons; the analysis is in progress.
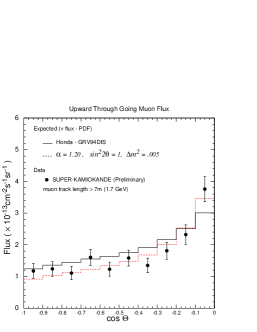
The second approach uses the shape of the zenith distribution, which may be distorted as the baseline varies from 500 km at the horizon to 12,000 km at the nadir. Because the energy spectrum of the parent neutrinos is broad, GeV, the change in shape is gradual, with some steepening at the horizon as the probability decreases for high energy to oscillate. Figure 5 shows the Super-K measurement of the flux versus zenith angle compared to expectation; recall that the normalization of the prediction is uncertain to 20%. When the normalization of the Monte Carlo is decreased by a factor of to match the data, the is 12.7; alternatively, when the normalization is increased by a factor of , and disappearance oscillations are applied with , , the fit is somewhat better, with a of 8.3.
The other experiments listed in Table 5 can make this comparison as well. The scintillator detectors MACRO and Baksan unfortunately have reduced acceptance at the horizontal, so those bins require significant geometric correction. Curiously, even the well-measured upward bins of those two experiments are not smooth and suffer from poor agreement in shape with: (a) no oscillation, (b) any 2-flavor oscillation parameters777A recent preprint considers that matter oscillation with a sterile neutrino crossing the Earth’s core may modulate the prediction with features similar to the MACRO data[33]., and (c) each other. Both experimental groups have made extensive checks for a systematic error, but have found no cause[25, 32].
7 Conclusions
Currently, the evidence for an anomalous ratio of atmospheric neutrino flavors is inconsistent across experiments. Of course, prior results remain intact, and either support or disagree with the anomaly. But the latest results support that a significant discrepancy exists between experiment and prediction. The measurement by Soudan-2 shows that the anomaly is not specific to water Cherenkov detectors. A zenith angle measurement of the Soudan-2 data could be very interesting. Significant new information is taken from the high statistics Super-Kamiokande data: the anomaly is strongly confirmed in and the zenith angle dependence of . The shape of the zenith angle dependence is very suggestive of neutrino oscillations. The multi-GeV -like rate as a function of zenith angle indicates that disappearance is favored over oscillation. Even though 1.1 years of Super-Kamiokande running has surpassed the prior world statistics, more livetime will be welcome and allow finer subdivision of the data for cross-checks and estimation of possible mixing parameters.
Still, to claim the atmospheric anomaly is caused by neutrino mixing requires confirmation with as many other signatures as possible. Upward-going muons currently show a mix of results, none obviously refuting or confirming. The upward flux measurement of Super-Kamiokande is consistent with the estimated parameters from the contained vertex sample, but the result is not conclusive. Further analysis of stopping muons and the angular distribution is awaited.
In the end, the best confirmation should come from long-baseline neutrino beams from accelerators. However, according to the preliminary Super-K results, the experiments under construction may have to address lower values of than when they were conceived.
8 Acknowledgements
The author thanks the conference organizers and the participants listed in this paper. He is especially appreciative of his collaborators on Super-Kamiokande for preparing the latest results, which are presented here on their behalf. He gratefully acknowledges financial support by the U.S. Department of Energy.
References
- [1] T.K. Gaisser et al., Phys. Rev. D54 (1996) 5578.
- [2] M. Honda et al., Phys. Lett. B248 (1990) 193; M. Honda et al., ibid.D52 (1995) 4985.
- [3] G. Barr et al., Phys. Rev. D39(1989) 3532; V. Agrawal et al., ibid.D53(1996) 1314; T.K. Gaisser and T. Stanev, Proc. 24th Int. Cosmic Ray Conf.(Rome) Vol.1 (1995) 694.
- [4] M. Circella et al., Proc. 25th Int. Cosmic Ray Conf.(Durban) Vol.7 (1997) 117.
- [5] G. Barbiellini et al., Proc. 25th Int. Cosmic Ray Conf.(Durban) Vol.6 (1997) 317.
- [6] G. Tarlé et al., Proc. 25th Int. Cosmic Ray Conf.(Durban) Vol.6 (1997) 321.
- [7] T. Stanev, These proceedings.
- [8] Y. Fukuda et al., submitted to Phys. Lett., ICRR-Report-411-98-7, hep-ex/9803006.
- [9] D. Casper et al., Phys. Rev. Lett. 66 (1991) 2561; R. Becker-Szendy, et al., Phys. Rev. D46 (1992) 3720.
- [10] K.S. Hirata et al., Phys. Lett. B205 (1988) 416; K.S. Hirata et al., ibid.B280 (1992) 146.
- [11] W.W.M. Allison et al., Phys. Lett. B391 (1997) 491
- [12] T. Kafka, These proceedings.
- [13] K. Daum et al., Z. Phys. C66 (1995) 417.
- [14] M. Aglietta et al., Europhys. Lett. 8 (1989) 611.
- [15] Y. Fukuda et al., Phys. Lett. B335 (1994) 237.
- [16] R. Clark et al., Phys. Rev. Lett. 79 (1997) 345.
- [17] J. Engel et al., Phys. Rev. D48 (1993) 3048.
- [18] K. Inoue, These proceedings.
- [19] S. Kasuga et al., Phys. Lett. B374 (1996) 238.
- [20] J. Flanagan et al., UH-511-880-97, hep-ph/9709438
- [21] O.G. Ryaznskaya, JETP Lett. 61 (1995) 237.
- [22] Y. Fukuda et al., Phys. Lett. B388 (1996) 397.
- [23] T.K. Gaiser and T. Stanev, BRI-97-28, astro-ph/9708146.
- [24] T. Montaruli, These proceedings.
- [25] S. Mikheyev, These proceedings.
- [26] Y. Totsuka, 28th Int. Symposium on Lepton Photon Interactions, Hamburg, 1997; Kamiokande collaboration, To be published.
- [27] R. Becker-Szendy et al., Nucl. Phys. B38 (Proc. Supp.) (1995) 331.
- [28] Super-Kamiokande collaboration, To be published.
- [29] P. Lipari and M. Lusignoli, ROME-1190-97, hep-ph/9712278.
- [30] W. Frati et al., Phys. Rev. D48 (1993) 1140.
- [31] P. Lipari et al., Phys. Rev. Lett. 74 (1995) 4384.
- [32] MACRO collaboration, In preparation.
- [33] Q.Y. Liu and A.Yu. Smirnov, IC-97-211, hep-ph/9712493.