SLAC–PUB–7719
December 1997
Electroweak and Heavy Flavor Physics at SLD
Abstract
We review recent electroweak and B physics results obtained in polarized interactions at the SLC by the SLD experiment. Unique and precise measurements of the electroweak parameters , , , and provide powerful constraints on the Standard Model. The excellent 3-D vertexing capabilities of SLD are further exploited to extract precise and lifetimes, as well as measurements of the time evolution of mixing.
Presented at the Workshop on Physics at the First Muon Collider and at the Front End of a Muon Collider, 6-9 November 1997, Fermilab, Batavia, IL.
Electroweak and Heavy Flavor Physics at SLD
Stéphane Willocq
Introduction
The various measurements presented below rely on the strengths of the SLC/SLD environment. Most important is the fact that the electrons are longitudinally polarized at the interaction point. Average polarizations of , and were measured during the 1993, 1994–95, and 1996 data taking periods with a Compton Polarimeter Woods . The numbers of hadronic decays collected during these periods are approximately 50K, 100K, and 50K, respectively. A description of the detector can be found in Ref. Rb and references therein.
Electroweak Physics
In the Standard Model (SM), the tree-level differential cross section for is expressed by
| (1) |
where is the cosine of the angle between the final state fermion and the incident electron directions, is the electron beam longitudinal polarization, and and are the asymmetry parameters for the initial and final state fermions, respectively. The parameter represents the extent of parity violation at the vertex and is defined as , with the left- and right-handed coupling constants and .
The existence of parity violation introduces a forward-backward asymmetry which is equal to . At the SLC, the electron beam polarization allows a left-right forward-backward asymmetry to be measured
| (2) |
The latter asymmetry provides a direct measurement of and yields a statistical enhancement factor of over the unpolarized forward-backward asymmetry.
A particularly powerful yet straightforward asymmetry is the left-right cross-section asymmetry , which yields a direct measurement of the coupling between the and the initial state.
Measurements of the ratio between the partial decay width into and that into any hadron are also sensitive to the coupling constants .
Precise measurements of and probe the effect of radiative corrections to the propagator and the vertex. Since the radiative corrections depend on the top and Higgs masses, precise measurements can measure or constrain these quantities. Furthermore, such measurements also are sensitive to physics beyond the SM. Vacuum polarization corrections affect the value of which is most precisely measured by the left-right asymmetry . Heavy quark partial widths and asymmetry parameters are most sensitive to vertex corrections but with different sensitivity to left- and right-handed coupling constants, e.g., () is more sensitive to deviations in the left- (right-) handed coupling.
Electroweak measurements at SLD are only summarized here, for a complete review of recent measurements see Ref. Schumm .
Left-Right Cross-Section Asymmetry
The measurement of is a simple counting experiment. One needs to count the number of produced with left- and right-handed electron beams, and measure the average electron beam polarization. The event sample is selected using tracking and calorimetry information and mostly consists of hadronic decays (99.9%). In the 1996 data, the number of selected events is 28,713 and 22,662 for left- and right-handed electrons, respectively. The resulting measured asymmetry is (stat). A very small correction (syst) is applied to take into account residual contamination in the event sample and slight beam asymmetries. Finally, the result is corrected for the electron beam polarization, the initial and final state radiation as well as for scaling the result to the pole energy: , giving . This preliminary measurement can be combined with previous measurements from the 1992, 1993, and 1994–95 running periods ALR9495 to yield and . This represents the most precise measurement of by a single experiment and its uncertainty is completely dominated by the statistical error.
Further information about can be obtained from decays into a pair of charged leptons ( or ). If lepton universality is assumed, the measurements may be combined to yield
| (3) |
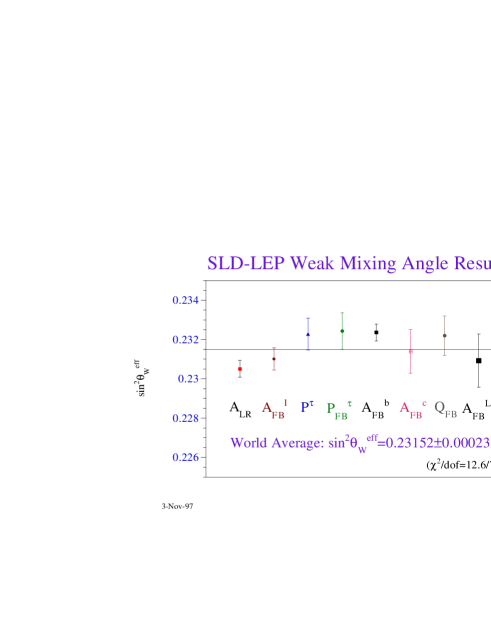
This value can be compared with the LEP average of obtained from lepton forward-backward asymmetries and polarization measurements. The SLD and LEP lepton averages agree within . Fig. 1 compares the SLD measurement with all others obtained at LEP.
Decay Partial Widths
Another observable providing strong constraints on the SM is . The measurement proceeds by selecting hadronic decays and tagging each event hemisphere independently for the presence of a hadron decay. By computing both the rate for tagging a hemisphere and the rate for tagging both hemispheres in an event, one can extract the value of and the hemisphere tag efficiency from the data. The Monte Carlo (MC) is used to estimate the charm and efficiencies as well as the small correlation between hemispheres.
SLD has designed a new approach to achieve high-efficiency and high-purity tagging. The excellent 3-D vertexing capabilities of the vertex detector allow decays to be reconstructed with an inclusive topological techniqueZVTOP . This technique relies on the precise knowledge of the interaction point (IP), 7 m (15-35 m) perpendicular to (along) the beam direction, and the precise tracking achieved with the pixel-based vertex detectors: VXD2 for 1993–95 and VXD3 for 1996 and beyond. The upgraded detector (VXD3) provides much improved polar angle coverage (), lever arm and self-tracking capabilities, as well as a significantly reduced amount of material. Secondary vertices are found in () of hemispheres, () of hemispheres but in less than 1% of hemispheres for VXD2 (VXD3). The hemisphere vertex finding efficiency increases with the decay length to attain a constant level of 80% for mm. Due to the typical cascade structure of the decays, not all tracks originate from a single space point. Therefore, isolated tracks are attached to the vertex if they extrapolate close to the vertex line-of-flight and are sufficiently displaced from the IP.
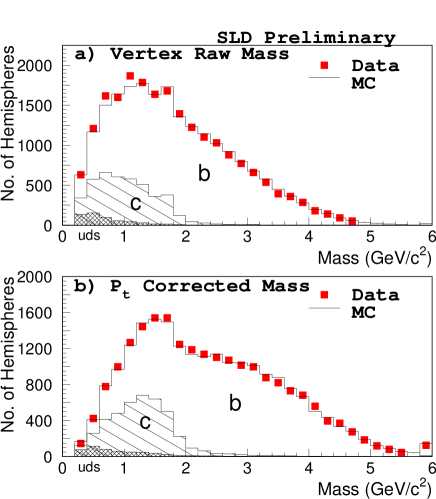
The mass of the reconstructed vertex is used to tag hemispheres. A clear separation between and light-flavor hemispheres can be observed in Fig. 2(a). In particular, the charm contribution vanishes above the natural cutoff mass of 2 GeV. Improved tagging efficiency is achieved by constructing the -added mass: , where is the total momentum of all tracks in the vertex in the plane perpendicular to the vertex axis. The value of is minimized taking into account the uncertainties in the vertex and IP positions. As a result, the -tag efficiency is enhanced by approximately 40% without significant degradation in purity [see Fig. 2(b)].
Requiring GeV yields -tag efficiencies of and for the 1993–95 and 1996 data, respectively. The corresponding samples are 98% pure in hadrons. Combining all measurements yields , in agreement with the SM value of 0.2158.
The above mass tag can be expanded to provide both a tag for GeV and a tag for GeV. The tag is improved by utilizing the total momentum of tracks attached to the vertex, exploiting the fact that charm hadrons in events have a harder momentum spectrum than in events. Similarly as was done for , a system of five equations can be solved for the various - and -tagging fractions. Here, the values of , , as well as the - and -tag efficiencies are extracted from the data. The -tag efficiencies are measured to be and for 1993–95 and 1996 data, respectively, with charm purities of 68%. Combining all data samples yields , in agreement with the SM value of 0.172. This double-tag technique has the advantage of having the lowest systematic uncertainty of all current measurements.
Heavy Flavor Asymmetries
Different techniques have been used to measure the asymmetry parameters and . These differ mostly by the method used to determine which hemisphere contains the primary or quark: jet charge, vertex charge, kaon charge, charge or lepton charge. The first step (after hadronic event selection) in each analysis is to tag () events either by applying the mass tag utilized for the () analysis, or by utilizing the fact that leptons from hadron decays have harder and (with respect to the jet axis) distributions than those from other processes. and/or are determined with a fit to the -dependent differential cross section [Eq. (1)]. The thrust axis direction is used to provide the primary quark axis, except for the lepton analysis which uses the jet axis.
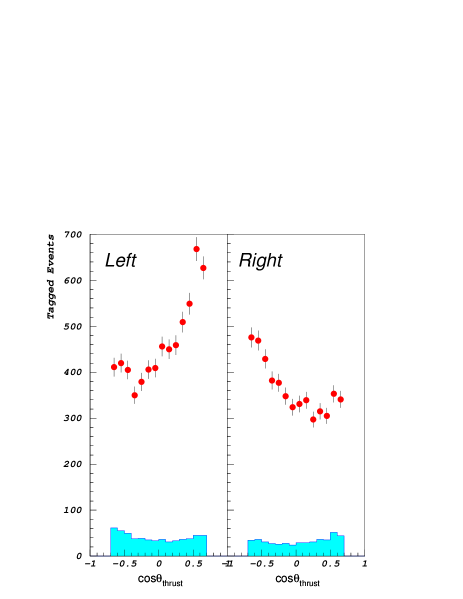
The first measurement tags / with a momentum-weighted track charge defined as , where is the three-momentum of each track and its charge, is the direction of the event thrust axis, signed such as to make , and the coefficient . The 100% tag efficiency allows the analyzing power of the tag to be calibrated directly from the data. The probability to correctly tag the primary / quark is , where the constant is measured to be . The average correct tag probability is thus .
Clear forward-backward asymmetries are then observed for left- and right-handed electron beams, see Fig. 3.
The second measurement tags by exploiting the dominant transition in decays. Therefore, detection of () mesons tags () quarks. Right-sign kaon production has been measured by ARGUSArgusK in and decays to be and , respectively. The analysis presented here is the first application of kaon tagging for a heavy quark asymmetry measurement. Charged kaons are identified with the Cherenkov Ring Imaging Detector and the rate of pion misidentification is carefully calibrated from and decay data samples.
Another approach to heavy quark selection and flavor tagging is to select leptons from semileptonic decays. The distinctive lepton total and transverse momenta are exploited as well as the charge of the lepton.
The measured values of obtained with the three different tagging techniques are presented in Table 1. The SLD average agrees well with the SM prediction of 0.935.
| Jet Charge | Kaon Charge | Lepton Charge | SLD average |
|---|---|---|---|
We have also performed measurements of the asymmetry parameter in decays. The most powerful measurement relies on combined kaon charge and vertex charge tags. This particular measurement based on only 150K hadronic decays is already among the best and should become dominant with a modest increase in statistics. is also measured with two more traditional techniques, as summarized in Table 2. The SLD average agrees well with the SM prediction of 0.67.
| Kaon & Vtx Charge | Lepton Charge | Charge | SLD average |
|---|---|---|---|
B Physics
Several aspects of the weak interaction can be probed by studying the weak decays of hadrons. First, by measuring lifetimes, we can test our understanding of hadron decay dynamics. Second, we can test the Cabibbo-Kobayashi-Maskawa (CKM) quark mixing matrix description within the SM.
and Lifetimes
A strong lifetime hierarchy is observed in the case of charm hadrons: . This hierarchy is predicted to scale with the inverse of the heavy quark mass squared and the hadron lifetimes are expected to differ by only 10-20%Bigi ; Neubert .
The technique used by SLD takes advantage of the excellent 3-D vertexing capabilities of the VXD to reconstruct the decays inclusively. The goal is to reconstruct and identify all the tracks originating from the decay chain. This then allows charged and neutral mesons to be separated by simply measuring the total charge of tracks associated with the decay.
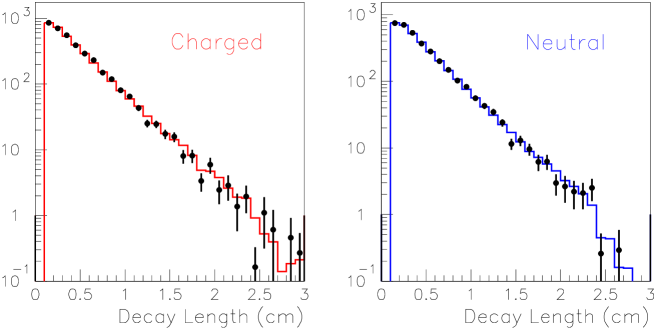
The analysis blrtopol uses the inclusive topological vertexing technique described earlier. In the hadronic event sample, we select 20,783 decay candidates by requiring GeV and mm. The sample is divided into 7942 neutral and 12841 charged vertices corresponding to reconstructed decays with total charge and , respectively, where is the charge sum of all tracks associated with the vertex. MC studies show that the ratio between and decays in the charged sample is 1.55 (1.72) for VXD2 (VXD3), and the ratio between and decays in the neutral sample is 1.96 (2.24) for VXD2 (VXD3)111Reference to a specific state (e.g., ) implicitly includes its charge conjugate (i.e., )..
The and lifetimes are extracted with a simultaneous binned maximum likelihood fit to the decay length distributions of the charged and neutral samples (see Fig. 4). The maximum likelihood fit yields lifetimes of ps, ps, with a lifetime ratio of .
The main contributions to the systematic error come from uncertainties in the detector modeling, lifetime, -baryon fraction, fit systematics, and MC statistics.
These measurements are among the best currently available and confirm the expectation that the and lifetimes are nearly equal.
Mixing
Transitions between flavor states take place via second order weak interactions “box diagrams.” The oscillation frequency for mixing depends on the CKM matrix element for which little is known experimentally. Theoretical uncertainties are significantly reduced for the ratio between and . Thus, combining measurements of the oscillation frequency of both and mixing translates into a measurement of the ratio .
Experimentally, a measurement of the time dependence of mixing requires three ingredients: (i) the decay proper time has to be reconstructed, (ii) the flavor at production (initial state ) needs to be determined, as well as (iii) the flavor at decay (final state ). At SLD, the time dependence of mixing has been measured using four different methods. All four use the same initial state tagging but differ by the method used to either reconstruct the decay or tag its final state.
Initial state tagging takes advantage of the large polarization-dependent forward-backward asymmetry in decays as described above. For left- (right-) handed electrons and forward (backward) decay vertices, the initial quark is tagged as a quark; otherwise, it is tagged as a quark. The initial state tag can be augmented by using a momentum-weighted track charge (see measurement above) in the hemisphere opposite that of the reconstructed vertex. These two tags are combined to yield an initial state tag with 100% efficiency and effective average right-tag probability of 82% (for ).
Two mixing analyses use topological vertexing (see measurement) to reconstruct decays. The flavor tag is performed by using either a kaon-charge tag (as in the analysis) or by exploiting the cascade charge structure. This latter tag is a novel technique developed by SLD which relies on a “vertex charge dipole” defined as , where the first (second) term is a sum over all positive (negative) tracks in the vertex and the quantity corresponds to the longitudinal separation between the IP and the point of closest approach of track to the vertex line-of-flight. The weight is inversely proportional to the uncertainty in . Two other analyses select semileptonic decays and thus use the lepton charge for the flavor tag.
The time dependence of mixing is measured from the fraction of decays tagged as mixed as a function of decay length or proper time. The four measurements are combined to produce the following SLD average: ps-1, consistent with the world average value of ps-1. Further details about the above measurements may be found in Ref. Willocq and references therein.
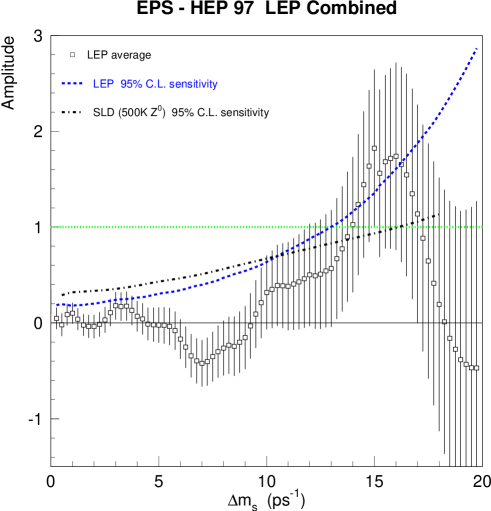
The above techniques (except for the kaon tag) can be extended to study mixing. Recent studies at LEP indicate that the oscillation frequency is very large: ps-1 at the 95% C.L. Therefore, excellent proper time, and thus decay length, resolution is required to improve that limit or observe oscillations. With VXD3, SLD expects to achieve decay length resolutions of 80-100 m, i.e. a factor of better than those obtained at LEP. Given a sample of 500K hadronic decays with VXD3, a limit of ps-1 can be set at the 95% C.L., see Fig. 5.
Summary and Prospects
Using samples of 150K and 50K hadronic decays collected in 1993–95 and 1996, the SLD Collaboration has produced precise and/or unique tests of the Standard Model. These analyses take advantage of the large longitudinal electron beam polarization, the small and stable SLC beam spot, the high-resolution 3-D pixel vertex detector, and the particle identification capabilities of the Cherenkov Ring Imaging Detector.
Many measurements relying on precise tracking will benefit greatly from the increased resolution and coverage of the upgraded vertex detector (VXD3) installed before the 1996 run. SLD expects to collect another 300K to 400K by the end of the 1997-98 run. With that sample, SLD will surpass the precision achieved by the combined LEP measurements of and , and approach the same precision for . Furthermore, the superior resolution will enable SLD to significantly increase the sensitivity to mixing beyond that currently attained by the LEP experiments.
References
- (1) M. Woods, in Proceedings of the AIP Conference, Vol. 343 (1995), p. 230.
- (2) SLD Collab., K. Abe et al., Phys. Rev. D 53, 1023 (1996).
- (3) B. Schumm, Electroweak Results from the SLD, SLAC-PUB-7697, Nov. 1997.
- (4) SLD Collab., K. Abe et al., Phys. Rev. Lett. 78, 2075 (1997).
- (5) D. Jackson, Nucl. Instrum. Methods A 388, 247 (1997).
- (6) ARGUS Collab., H. Albrecht et al., Z. Phys. C 62, 371 (1994).
- (7) I. I. Bigi et al., in B Decays, ed. S. Stone (World Scientific, New York, 1994), p. 132.
- (8) M. Neubert and C.T. Sachrajda, Nucl. Phys. B483, 339 (1997).
- (9) K. Abe et al., Measurement of the and Lifetimes using Topological Vertexing at SLD, SLAC-PUB-7635, August 1997.
- (10) S. Willocq, B Physics at SLD, SLAC-PUB-7567, June 1997.