Measurement of using partial reconstruction of
Abstract
We present a measurement of the absolute branching fraction for using the reconstruction of the decay chain , where only the lepton and the low-momentum pion from the are detected. With data collected by the CLEO II detector at the Cornell Electron Storage Ring, we have determined .
pacs:
PACS numbers: 13.25.Ft, 14.40.LbM. Artuso,1 F. Azfar,1 A. Efimov,1 M. Goldberg,1 D. He,1 S. Kopp,1 G. C. Moneti,1 R. Mountain,1 S. Schuh,1 T. Skwarnicki,1 S. Stone,1 G. Viehhauser,1 X. Xing,1 J. Bartelt,2 S. E. Csorna,2 V. Jain,2,***Permanent address: Brookhaven National Laboratory, Upton, NY 11973. K. W. McLean,2 S. Marka,2 R. Godang,3 K. Kinoshita,3 I. C. Lai,3 P. Pomianowski,3 S. Schrenk,3 G. Bonvicini,4 D. Cinabro,4 R. Greene,4 L. P. Perera,4 G. J. Zhou,4 M. Chadha,5 S. Chan,5 G. Eigen,5 J. S. Miller,5 C. O’Grady,5 M. Schmidtler,5 J. Urheim,5 A. J. Weinstein,5 F. Würthwein,5 D. W. Bliss,6 G. Masek,6 H. P. Paar,6 S. Prell,6 V. Sharma,6 D. M. Asner,7 J. Gronberg,7 T. S. Hill,7 D. J. Lange,7 R. J. Morrison,7 H. N. Nelson,7 T. K. Nelson,7 D. Roberts,7 A. Ryd,7 R. Balest,8 B. H. Behrens,8 W. T. Ford,8 H. Park,8 J. Roy,8 J. G. Smith,8 J. P. Alexander,9 R. Baker,9 C. Bebek,9 B. E. Berger,9 K. Berkelman,9 K. Bloom,9 V. Boisvert,9 D. G. Cassel,9 D. S. Crowcroft,9 M. Dickson,9 S. von Dombrowski,9 P. S. Drell,9 K. M. Ecklund,9 R. Ehrlich,9 A. D. Foland,9 P. Gaidarev,9 L. Gibbons,9 B. Gittelman,9 S. W. Gray,9 D. L. Hartill,9 B. K. Heltsley,9 P. I. Hopman,9 J. Kandaswamy,9 P. C. Kim,9 D. L. Kreinick,9 T. Lee,9 Y. Liu,9 N. B. Mistry,9 C. R. Ng,9 E. Nordberg,9 M. Ogg,9,†††Permanent address: University of Texas, Austin TX 78712 J. R. Patterson,9 D. Peterson,9 D. Riley,9 A. Soffer,9 B. Valant-Spaight,9 C. Ward,9 M. Athanas,10 P. Avery,10 C. D. Jones,10 M. Lohner,10 S. Patton,10 C. Prescott,10 J. Yelton,10 J. Zheng,10 G. Brandenburg,11 R. A. Briere,11 A. Ershov,11 Y. S. Gao,11 D. Y.-J. Kim,11 R. Wilson,11 H. Yamamoto,11 T. E. Browder,12 Y. Li,12 J. L. Rodriguez,12 T. Bergfeld,13 B. I. Eisenstein,13 J. Ernst,13 G. E. Gladding,13 G. D. Gollin,13 R. M. Hans,13 E. Johnson,13 I. Karliner,13 M. A. Marsh,13 M. Palmer,13 M. Selen,13 J. J. Thaler,13 K. W. Edwards,14 A. Bellerive,15 R. Janicek,15 D. B. MacFarlane,15 P. M. Patel,15 A. J. Sadoff,16 R. Ammar,17 P. Baringer,17 A. Bean,17 D. Besson,17 D. Coppage,17 C. Darling,17 R. Davis,17 S. Kotov,17 I. Kravchenko,17 N. Kwak,17 L. Zhou,17 S. Anderson,18 Y. Kubota,18 S. J. Lee,18 J. J. O’Neill,18 R. Poling,18 T. Riehle,18 A. Smith,18 M. S. Alam,19 S. B. Athar,19 Z. Ling,19 A. H. Mahmood,19 S. Timm,19 F. Wappler,19 A. Anastassov,20 J. E. Duboscq,20 D. Fujino,20,‡‡‡Permanent address: Lawrence Livermore National Laboratory, Livermore, CA 94551. K. K. Gan,20 T. Hart,20 K. Honscheid,20 H. Kagan,20 R. Kass,20 J. Lee,20 M. B. Spencer,20 M. Sung,20 A. Undrus,20,§§§Permanent address: BINP, RU-630090 Novosibirsk, Russia. R. Wanke,20 A. Wolf,20 M. M. Zoeller,20 B. Nemati,21 S. J. Richichi,21 W. R. Ross,21 H. Severini,21 P. Skubic,21 M. Bishai,22 J. Fast,22 J. W. Hinson,22 N. Menon,22 D. H. Miller,22 E. I. Shibata,22 I. P. J. Shipsey,22 M. Yurko,22 S. Glenn,23 S. D. Johnson,23 Y. Kwon,23,¶¶¶Permanent address: Yonsei University, Seoul 120-749, Korea. S. Roberts,23 E. H. Thorndike,23 C. P. Jessop,24 K. Lingel,24 H. Marsiske,24 M. L. Perl,24 V. Savinov,24 D. Ugolini,24 R. Wang,24 X. Zhou,24 T. E. Coan,25 V. Fadeyev,25 I. Korolkov,25 Y. Maravin,25 I. Narsky,25 V. Shelkov,25 J. Staeck,25 R. Stroynowski,25 I. Volobouev,25 and J. Ye25
1Syracuse University, Syracuse, New York 13244
2Vanderbilt University, Nashville, Tennessee 37235
3Virginia Polytechnic Institute and State University, Blacksburg, Virginia 24061
4Wayne State University, Detroit, Michigan 48202
5California Institute of Technology, Pasadena, California 91125
6University of California, San Diego, La Jolla, California 92093
7University of California, Santa Barbara, California 93106
8University of Colorado, Boulder, Colorado 80309-0390
9Cornell University, Ithaca, New York 14853
10University of Florida, Gainesville, Florida 32611
11Harvard University, Cambridge, Massachusetts 02138
12University of Hawaii at Manoa, Honolulu, Hawaii 96822
13University of Illinois, Urbana-Champaign, Illinois 61801
14Carleton University, Ottawa, Ontario, Canada K1S 5B6
and the Institute of Particle Physics, Canada
15McGill University, Montréal, Québec, Canada H3A 2T8
and the Institute of Particle Physics, Canada
16Ithaca College, Ithaca, New York 14850
17University of Kansas, Lawrence, Kansas 66045
18University of Minnesota, Minneapolis, Minnesota 55455
19State University of New York at Albany, Albany, New York 12222
20Ohio State University, Columbus, Ohio 43210
21University of Oklahoma, Norman, Oklahoma 73019
22Purdue University, West Lafayette, Indiana 47907
23University of Rochester, Rochester, New York 14627
24Stanford Linear Accelerator Center, Stanford University, Stanford, California 94309
25Southern Methodist University, Dallas, Texas 75275
As most of the published branching fractions of , and mesons are normalized to the [1] decay mode, then the value of directly affects many topics in heavy flavor physics. Some examples include charm counting in meson decays where about 90% of the total charm yield is calibrated by [2], the determination of , and the investigation of any exclusive decay mode of the meson which contains , or in the final state.
In order to measure the absolute branching fraction for decay, one needs to find the number of ’s without reconstructing a particular decay mode. In this Letter we present a measurement of the absolute branching fraction, developing the method first used by the ARGUS Collaboration [3]. The inclusive number of ’s is determined by partial reconstruction of the decay chain , , where only the lepton and the slow pion from the , hereafter denoted as , are detected. The systematic errors involved are largely different from those of other recent measurements [4, 5, 6], where slow pions within jets were used to tag the decay .
We have used 3.1 of data collected on the resonance by the CLEO II detector [7]. The data set corresponds to events. In order to suppress non- (continuum) background we required the ratio of the Fox-Wolfram moments [8] to be less than 0.4. The remaining contribution from continuum events was estimated using 1.6 of data collected just below the threshold. In the following this continuum subtraction is implicit.
We required lepton candidates to have a momentum between 1.4 GeV/ and 2.5 GeV/ and to be in the barrel region of the detector. Muon candidates were required to penetrate an iron absorber to a depth of at least 5 nuclear interaction lengths. Electrons were identified through a comparison of the energy deposited in the electromagnetic calorimeter with the momentum measured in the drift chambers and by specific ionization energy loss (dE/dx) measurements. We required that the candidate have a momentum lower than 190 MeV/, which is slightly below the upper kinematic limit for pions from in decays.
The partial reconstruction of the decay exploits the extremely low energy release in the decay . The pion is almost at rest in the frame, and its velocity vector in the lab frame is approximately equal to that of the . Our main signal mode is , for which the missing mass squared is calculated as
| (1) |
The energy of the meson is precisely the beam energy. We do not know the direction of motion of the , but the momentum is sufficiently small ( 300 MeV/) compared to the typical values of and that we can set . We approximated the direction of motion of the by the direction of motion of the . If the were exactly at rest in the frame, the energy would be given by . In order to correct for the non-zero momentum of the in the frame, we used a parameterization obtained from Monte Carlo to estimate as a function the momentum [9].
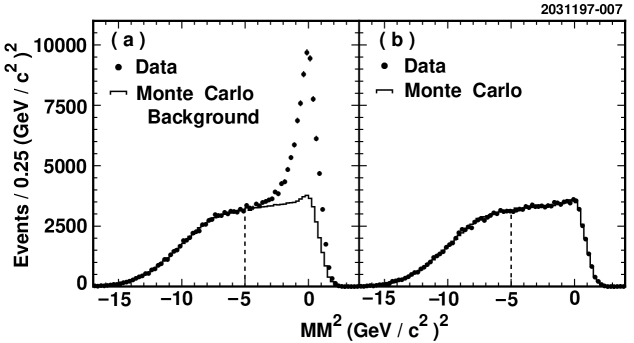
The resulting distribution is shown in Figure 1(a). The events with the lepton and slow pion coming from , produce a prominent peak at . However, the decays , also contribute to this peak. We have considered these decay modes to be signal because they produce true . More specifically, we allowed the to come from decays, where may or may not form a resonance. We also allowed the lepton to come from in the decays or from in the decays , where represents , or . Our analysis is therefore not dependent on the branching fractions assumed in the Monte Carlo for the poorly measured and decays, because these decays were considered to be signal.
A Monte-Carlo simulation of the events was used to determine the background shape. We normalized the background shape to the data distribution in the sideband region ( GeV). After the background subtraction, the number of events in the signal region (defined as GeV ) was found to be . In this way we have extracted the number of events in which .
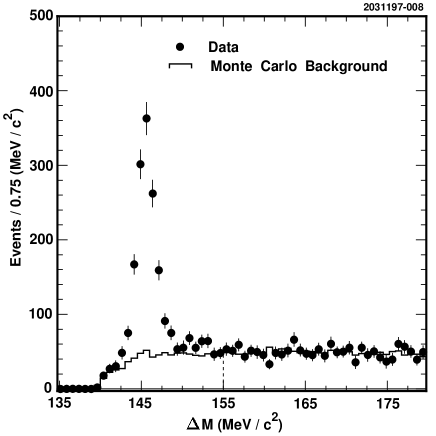
We have thus obtained a sample of decays without reconstructing a particular decay mode. Next we need to determine how many ’s from these events decay to . For every pair for which the value of was within the signal region ( GeV) we searched for a pair, assigning the kaon mass to the track of the opposite charge with respect to , and requiring MeV, which corresponds to a cut. The pair was combined with the and the mass difference was formed. The resulting distribution is shown in Figure 2. The prominent peak at MeV is produced by , decays. We normalized the background shape obtained from the Monte-Carlo simulation to the data distribution in the sideband region (155 MeV180 MeV). True , decays where the does not come from a signal decay chain were considered to be background. After the background subtraction we counted the number of events in the signal region, defined as 141.50 MeV149.75 MeV. The number of decays with , denoted as , was found to be .
To extract we need to correct the ratio for the track reconstruction and acceptance efficiencies :
| (2) |
We obtained using a GEANT-based Monte-Carlo simulation [10] of the CLEO II detector. To a good approximation the lepton and slow pion reconstruction efficiencies cancel in the ratio when we calculate . Therefore mainly includes reconstruction and selection efficiencies for and tracks and acceptance efficiencies for the and signal regions. However, the cancellation of the lepton and slow pion reconstruction efficiencies is not exact because the average charged track multiplicity for decays is higher than that for mode and it is more difficult to reconstruct a track in a higher multiplicity environment. We found that this effect changes by of itself. In order to take this into account, we calculated by selecting signal events from the Monte-Carlo simulation of events, and comparing the value of to the branching ratio that was used in the Monte Carlo. Note that in this procedure corresponds to the number of , events where ’s were allowed to decay generically, not forced to decay into . We obtained , and using this value of together with Eqn. 2, we found
The total systematic error was obtained by summing in quadrature the errors given in Table I. We will now discuss the systematic uncertainties dividing the possible sources into three categories: (i) determination of using the distribution, (ii) determination of using the distribution, (iii) efficiency extraction from Monte Carlo.
(i) First, to see how well the Monte Carlo can simulate the background shape for the distribution, we looked at the distribution for the wrong-sign (i.e. same sign) pairs (Figure 1(b) ). We normalized the Monte-Carlo shape to data distribution in the sideband region ( GeV), as we did for the right-sign pairs, and compared the Monte-Carlo prediction with data in the signal region ( GeV). We found excellent agreement within the statistical precision of 0.8% of the signal region population. We include this 0.8% as a part of the systematic error. This result is encouraging, but different physics can contribute to the distributions for wrong-sign and right-sign background pairs. Using Monte Carlo, we performed a thorough study comparing the distributions for the various physical processes producing the wrong-sign or the right-sign background pairs.
We have found that the most dangerous source of background which peaks in the signal region of distribution is the decay chain , , where the is moving slowly in the rest frame and mimics the pion from decay. These decays do not contribute to the peak and thus can reduce the measured branching fraction. To estimate the systematic error due to this background we identified three such low -value decay modes in our Monte Carlo: , , and . Monte Carlo predicts that the events with the pion coming from one of these modes account for of the events under the peak with respect to the number of events in the signal peak. We have exploited the difference in the distribution shapes for this background and the signal and fit the whole data distribution with three histograms obtained from Monte Carlo: signal, the contribution from the decay chain where , and the rest of background. The fit showed that the contribution from these modes is consistent with the Monte-Carlo prediction. However we should keep in mind that the decay modes we are considering here are poorly measured and that there could be other similar low -value decays that have not yet been observed. In order to be conservative, we varied the contribution from , in the Monte-Carlo background shape by the fit error and obtained a variation in final result, which we took as the systematic error due to this background. This is the largest single source of systematic uncertainty in the analysis.
Another source of background which peaks in the signal region of the distribution results when the slow pion from a signal decay chain decays in flight to a muon, and we identify this muon as the slow pion. Monte Carlo predicts the magnitude of background from this source in the peak region to be of the signal. Even though this is the largest source of background which peaks in the signal region it does not significantly bias the measurement because this background produces smeared peaks in the signal regions of both the and the distributions. We varied the Monte-Carlo prediction for this background by 30% of itself and obtained variation in final result, which we took as the systematic error.
Another background which peaks in the signal region results when we identify as a a positron from or conversion in the decay chain , , . Monte Carlo predicts the magnitude of background from this source in the peak region to be of the signal. We varied the Monte Carlo prediction for this background by 30% of itself and obtained variation in final result, which we took as the systematic error.
Combining the errors described above in (i) we estimated the systematic error due to background subtraction in the the distribution to be 2.5%. We have also studied the possible systematic errors due to the cut on slow pion momentum, fitting and yield determination in distribution, and fake leptons. The results of these studies are given in Table I.
(ii) We have studied the systematic error due to the background subtraction in the distribution. We included true , decays where the does not come from a signal decay chain in the definition of background. The main source of this background is pairs for which the comes from one , and the lepton is the primary lepton from another . This background is suppressed because it occurs only due to mixing. A less significant source is pairs for which the comes from one or and the lepton is a secondary lepton from the from the other or . This background is suppressed by the lepton momentum requirement which predominantly selects primary leptons from decays. Neither of these background components contribute to the peak at because the lepton and slow pion come from different ’s. We varied the Monte Carlo prediction for these backgrounds by 20% (based on the conservative estimate of the uncertainties in the inclusive and lepton yields, the mixing parameter, and the dependence of distribution shape on the momentum spectrum), and obtained variation in final result, which we took as the systematic error.
The rest of the background in the distribution is combinatoric. To estimate the systematic error due to the Monte Carlo simulation of this background we substituted the combinatoric part of the Monte Carlo background shape by an analytic threshold function and obtained the 0.9% shift in the final result, which we took as the systematic error.
Combining the errors described above in (ii) we estimated the systematic error due to background subtraction in the the distribution to be 1.1%. We have also studied the possible systematic error due to the fitting and yield determination in the distribution, and the result of this study is given in Table I.
(iii) A study has been performed to estimate the systematic error due to the extraction of the reconstruction efficiency for and tracks from Monte Carlo. We assigned a 2% error to the final result (1% per track). As was mentioned earlier, the lepton and slow pion reconstruction efficiencies do not cancel out exactly due to the difference in charged multiplicity between the cases and . To estimate the systematic error due to this effect we extracted the efficiency from Monte Carlo forcing when we determine . As a systematic error we took 30% of the shift in the efficiency obtained using this method and the method actually employed in the analysis. We have also studied the possible systematic error due to the choice of the signal region in the distribution, and the result of this study is given in Table I.
The systematic errors due to the limited Monte Carlo statistics and the continuum subtraction are also given in Table I.
| Quantity | Possible source of systematic error | Estimate of Error |
| (% of final result) | ||
| Background subtraction in distribution | ||
| Slow pion momentum cut (affects background shape) | ||
| Fitting and yield determination | ||
| Fake leptons | ||
| Background subtraction in distribution | ||
| Fitting and yield determination | ||
| reconstruction efficiency | ||
| Choice of signal region in distribution | ||
| Non-exact cancellation of and reconstruction efficiencies | ||
| Monte Carlo statistics | ||
| Continuum subtraction | ||
| Total |
In conclusion, we have measured the absolute branching fraction for decay using a tag. We have found [11]. Our result is consistent with a recent measurement by ALEPH of [4], ***We took the value before correction for the final state radiation from the and daughters in the decay. two measurements by ARGUS of [5] and of [3], and two measurements by CLEO of [6] and of [12]. Taking into account correlations, we combined our result with the other two CLEO measurements and found a new CLEO average value for to be .
We gratefully acknowledge the effort of the CESR staff in providing us with excellent luminosity and running conditions. This work was supported by the National Science Foundation, the U.S. Department of Energy, the Heisenberg Foundation, the Alexander von Humboldt Stiftung, Research Corporation, the Natural Sciences and Engineering Research Council of Canada, the A.P. Sloan Foundation, and the Swiss National Science Foundation.
REFERENCES
- [1] Charge conjugate modes are implied throughout this Letter unless otherwise stated. can be either or .
- [2] L. Gibbons et al. (CLEO Collaboration), Phys. Rev. D56, 3783 (1997).
- [3] H. Albrecht et al. (ARGUS Collaboration), Phys. Lett. B324, 249 (1994).
- [4] R. Barate et al. (ALEPH Collaboration), Phys. Lett. B405, 191 (1997).
- [5] H. Albrecht et al. (ARGUS collaboration), Phys. Lett. B340, 125 (1994).
- [6] D. Akerib et al. (CLEO Collaboration), Phys. Rev. Lett. 71, 3070 (1993).
- [7] Y. Kubota et al. (CLEO Collaboration), Nucl. Instrum. Methods A 320, 66 (1992).
- [8] G. Fox and S. Wolfram, Phys. Rev. Lett. 41, 1581 (1978).
- [9] W. Brower and H. Paar, hep-ex/9710029, submitted to Nucl. Instrum. Methods.
- [10] R. Brun et al., GEANT 3.15, CERN DD/EE/84-1.
- [11] The and daughters in the decay can radiate photons in final state. This radiation results in a radiative tail of the distribution, which we did not include in the calculation of the efficiency. The requirement MeV implies the effective cut on energy in the rest frame of MeV. Therefore our result corresponds to the value of with the effective cut on energy in the rest frame of MeV. We compare our measurement with several other measurements which have the resolution comparable to our resolution, 10 MeV.
- [12] T. E. Coan et al. (CLEO Collaboration), CLEO 97-24 (CLNS 97/1516), submitted to Phys. Rev. Lett.