Flavor-Specific Inclusive Decays to Charm
Abstract
We have measured the branching fractions for , , and , where “” is an average over and , “” is a sum over and , and “” is a sum over and . From these results and some previously measured branching fractions, we obtain = (21.9 3.7)%, 6.8% @ 90% c.l, and = (3.69 0.20)%. Implications for the “ semileptonic decay problem” (measured branching fraction being below theoretical expectations) are discussed. The increase in the value of due to eliminates 40% of the discrepancy.
pacs:
PACS numbers: 13.25Hw, 14.40.NdT. E. Coan,1 V. Fadeyev,1 I. Korolkov,1 Y. Maravin,1 I. Narsky,1 V. Shelkov,1 J. Staeck,1 R. Stroynowski,1 I. Volobouev,1 J. Ye,1 M. Artuso,2 F. Azfar,2 A. Efimov,2 M. Goldberg,2 D. He,2 S. Kopp,2 G. C. Moneti,2 R. Mountain,2 S. Schuh,2 T. Skwarnicki,2 S. Stone,2 G. Viehhauser,2 X. Xing,2 J. Bartelt,3 S. E. Csorna,3 V. Jain,3,***Permanent address: Brookhaven National Laboratory, Upton, NY 11973. K. W. McLean,3 S. Marka,3 R. Godang,4 K. Kinoshita,4 I. C. Lai,4 P. Pomianowski,4 S. Schrenk,4 G. Bonvicini,5 D. Cinabro,5 R. Greene,5 L. P. Perera,5 G. J. Zhou,5 B. Barish,6 M. Chadha,6 S. Chan,6 G. Eigen,6 J. S. Miller,6 C. O’Grady,6 M. Schmidtler,6 J. Urheim,6 A. J. Weinstein,6 F. Würthwein,6 D. W. Bliss,7 G. Masek,7 H. P. Paar,7 S. Prell,7 V. Sharma,7 D. M. Asner,8 J. Gronberg,8 T. S. Hill,8 D. J. Lange,8 R. J. Morrison,8 H. N. Nelson,8 T. K. Nelson,8 J. D. Richman,8 D. Roberts,8 A. Ryd,8 M. S. Witherell,8 R. Balest,9 B. H. Behrens,9 W. T. Ford,9 H. Park,9 J. Roy,9 J. G. Smith,9 J. P. Alexander,10 C. Bebek,10 B. E. Berger,10 K. Berkelman,10 K. Bloom,10 V. Boisvert,10 D. G. Cassel,10 H. A. Cho,10 D. S. Crowcroft,10 M. Dickson,10 S. von Dombrowski,10 P. S. Drell,10 K. M. Ecklund,10 R. Ehrlich,10 A. D. Foland,10 P. Gaidarev,10 L. Gibbons,10 B. Gittelman,10 S. W. Gray,10 D. L. Hartill,10 B. K. Heltsley,10 P. I. Hopman,10 J. Kandaswamy,10 P. C. Kim,10 D. L. Kreinick,10 T. Lee,10 Y. Liu,10 N. B. Mistry,10 C. R. Ng,10 E. Nordberg,10 M. Ogg,10,†††Permanent address: University of Texas, Austin TX 78712 J. R. Patterson,10 D. Peterson,10 D. Riley,10 A. Soffer,10 B. Valant-Spaight,10 C. Ward,10 M. Athanas,11 P. Avery,11 C. D. Jones,11 M. Lohner,11 C. Prescott,11 J. Yelton,11 J. Zheng,11 G. Brandenburg,12 R. A. Briere,12 A. Ershov,12 Y. S. Gao,12 D. Y.-J. Kim,12 R. Wilson,12 H. Yamamoto,12 T. E. Browder,13 Y. Li,13 J. L. Rodriguez,13 T. Bergfeld,14 B. I. Eisenstein,14 J. Ernst,14 G. E. Gladding,14 G. D. Gollin,14 R. M. Hans,14 E. Johnson,14 I. Karliner,14 M. A. Marsh,14 M. Palmer,14 M. Selen,14 J. J. Thaler,14 K. W. Edwards,15 A. Bellerive,16 R. Janicek,16 D. B. MacFarlane,16 P. M. Patel,16 A. J. Sadoff,17 R. Ammar,18 P. Baringer,18 A. Bean,18 D. Besson,18 D. Coppage,18 C. Darling,18 R. Davis,18 S. Kotov,18 I. Kravchenko,18 N. Kwak,18 L. Zhou,18 S. Anderson,19 Y. Kubota,19 S. J. Lee,19 J. J. O’Neill,19 S. Patton,19 R. Poling,19 T. Riehle,19 A. Smith,19 M. S. Alam,20 S. B. Athar,20 Z. Ling,20 A. H. Mahmood,20 H. Severini,20 S. Timm,20 F. Wappler,20 A. Anastassov,21 J. E. Duboscq,21 D. Fujino,21,‡‡‡Permanent address: Lawrence Livermore National Laboratory, Livermore, CA 94551. K. K. Gan,21 T. Hart,21 K. Honscheid,21 H. Kagan,21 R. Kass,21 J. Lee,21 M. B. Spencer,21 M. Sung,21 A. Undrus,21,§§§Permanent address: BINP, RU-630090 Novosibirsk, Russia. R. Wanke,21 A. Wolf,21 M. M. Zoeller,21 B. Nemati,22 S. J. Richichi,22 W. R. Ross,22 P. Skubic,22 M. Bishai,23 J. Fast,23 J. W. Hinson,23 N. Menon,23 D. H. Miller,23 E. I. Shibata,23 I. P. J. Shipsey,23 M. Yurko,23 S. Glenn,24 S. D. Johnson,24 Y. Kwon,24,¶¶¶Permanent address: Yonsei University, Seoul 120-749, Korea. S. Roberts,24 E. H. Thorndike,24 C. P. Jessop,25 K. Lingel,25 H. Marsiske,25 M. L. Perl,25 V. Savinov,25 D. Ugolini,25 R. Wang,25 and X. Zhou25
1Southern Methodist University, Dallas, Texas 75275
2Syracuse University, Syracuse, New York 13244
3Vanderbilt University, Nashville, Tennessee 37235
4Virginia Polytechnic Institute and State University, Blacksburg, Virginia 24061
5Wayne State University, Detroit, Michigan 48202
6California Institute of Technology, Pasadena, California 91125
7University of California, San Diego, La Jolla, California 92093
8University of California, Santa Barbara, California 93106
9University of Colorado, Boulder, Colorado 80309-0390
10Cornell University, Ithaca, New York 14853
11University of Florida, Gainesville, Florida 32611
12Harvard University, Cambridge, Massachusetts 02138
13University of Hawaii at Manoa, Honolulu, Hawaii 96822
14University of Illinois, Urbana-Champaign, Illinois 61801
15Carleton University, Ottawa, Ontario, Canada K1S 5B6
and the Institute of Particle Physics, Canada
16McGill University, Montréal, Québec, Canada H3A 2T8
and the Institute of Particle Physics, Canada
17Ithaca College, Ithaca, New York 14850
18University of Kansas, Lawrence, Kansas 66045
19University of Minnesota, Minneapolis, Minnesota 55455
20State University of New York at Albany, Albany, New York 12222
21Ohio State University, Columbus, Ohio 43210
22University of Oklahoma, Norman, Oklahoma 73019
23Purdue University, West Lafayette, Indiana 47907
24University of Rochester, Rochester, New York 14627
25Stanford Linear Accelerator Center, Stanford University, Stanford, California 94309
I Introduction
There has been a longstanding problem in heavy flavor physics of the measured semileptonic decay branching fraction[1] being smaller than theoretical expectations[2, 3]. One possible explanation[2] is a larger-than-expected flavor-changing neutral current (FCNC) contribution, due to new physics. Another[3] is an enhanced rate for ( denotes the weak isospin partner of ). An argument against an enhanced rate is that it would conflict with the measured branching fraction for plus . That measurement relies on a knowledge of , however, and if that is in error, the measurement of the branching fraction of to charm or anticharm will be also. We address all three issues by measuring the yields of the flavor-specific inclusive decay processes , , and in a sample of events in which at least one decays semileptonically. (Herein, “” represents an average over and , “” a sum over and , and “” a sum over and [4]. We use the term “upper vertex ” for a produced from the charm quark from , and “lower vertex ” for a produced from the charm quark from .)
These yields, and ratios among them, provide information on the above-mentioned issues as follows:
(i) The fraction of semileptonic decays that proceed through , , differs from 100% only because of small contributions from and (“lower vertex ”). The measured fraction is inversely proportional to the assumed absolute branching fraction (in our case ) and scaling the yield to agree with expectations gives a new method to measure that branching fraction.
(ii) The fraction of all decays that proceed through , , differs from 100% because of decays, lower vertex , formation of bound states, formation of charmed baryons, and FCNC processes such as , , , (which we will refer to collectively as “”). As all processes except have been measured, the ratio provides a measurement of the branching fraction for . By taking the ratio of to , rather than just using , we eliminate dependence on the branching ratio, and reduce dependence on detection efficiency.
(iii) The process proceeds via the the quark-level process , and thus the ratio of the yields for and , i.e., ratio of upper to lower vertex charm, provides information on the rate of that process relative to .
The typical inclusive decay branching fraction measurement averages over and initial states for a given final state, and consequently averages over particle and antiparticle final states for a given initial state ( or ), losing the flavor-specific information sought here. In 1987 CLEO developed a technique for measuring inclusive decay branching fractions separately to particle and antiparticle final states, and applied it to inclusive kaon decays[5, 6]. Here we apply similar techniques to inclusive charm decays.
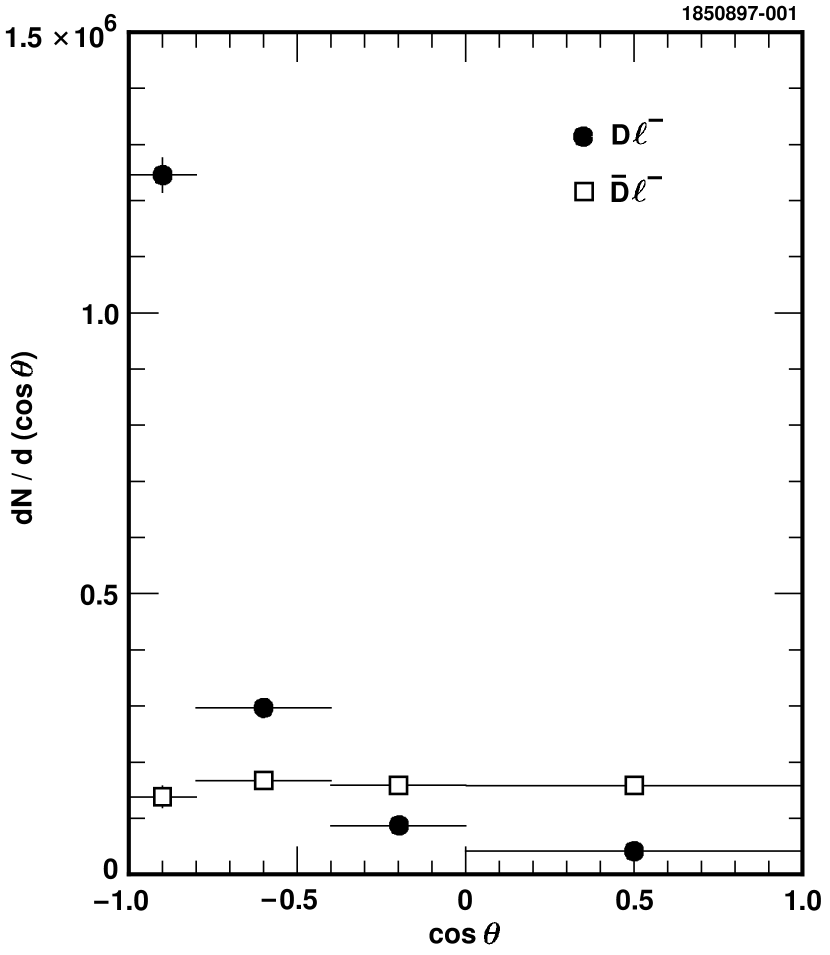
The principle underlying the 1987 technique is that if one from a pair from the (4S) decays semileptonically, with a high momentum lepton, then the other decay products from that will have substantial angular correlations with the lepton, tending to come off back-to-back to it, while the decay products from the other have negligible angular correlations with the lepton. The lepton tags the flavor of its parent , and thus also the other (with a correction needed for mixing). By plotting the distribution in the angle between (and ) pairs, and separately the distribution in the angle between (and ) pairs, and extracting an isotropic component and a peaking component from each, yields are obtained for four processes: , , , and . Of these, should be zero.
For low momenta, the technique just described loses statistical power and becomes sensitive to the shape assumed in fitting for the peaking component. (In the limit that the momentum vanishes, the –lepton angular correlation clearly contains no information.) Consequently, we have developed a second technique, based on charge correlations alone. We measure three yields: the number of (and ) pairs, equal to the sum of and yields in the lepton-tagged data sample; the number of (and ) pairs, equal to the sum of and yields in the lepton-tagged sample; and the number of (and ) mesons in an untagged sample, equal to the sum of and yields in the untagged sample. Using the fact that the rate for vanishes, and scaling the last-mentioned yield by the ratio of the sizes of the tagged and untagged data samples, these yields give the yields for the other three processes: , , and . Using a combination of the angular correlation and charge correlation techniques, we have obtained those three yields for the sum of and mesons.
II Procedures
The data were taken with the CLEO detector[7] at the Cornell Electron Storage Ring (CESR), and consist of 3.2 fb-1 on the (4S) resonance and 1.6 fb-1 at a center-of-mass energy 60 MeV below the resonance. The on-resonance sample contains 3.3 million events and 10 million continuum events. The CLEO detector measures charged particles over 95% of steradians with a system of cylindrical drift chambers. Its barrel and endcap CsI electromagnetic calorimeters cover 98% of . Hadron identification is provided by specific ionization () measurements in the outermost drift chamber and by time-of-flight counters (ToF). Muons are identified by their ability to penetrate iron; electrons by , comparison of track momentum with calorimeter cluster energy, and track/cluster position matching.
We select hadronic events containing at least 4 charged tracks. We require a value of the ratio of Fox-Wolfram parameters[8] , to suppress continuum events. Events containing at least one lepton with momentum between 1.5 and 2.8 GeV/c and surviving a veto are scanned for , , and charge conjugates. (For the untagged sample, we drop the lepton requirement.) We detect and via the and decay mode, respectively. Tracks used as candidate decay products must have and/or ToF values within of expectations for the particle assignment made ( or ). For , particle identification must rule out the option.
For candidate ’s, we histogram the () mass for four intervals in and four intervals in momentum, separately for the two charge correlations with the lepton. These 64 mass distributions are fit to double-Gaussian signal peaks and polynomial backgrounds, to extract yields. These are corrected for detection efficiency, determined by Monte Carlo simulation augmented by studies of particle ID efficiency that use data (a sample of events). We perform small subtractions for continuum background (using below-(4S)-resonance data) and for hadrons misidentified as leptons (using hadrons in place of leptons and weighting by the “faking probability”). Small corrections are made to the yields for the singly-Cabibbo-suppressed decays and which combine with a single failure of particle ID to make satellite peaks, for the doubly-Cabibbo-suppressed decay [9], and for double failures of particle ID, with treated as . A small correction is made to yields for the decay with the misidentified as a .
The yields for each momentum interval, charge correlation, and type, are histogrammed vs. , 16 distributions in all. For the high momentum intervals 1.3 – 1.95 and 1.95 –2.6 GeV/c, we fit the angular distributions to an isotropic component and a backward-peaking component, with fitting functions obtained from Monte Carlo simulation. We fit the angular distributions to an isotropic component alone. For the low momentum intervals 0.0 – 0.65 and 0.65 – 1.3 GeV/c, we use the charge correlation technique, summing over . We sum the yields so obtained over momentum intervals, and over charged and neutral ’s, correcting for and branching fractions, using = 3.91%[10], and = 2.35[11]. We obtain yields for and lepton from the same , and from different ’s, as follows. , different ’s), and different ’s), in a sample containing leptons. For illustrative purposes, we show distributions summed over momentum intervals and over and , as Fig. 1. The distribution shows strong back-to-back peaking from , while the shows no such peaking, due to the nonexistence of . One also notes a much larger isotropic component in , because of the large rate for and a small rate for (and a small rate for mixing ).
If the lepton and come from the same , then the lepton tags that correctly. The lepton can’t be from decay of , because the was detected via a hadronic decay mode. It can’t be from , because the rate for is negligible. If there are two ’s from the same , leptons from either will be below our 1.5 GeV/c momentum cut. If the has mixed, nonetheless the lepton correctly tags the flavor at the instant of decay, which is what is relevant for understanding the from the same . But, if the lepton and come from different ’s, then the tagging of both ’s is now imperfect: the ancestor of the lepton because leptons from charm decay and leptons from now contribute; and the ancestor of the for those reasons and in addition because of mixing. Corrections are thus required when using the yields involving lepton and from different ’s. These corrections depend on (the probability that a lepton mistags its ancestor ), and (the mixing parameter).
III Results and Interpretation
We extract three distinct pieces of physics from the three yields given above. For each, we have considered systematic errors due to uncertainties in each of the previously-mentioned corrections, uncertainties from fitting mass peaks and distributions, and uncertainties in efficiency and branching fractions.
(i) First consider , the ratio of “upper vertex” charm to “lower vertex” charm. This ratio is obtained from different ’s different ’s, by correcting for mixing and mistags. , where , and . We use = 0.157 as measured by CLEO with dileptons[12], and as found there, thereby achieving cancellation of some systematic errors in , giving . From the yields given above, , leading to
| (1) |
where the first error is statistical and the second is systematic, dominated by the uncertainties in mixing correction( 0.012) and the fitting function ( 0.008). This result is surprisingly large, as conventional wisdom held that would hadronize dominantly into . However, Buchalla et al.[3] have argued that the , component should be substantial.
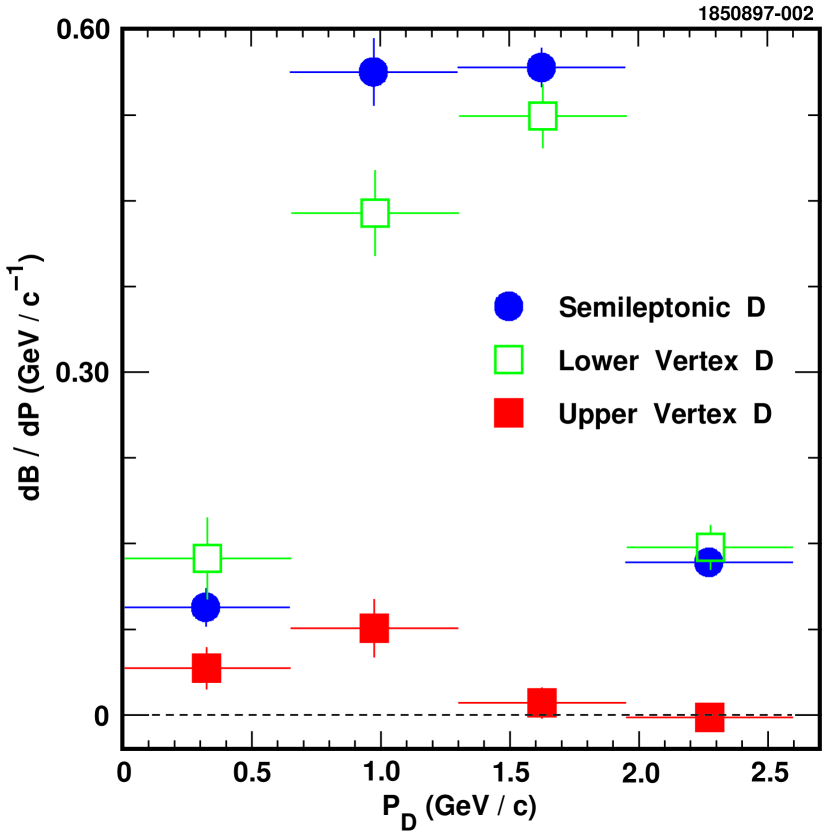
In Fig. 2 we plot the momentum distribution of these “upper vertex” , , obtained by applying the analysis just described to each of the four momentum bins. The spectrum is softer than that for “lower vertex” ’s, also shown. It is well described by 3-body phase space, if one allows one or two of the particles to be the vector states. CLEO has observed such decay modes[13].
(ii) Next consider the fraction of all decays to , , divided by the fraction of semileptonic decays to , , i.e., the double-ratio of widths . We obtain this from the ratio of yields different ’s. Corrections are required to the “different ’s” yield for mixing and mistags. Also, leptons from unvetoed and from secondary decays (3.3 0.7% of all leptons) don’t contribute to the peaking yield, and so a correction is required for that, leading to , where , as found above. Applying all corrections, we have
| (2) |
One expects both and to be close to 1.0. The first ratio will be less than 1.0 because of transitions (, where the 2 is a phase space factor), lower vertex (2%), bound states (3.0 0.5%[14]), baryons (6.5 1.5%[15]), and (to be extracted). The second ratio will be less than 1.0 because of transitions (, enhanced by the 1.5 GeV/c lepton momentum requirement), and lower vertex (1.0 0.5%, suppressed by the lepton momentum requirement). These lead to
| (3) |
Here is symbolic for all FCNC processes. Using , we obtain %, where the first error is statistical, the second systematic on , and the third the uncertainties in Expression (3). From this we obtain an upper limit %, @ 90% C.L. The dominant components of the systematic error on are from mixing (1.2%) and unvetoed and secondary leptons ( 0.6%).
(iii) Finally consider the fraction of semileptonic decays to or , i.e., . We obtain this fraction by dividing the yield by the number of leptons from semileptonic decay, 96.7% of the total of leptons in our sample. We find . This number is inversely proportional to the value used for . The expected value of the ratio of widths is . Taking , we find the expected ratio of widths to be 0.968 0.010, differing from the measured value by one standard deviation. We set measured and expected values of the ratio equal to each other, and solve for the branching fraction, finding , where the first error is statistical, the second systematic in the measured ratio, and the third systematic in the predicted ratio. The dominant systematic errors are from uncertainties in detection efficiency ( 0.10%), mass peak fitting ( 0.09%), and the ratio of to branching ratios ( 0.08%). This value for the branching fraction, (3.69 0.20)%, is to be compared with recent measurements by CLEO of (3.91 0.19)%[10] and (3.81 0.22)%[16], by ALEPH of (3.90 0.15)%[17] and the PDG value of (3.83 0.12)%[18].
IV The Semileptonic Decay Branching Fraction Problem
In Table I we list all the components of decay, give their branching fractions (based on measurement or theory), and see if they sum to 100%. We express some in terms of , the semileptonic decay branching fraction, for which we use[1] (10.49 0.46)%. The factor of 0.25 for is a phase space factor. The factor for would be 3 from color counting, but with QCD corrections[19] is 4.0 0.4. This analysis has two pieces of information to add to Table I. First, the upper vertex contribution of (7.9 2.2)% is obtained from our measured value of combined with the rate for inclusive (63.6% + 23.5%)[20], and leads to a branching fraction for of (21.9 3.7)%. Second, we have a value (with large errors) for the FCNC term. One sees that the upper vertex contribution accounts for close to half of the shortfall of the sum of all modes from unity. The remaining shortfall is less than 2 standard deviations. If we adjust to bring the sum to 100%, we find = 5.2 0.6.
V Acknowledgments
We thank Isard Dunietz for many informative conversations. We gratefully acknowledge the effort of the CESR staff in providing us with excellent luminosity and running conditions. This work was supported by the National Science Foundation, the U.S. Department of Energy, the Heisenberg Foundation, the Alexander von Humboldt Stiftung, Research Corporation, the Natural Sciences and Engineering Research Council of Canada, the A.P. Sloan Foundation, the Swiss National Science Foundation, and the Yonsei University faculty research fund.
REFERENCES
- [1] B. Barish et al. (CLEO), “Measurement of the Semileptonic Branching Fraction with Lepton Tags,” Phys. Rev. Lett. 76, 1570 (4 March 1996).
- [2] I. Bigi, B. Blok, M.A. Shifman, and A. Vainshtein, Phys. Lett. B 323, 408 (1994).
- [3] G. Buchalla, I. Dunietz, and H. Yamamoto, “Hadronization of ,” Phys. Lett. B 364, 188(1995).
- [4] Throughout, charge conjugation of all equations is implied, i.e., includes .
- [5] Paul L. Tipton, “Lepton-Kaon Correlations in -Meson Decay,” Ph.D. thesis, University of Rochester (1987).
- [6] M.S. Alam et al. (CLEO), “Branching Ratios of Mesons to , , and ,” Phys. Rev. Lett. 58, 1814 (4 May 1987).
- [7] Y. Kubota et al. (CLEO), Nucl. Instrum. Meth. A 320, 66 (1992).
- [8] G. Fox and S. Wolfram, Phys Rev. Lett. 41, 1581 (1978).
- [9] D. Cinabro et al. (CLEO), “Observation of ,” Phys. Rev. Lett. 72, 1406 (7 March 1994).
- [10] D.S. Akerib et al. (CLEO), “Measurement of the Absolute Branching Fraction for ,” Phys. Rev. Lett. 71, 3070 (8 November 1993).
- [11] R. Balest et al. (CLEO), “Measurement of the Branching Fraction for ,” Phys. Rev. Lett. 72, 2328 (11 April 1994).
- [12] J. Bartelt et al. (CLEO), “Two Measurements of Mixing,” Phys. Rev. Lett. 71, 1680 (13 September 1993).
- [13] CLEO Collaboration CONF 97-26, “Full Reconstruction of Decays at CLEO,” EPS submission EPS 337.
- [14] R. Balest et al. (CLEO), “Inclusive decays of mesons to charmonium,” Phys. Rev. D 52, 2661 (1 September 1995).
- [15] G. Crawford et al. (CLEO),“Measurement of baryon production in -meson decay,” Phys. Rev. D 45, 725 (1 February 1992).
- [16] M. Artuso et al., CLEO Collaboration preprint CLEO 97-24, submitted to Phys. Rev. Lett.
- [17] ALEPH Collaboration, “Measurement of the Branching Fraction for ”, Phys. Lett. B 403, 367 (26 June 1997).
- [18] R. M. Barnett et al. (particle Data Group), Phys. Rev. D 54, 1 (1996).
- [19] E. Bagan, P. Ball, V.M. Braun, and P. Gosdzinsky, Nucl. Phys. B432, 3 (1994).
- [20] L. Gibbons et al. (CLEO), “The Inclusive Decays and ,” Phys. Rev. D 56, 3783 (1997).
| decay modes | Branching fraction (%) | ||
|---|---|---|---|
| 10.5 0.5 | |||
| 10.5 0.5 | |||
| 2.6 0.1 | |||
| 42.0 2.0 4.2 | |||
| 21.9 3.7 | |||
| (10.0 2.7) | |||
| (3.0 0.5) | |||
| baryons | (1.0 0.6) | ||
| upper vertex | (7.9 2.2) | ||
| 0.2 4.1 | |||
| TOTAL | 87.7 7.4 | ||