Search For the Decay
Abstract
We have searched for the decay and measured an upper limit for the inclusive branching fraction of at the 90% confidence level. This limit is small compared with the total expected rate. Assuming factorization, the decay constant is constrained to be MeV at the 90% confidence level, at least 2.5 times smaller than that of .
pacs:
PACS numbers: 13.25.Hw, 14.40.NdM. Bishai,1 J. Fast,1 J. W. Hinson,1 N. Menon,1 D. H. Miller,1 E. I. Shibata,1 I. P. J. Shipsey,1 M. Yurko,1 S. Glenn,2 S. D. Johnson,2 Y. Kwon,2,***Permanent address: Yonsei University, Seoul 120-749, Korea. S. Roberts,2 E. H. Thorndike,2 C. P. Jessop,3 K. Lingel,3 H. Marsiske,3 M. L. Perl,3 V. Savinov,3 D. Ugolini,3 R. Wang,3 X. Zhou,3 T. E. Coan,4 V. Fadeyev,4 I. Korolkov,4 Y. Maravin,4 I. Narsky,4 V. Shelkov,4 J. Staeck,4 R. Stroynowski,4 I. Volobouev,4 J. Ye,4 M. Artuso,5 F. Azfar,5 A. Efimov,5 M. Goldberg,5 D. He,5 S. Kopp,5 G. C. Moneti,5 R. Mountain,5 S. Schuh,5 T. Skwarnicki,5 S. Stone,5 G. Viehhauser,5 X. Xing,5 J. Bartelt,6 S. E. Csorna,6 V. Jain,6,†††Permanent address: Brookhaven National Laboratory, Upton, NY 11973. K. W. McLean,6 S. Marka,6 R. Godang,7 K. Kinoshita,7 I. C. Lai,7 P. Pomianowski,7 S. Schrenk,7 G. Bonvicini,8 D. Cinabro,8 R. Greene,8 L. P. Perera,8 G. J. Zhou,8 B. Barish,9 M. Chadha,9 S. Chan,9 G. Eigen,9 J. S. Miller,9 C. O’Grady,9 M. Schmidtler,9 J. Urheim,9 A. J. Weinstein,9 F. Würthwein,9 D. W. Bliss,10 G. Masek,10 H. P. Paar,10 S. Prell,10 V. Sharma,10 D. M. Asner,11 J. Gronberg,11 T. S. Hill,11 D. J. Lange,11 R. J. Morrison,11 H. N. Nelson,11 T. K. Nelson,11 J. D. Richman,11 D. Roberts,11 A. Ryd,11 M. S. Witherell,11 R. Balest,12 B. H. Behrens,12 W. T. Ford,12 H. Park,12 J. Roy,12 J. G. Smith,12 J. P. Alexander,13 C. Bebek,13 B. E. Berger,13 K. Berkelman,13 K. Bloom,13 V. Boisvert,13 D. G. Cassel,13 H. A. Cho,13 D. S. Crowcroft,13 M. Dickson,13 S. von Dombrowski,13 P. S. Drell,13 K. M. Ecklund,13 R. Ehrlich,13 A. D. Foland,13 P. Gaidarev,13 L. Gibbons,13 B. Gittelman,13 S. W. Gray,13 D. L. Hartill,13 B. K. Heltsley,13 P. I. Hopman,13 J. Kandaswamy,13 P. C. Kim,13 D. L. Kreinick,13 T. Lee,13 Y. Liu,13 N. B. Mistry,13 C. R. Ng,13 E. Nordberg,13 M. Ogg,13,‡‡‡Permanent address: University of Texas, Austin TX 78712 J. R. Patterson,13 D. Peterson,13 D. Riley,13 A. Soffer,13 B. Valant-Spaight,13 C. Ward,13 M. Athanas,14 P. Avery,14 C. D. Jones,14 M. Lohner,14 C. Prescott,14 J. Yelton,14 J. Zheng,14 G. Brandenburg,15 R. A. Briere,15 A. Ershov,15 Y. S. Gao,15 D. Y.-J. Kim,15 R. Wilson,15 H. Yamamoto,15 T. E. Browder,16 Y. Li,16 J. L. Rodriguez,16 T. Bergfeld,17 B. I. Eisenstein,17 J. Ernst,17 G. E. Gladding,17 G. D. Gollin,17 R. M. Hans,17 E. Johnson,17 I. Karliner,17 M. A. Marsh,17 M. Palmer,17 M. Selen,17 J. J. Thaler,17 K. W. Edwards,18 A. Bellerive,19 R. Janicek,19 D. B. MacFarlane,19 P. M. Patel,19 A. J. Sadoff,20 R. Ammar,21 P. Baringer,21 A. Bean,21 D. Besson,21 D. Coppage,21 C. Darling,21 R. Davis,21 S. Kotov,21 I. Kravchenko,21 N. Kwak,21 L. Zhou,21 S. Anderson,22 Y. Kubota,22 S. J. Lee,22 J. J. O’Neill,22 S. Patton,22 R. Poling,22 T. Riehle,22 A. Smith,22 M. S. Alam,23 S. B. Athar,23 Z. Ling,23 A. H. Mahmood,23 H. Severini,23 S. Timm,23 F. Wappler,23 A. Anastassov,24 J. E. Duboscq,24 D. Fujino,24,§§§Permanent address: Lawrence Livermore National Laboratory, Livermore, CA 94551. K. K. Gan,24 T. Hart,24 K. Honscheid,24 H. Kagan,24 R. Kass,24 J. Lee,24 M. B. Spencer,24 M. Sung,24 A. Undrus,24,¶¶¶Permanent address: BINP, RU-630090 Novosibirsk, Russia. R. Wanke,24 A. Wolf,24 M. M. Zoeller,24 B. Nemati,25 S. J. Richichi,25 W. R. Ross,25 and P. Skubic25
1Purdue University, West Lafayette, Indiana 47907
2University of Rochester, Rochester, New York 14627
3Stanford Linear Accelerator Center, Stanford University, Stanford, California 94309
4Southern Methodist University, Dallas, Texas 75275
5Syracuse University, Syracuse, New York 13244
6Vanderbilt University, Nashville, Tennessee 37235
7Virginia Polytechnic Institute and State University, Blacksburg, Virginia 24061
8Wayne State University, Detroit, Michigan 48202
9California Institute of Technology, Pasadena, California 91125
10University of California, San Diego, La Jolla, California 92093
11University of California, Santa Barbara, California 93106
12University of Colorado, Boulder, Colorado 80309-0390
13Cornell University, Ithaca, New York 14853
14University of Florida, Gainesville, Florida 32611
15Harvard University, Cambridge, Massachusetts 02138
16University of Hawaii at Manoa, Honolulu, Hawaii 96822
17University of Illinois, Urbana-Champaign, Illinois 61801
18Carleton University, Ottawa, Ontario, Canada K1S 5B6
and the Institute of Particle Physics, Canada
19McGill University, Montréal, Québec, Canada H3A 2T8
and the Institute of Particle Physics, Canada
20Ithaca College, Ithaca, New York 14850
21University of Kansas, Lawrence, Kansas 66045
22University of Minnesota, Minneapolis, Minnesota 55455
23State University of New York at Albany, Albany, New York 12222
24Ohio State University, Columbus, Ohio 43210
25University of Oklahoma, Norman, Oklahoma 73019
I Introduction
One of the outstanding issues in meson physics is the semileptonic branching fraction puzzle. Experimentally is measured to be ()% [1], whereas theoretical calculations have difficulties accommodating a branching fraction below [2]. One way to reduce the theoretical expectations is through a two-fold enhancement in the assumed rate [3], which is estimated to be from the measured inclusive rates for and .
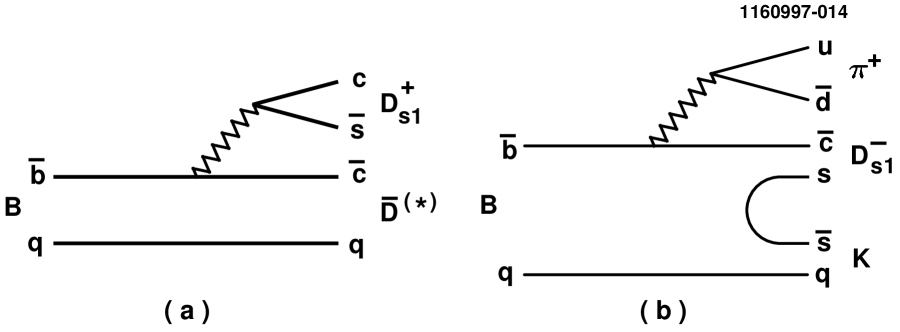
Recently, Buchalla et al.[4] and Blok et al.[5] have suggested that a significant fraction of the transition hadronizes into . This is supported by CLEO’s [6] observation of “wrong-sign” mesons from decays, , where the comes from the virtual . The ALEPH [7] and DELPHI [8] collaborations have also observed sizeable decay rates. Exclusive decays involving wrong-sign mesons can result from (1) resonant decays, where the hadronizes to an excited meson that decays into ; and (2) non-resonant decays. This paper explores one possibility in the first case, namely, the decays where is the narrow P-wave meson with . The “upper-vertex” production of from hadronization is shown in Figure 1(a). In addition, mesons can be produced from “lower-vertex” decays with the creation of an quark pair, as shown in Figure 1(b). This produces right-sign mesons; however, the decay rate is expected to be small. Throughout this paper charge conjugate states are implied.
Continuum production has been thoroughly studied [1]. The is just above the mass threshold and decays dominantly into and . Other possible decay channels are negligible: due to isospin conservation, due to OZI suppression [9], or due to angular momentum and parity conservation, and due to the small radiative decay rate.
II Data Sample and Event Selection
The data used in this analysis were selected from hadronic events collected by the CLEO II detector at the Cornell Electron Storage Ring (CESR). The CLEO II detector [10] is a large solenoidal detector with 67 tracking layers and a CsI electromagnetic calorimeter that provides efficient reconstruction. The data consist of an integrated luminosity of 3.11 fb-1 at the resonance, corresponding to events. To evaluate non- backgrounds we also collected 1.61 fb-1 of “continuum” data 60 MeV below the resonance.
The inclusive decay is studied by reconstructing the decay channels and using the decay modes and . The is reconstructed using the decay modes and . Hadronic events are required to satisfy the ratio of Fox-Wolfram moments [11] to reduce the background from continuum events.
Charged tracks, except pions from decays, are required to be consistent with coming from the primary interaction point. Charged kaon and pion candidates are identified using specific ionization () and, when available, time-of-flight (TOF) information. For kaon identification, we consider the relative probability for a charged track to be a kaon, , where is the probability for a given particle hypothesis. The requirement on depends on the decay mode of interest. Pion candidates are identified by requiring the and, when available, TOF information to be within 3 standard deviations () of that expected for pions. We select candidates through the decay to by requiring a decay vertex displaced from the primary interaction point and a invariant mass within 10 MeV/c2 of its nominal value. We reconstruct candidates through the decay to by requiring candidates to have an invariant mass within 2.5 standard deviations ( MeV/c2) of the nominal mass.
The and combinations are required to have a kaon identification of and , respectively, and an invariant mass within 15 and 25 MeV/c2 () of the nominal mass, respectively. In addition, we select regions of the Dalitz plot to take advantage of the known resonant substructure [12]. For the mode, the Dalitz cut reduces the signal efficiency by 40% and the background by 80%. We relax the Dalitz cut for the mode since the combinatoric background is substantially lower.
The candidates are required to have a mass difference within 1.5 MeV/c2 () of the nominal value of 145.4 MeV/c2, where is the reconstructed invariant mass of . Similarly, the candidates are required to have a mass difference within 1.5 MeV/c2 () of the nominal value of 142.1 MeV/c2. To form candidates charged kaons are combined with candidates and ’s are combined with candidates. Since the primary kaons from decays have low momentum, we can impose a stringent requirement on the with negligible loss of efficiency. The candidates are required to have a scaled momentum , which is the kinematic limit for decays. (We ignore the negligible contributions from decays.) Upper-vertex production results in a maximum of 0.35, and this requirement is imposed when determining the decay constant. The decay channels with ’s in the final state often have multiple candidates per event. We select the candidate with the highest probability of being a , which is derived from the invariant masses of the reconstructed , and mesons.
III Raw Yields
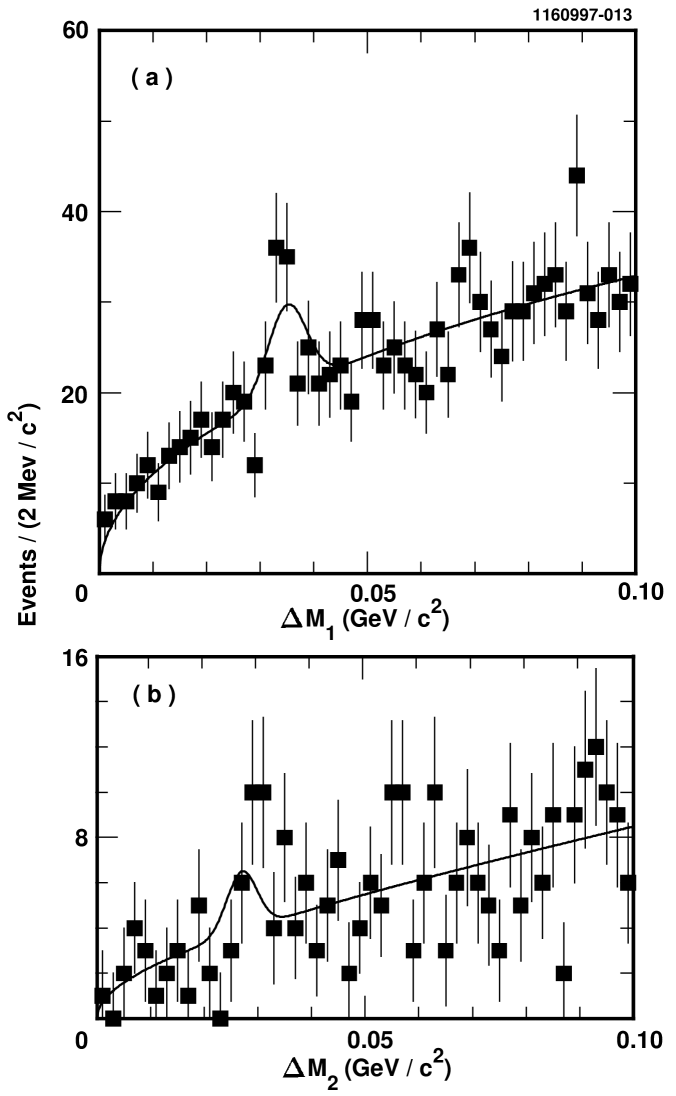
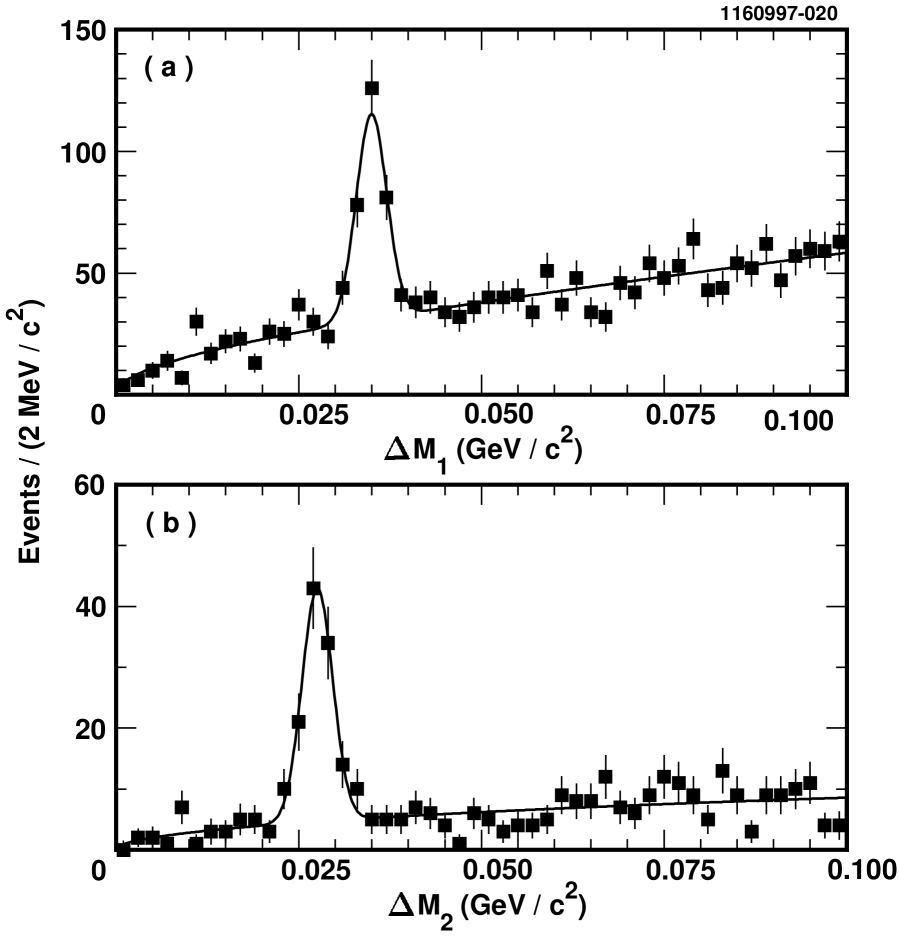
The signal is identified using the mass difference, and , where and are the known masses [1]. The mass difference signal has a resolution that is two to four times smaller than the corresponding signal in the reconstructed invariant mass distribution. The and distributions are shown in Figure 2, where the and modes have been added together. The data is fit with a Gaussian signal and a threshold background function. The Gaussian width is fixed to that expected from a GEANT-based Monte Carlo simulation [13] ( MeV/c2, depending on the mode) and the mean is fixed to the measured mass difference from continuum data ( MeV/c2 and MeV/c2.) We observe signal events in the mode and events in the mode.
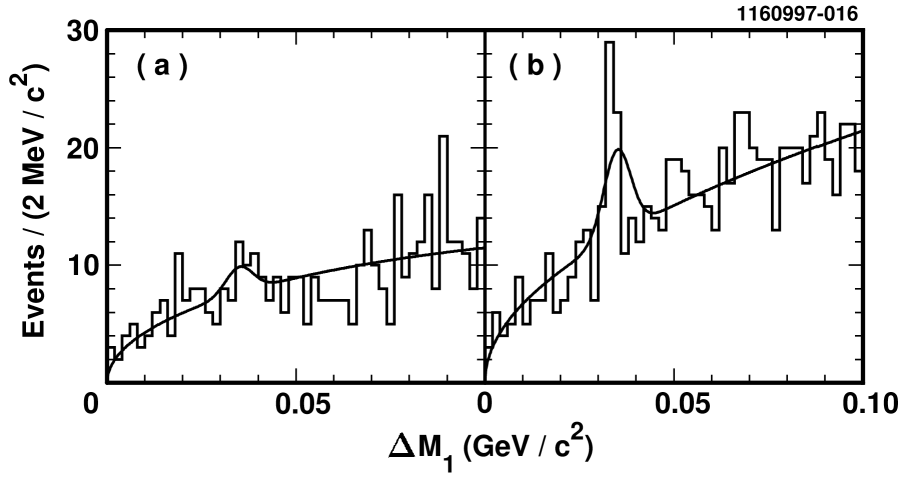
However, when the candidates are further subdivided into the and decay channels there is a discrepancy in the yields. As shown in Figure 3, we observe signal events in the distribution for the channel and signal events for the channel. After accounting for branching fractions and efficiencies, discussed below, this results in a discrepancy in the rates between the two modes. We cannot rule out the fact that background sources may be contributing a false signal in the channel, but not in the channel. However, no such mechanism has been uncovered. To be conservative, we choose to quote only an upper limit for the decay .
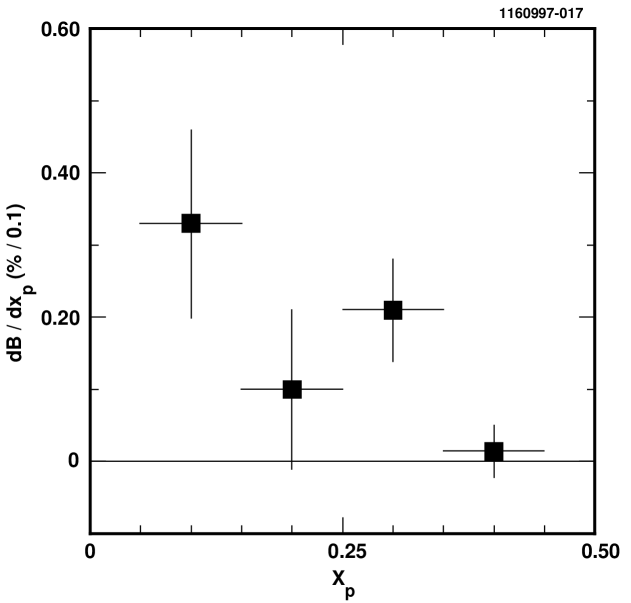
Since the reconstruction efficiency increases rapidly with and the momentum distribution from decays is not known, we compute the inclusive branching fraction by dividing the data into four equal regions of from 0.05 to 0.45 and summing the efficiency corrected yields. The and branching fractions are equal according to isospin, and their ratio has been measured to be within 30% of unity [14]. We measure the branching fraction to be from the mode and from the mode, where the error is statistical only. The two measurements are statistically consistent. The distribution for our candidates is shown in Figure 4.
IV Cross-Checks
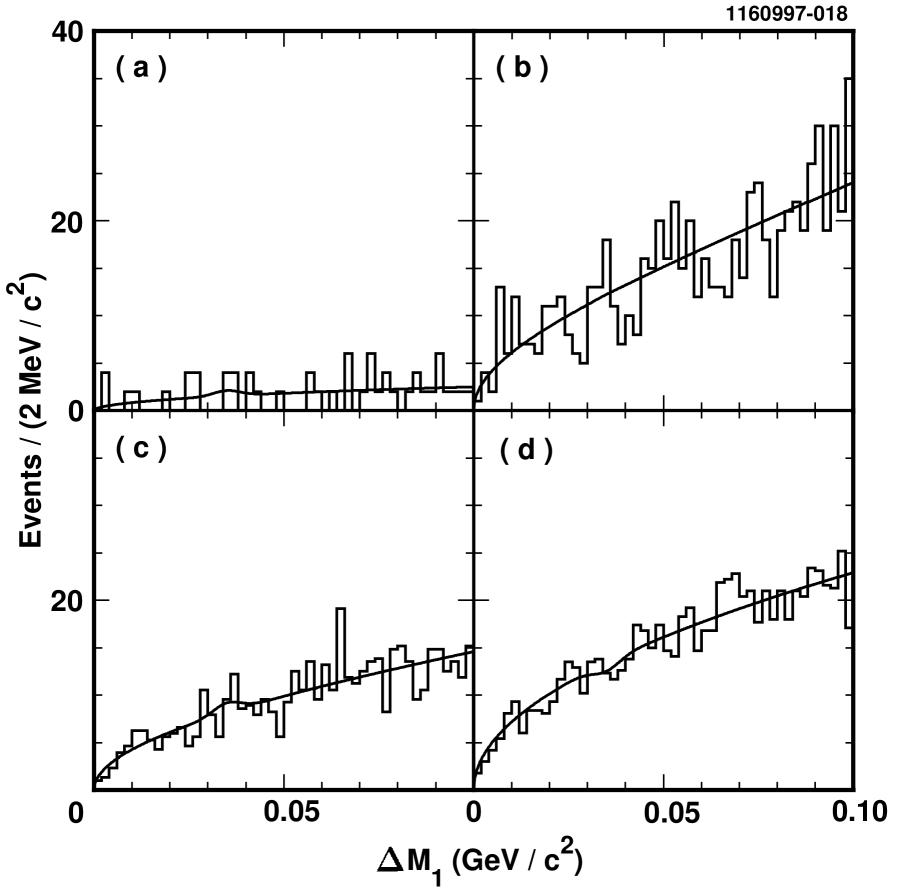
Several cross-checks, shown in Figure 5, were performed to corroborate the validity of the signal. The scaled continuum background from data after satisfying all selection cuts is negligible, and there is no excess in the signal region ( events). The uncertainty in the continuum contribution is included in the systematic error. There is also no evidence of peaking in the signal region for wrong-sign combinations ( events), mass sidebands ( events), and mass sidebands ( events).
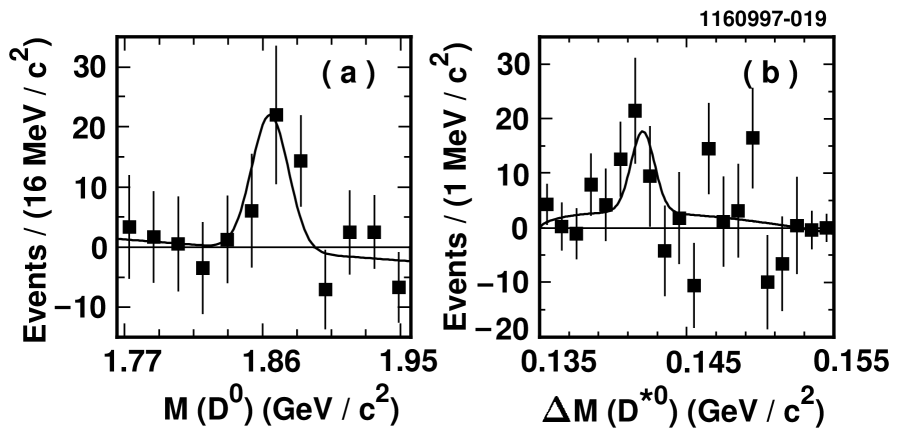
We have also searched for the signal from candidates in the signal region, MeV/c MeV/c2, by relaxing the mass cut and histogramming the invariant mass of all and combinations that satisfy the remaining selection criteria. In events with multiple candidates per decay mode we select the candidate with the highest probability, which is derived from the reconstructed and masses. We observe events. However, there are also real ’s in the random combinations under the peak; after a sideband subtraction the invariant mass spectrum yields events (see Figure 6(a)). This is consistent with our yield in Figure 2.
Similarly, we have studied the signal from candidates in the signal region. We observe events. As in the case there are also real ’s in the random combinations under the peak. After a sideband subtraction the mass difference spectrum yields events (See Figure 6(b)), consistent with our yield.
Finally, we have studied the production from continuum events. The selection criteria is similar to that used to find from decays, but since continuum charm production has a hard fragmentation, we require . In addition, we remove the cut, relax the charged kaon identification to , and remove the Dalitz cut for . The mass difference distribution for and combinations are shown in Figure 7, where the and modes have been added together. We extract the signal by fitting the data with a Gaussian signal and a threshold background function. The Gaussian width is fixed to the value predicted by Monte Carlo (2.1 MeV/c2), and the mean is allowed to float. We observe events in the mode with a mass difference of MeV/c2 (statistical error only), and events in the mode with a mass difference of MeV/c2. The results are consistent with the previous CLEO analysis [14].
V Systematic Errors and Final Results
There are several sources of systematic error. We assign a systematic error of 16% to account for the discrepancy between the rates for the and modes. This accomodates different methods of computing the weighted average of the branching fraction from the four separate decay chains. Uncertainties due to reconstruction efficiencies include 1.5% per charged track, 5% per , 5% for slow pions from , and 5% for . We also include systematic errors of 7% for Monte Carlo statistics, 5% for kaon identification and the Dalitz decay cut efficiency, 4% for uncertainties in the yield for , and 8% for uncertainties in the continuum contribution that passes our selection criteria. The total systematic error is 24%.
Averaging the and modes together, we obtain . Since the signal is observed largely in only one decay mode with , and since there is a discrepancy between this mode and the corresponding mode involving , we instead prefer to quote an upper limit on the branching fraction to be at the 90% C.L. [15] This decay rate limit is small relative to the total rate expected for of about from the wrong-sign meson yield in decays [6]. This is not surprising considering the system has appreciable phase space beyond the mass [4]. Also, CLEO’s [16] recent observation of exclusive decays shows that the invariant mass distribution lies mostly above the mass.
VI Decay Constant
Measurement of the decay rate also provides an estimate of the decay constant, , assuming that the comes dominantly from upper-vertex decays. The inclusive decay rate for mesons into ground state or excited mesons can be calculated assuming factorization [17],
where is the BSW [18] parameter for the effective charged current, and is a kinematic factor with and . For scalar or pseudoscalar mesons, , and for vector or axial-vector mesons, .
We have tightened the requirement to since this is the kinematic limit for upper-vertex decays. The production of ground state and excited mesons from lower-vertex decays such as is expected to be suppressed. This is certainly true for decays where the fraction of produced at the lower-vertex is measured to be [19]. Moreover, there is no evidence of production in the region where lower-vertex production is likely to occur (see Figure 4.)
With the assumption we can extract from the ratio of inclusive rates,
Many systematic errors cancel in the ratio. When computing the decay constant from the above equation, we use of the measured branching fraction to account for uncertainties in the upper and lower vertex contributions to . This accomodates the excess of candidates observed at low as seen in Figure 4. From our upper limit on and CLEO’s [20] measurement of , we derive at the 90% C.L. The central value is , where the first error is due to the total error in the inclusive and branching fractions, and the second is the uncertainty in the non-factorizable and lower-vertex contributions to the decay rate. Using the measured value of MeV [20] gives MeV which corresponds to an upper limit of MeV. This limit accomodates the prediction of MeV by Veseli and Dunietz [21].
VII Conclusions
In summary, we have searched for mesons decaying into the P-wave meson. The upper limit of at the 90% C.L. accounts for at most only a fraction of the total wrong-sign rate. Assuming factorization, the decay constant is at least a factor of 2.5 times smaller than the decay constant for the pseudoscalar .
ACKNOWLEDGEMENTS
We gratefully acknowledge the effort of the CESR staff in providing us with excellent luminosity and running conditions. J.P.A., J.R.P., and I.P.J.S. thank the NYI program of the NSF, M.S. thanks the PFF program of the NSF, G.E. thanks the Heisenberg Foundation, K.K.G., M.S., H.N.N., T.S., and H.Y. thank the OJI program of DOE, J.R.P., K.H., M.S. and V.S. thank the A.P. Sloan Foundation, R.W. thanks the Alexander von Humboldt Stiftung, M.S. thanks Research Corporation, and S.D. thanks the Swiss National Science Foundation for support. This work was supported by the National Science Foundation, the U.S. Department of Energy, and the Natural Sciences and Engineering Research Council of Canada.
REFERENCES
- [1] Particle Data Group, R.M. Barnett et al., Phys. Rev. D 54, 1 (1996).
- [2] I. Bigi, B. Blok, M. Shifman and A. Vainshtein, Phys. Lett. B 323, 408 (1994).
- [3] A.F. Falk, M.B. Wise, and I. Dunietz, Phys. Rev. D 51, 1183 (1995); E. Bagan, P. Ball, V.M. Braun, and P. Gosdzinsky, Phys. Lett. B 324, 362 (1995); M.B. Voloshin, Phys. Rev. D 51, 3948 (1995).
- [4] G. Buchalla, I. Dunietz, and H. Yamamoto, Phys. Lett. B 364, 188 (1995).
- [5] B. Blok, M. Shifman, and N. Uraltsev, preprint CERN-TH/96-252.
- [6] CLEO Collaboration, T.E. Coan et al., preprint CLNS 97/1516, CLEO 97-23.
- [7] ALEPH Collaboration, PA05-060, contributed to the 1996 International Conference on High Energy Physics, Warsaw, Poland.
- [8] DELPHI Collaboration, PA01-108, contributed to the 1996 International Conference on High Energy Physics, Warsaw, Poland.
- [9] S. Okubo, Phys. Lett. B 5, 165 (1963); G. Zweig, CERN Report 8419/TH412 (1964); I. Iizuka, Prog. Theor. Phys. Suppl. 37, 21 (1966).
- [10] CLEO Collaboration, Y. Kubota et al., Nucl. Inst. and Meth. A320, 66 (1992).
- [11] G. Fox and S. Wolfram, Phys. Rev. Lett. 41, 1581 (1978).
- [12] E691 Collaboration, J.C. Anjos et al., Phys. Rev. D 48, 56 (1993).
- [13] R. Brun et al., GEANT 3.15, CERN DD/EE/84-1.
- [14] CLEO Collaboration, J. Alexander et al., Phys. Lett. B 303, 377 (1993).
- [15] The 90% upper limit is derived, assuming Gaussian statistics, by adding 1.28 times the total error to the central value.
- [16] CLEO Collaboration, M. Bishai et al., CLEO-CONF 97-26, EPS97-337, contributed to the 1997 International Europhysics Conference on High Energy Physics, Jerusalem, Israel.
- [17] J.H. Kuhn, S. Nussinov, and R. Ruckl, Z. Phys. C 5, 117 (1980).
- [18] M. Bauer, B. Stech, and M. Wirbel, Z. Phys. C 29, 637 (1985).
- [19] CLEO Collaboration, X. Fu et al., CLEO CONF-95-11, EPS0169, contributed to the 1995 International Europhysics Conference on High Energy Physics, Brussels, Belgium.
- [20] CLEO Collaboration, D. Gibaut et al., Phys. Rev. D 53, 4734 (1996).
- [21] S. Veseli and I. Dunietz, Phys. Rev. D 54, 6803 (1996).