Search For Disoriented Chiral Condensates In 158 AGeV Pb+Pb Collisions
Abstract
The restoration of chiral symmetry and its subsequent breaking through a phase transition has been predicted to create regions of Disoriented Chiral Condensates (DCC). This phenomenon has been predicted to cause anomalous fluctuations in the relative production of charged and neutral pions in high-energy hadronic and nuclear collisions. The WA98 experiment has been used to measure charged and photon multiplicities in the central region of 158 AGeV Pb+Pb collisions at the CERN SPS. In a sample of 212646 events, no clear DCC signal can be distinguished. Using a simple DCC model, we have set a 90% C.L. upper limit on the maximum DCC production allowed by the data.
, , , , , , , , , , , , , , , , , , , , , , , , , , , , , , , , , , , , , , , , , , , , , , , , , , , , , , , , , , , , , , , , , , , , , , , , , , , , , , , , , , , , , , , , , , , , , , , , , , , , , , , , , , , , , , , , , , , , , , , , , , , , , , , , , , , , , , , , , , , , , , , , , , , , , , , , , , , , , , , , , ,
1 Introduction
The approximate chiral symmetry of the QCD vacuum is believed to be spontaneously broken in nature by the formation of an isoscalar quark condensate. Disoriented Chiral Condensates (DCC) may form in large, hot regions of hadronic matter where this symmetry has been briefly restored [1]. A DCC has an equal probability to be in any state related to the normal vacuum by a chiral rotation. By projecting the space of these available states onto a basis of definite isospin, it has been found that the charge distribution of pions emitted from a DCC has a characteristic form [2]:
| (1) |
where is the neutral fraction,
| (2) |
This allows the possibility of hadronic interactions with anomalous fluctuations between charged pions and neutral pions, as seen through their two-photon decay channel.
The phenomenology of DCCs was first introduced in the context of hadronic collisions by Bjorken et al, whose “Baked Alaska” model [3] postulated that a hot shell, expanding at the speed of light, could shield the cool interior from the influence of the normal vacuum outside, allowing a large region of DCC to form. Rajagopal and Wilczek [4, 5] studied the production of DCCs in nuclear collisions by studying the chiral phase transition in QCD, via its similarity to the O(4) Heisenberg magnet [6]. Through numerical simulations, they found that as the system rapidly expands and cools through the phase transition, the equations of motion induce a non-equilibrium relaxation of the chiral fields which amplifies the production of soft pion modes in a well-defined chiral direction. This effectively creates clusters of low- pions, with the cluster charge distribution following equation (1). It should be noted that, in both studies, the strongest influence on the final state composition is the symmetry itself rather than the exact physics scenario studied. Further work confirmed these initial results, even after accounting for quantum fluctuations, and proposed other mechanisms which might allow for large, long-lived DCCs[1].
By allowing the possibility of events with almost no electromagnetic energy, DCCs are an attractive hypothesis to explain the “Centauro” events seen in cosmic rays [7]. These events have already motivated searches for unusual charge fluctuations at the (by UA1 [8] and UA5 [9]) and at the Tevatron (by Minimax [10] and CDF [11]). And yet, there have been no systematic studies utilizing the simultaneous measurement of charged and neutral multiplicities in heavy ion collisions at any energy. It has been argued [1] that heavy ion collisions at SPS energies, the highest currently available, might create the large volumes which favor the development of long-wavelength oscillations within the reaction zone. It is true that large baryon number in the central region complicates theoretical calculations and may obscure the initial signal via the rescattering of secondaries. It is also possible that the low-energy observation that most pions are produced resonantly via the and channels leaves few “direct” pions which may be influenced by a DCC. We must keep in mind, however, that these are extrapolations from lower energies. Their cumulative effect is uncertain, especially at higher energies where the formation of a quark-gluon plasma would render previous measurements inapplicable. In any case, in the absence of any substantial experimental evidence for or against DCCs in heavy ion collisions at SPS energies, and a great deal of theoretical evidence in their favor, it is imperative to simultaneously measure charged and neutral particles at the SPS and analyze their fluctuations to perhaps isolate a DCC signal. Observing such a signal might be an indication of the chiral phase transition in hot nuclear matter.
2 Experimental setup
The WA98 experiment [12] is a general-purpose, large-acceptance photon and hadron spectrometer with the ability to measure several different global observables event-by-event. For this search, we use a subset of the full apparatus, shown schematically in Figure 1. We measure charged particles with a Silicon Pad Multiplicity Detector (SPMD) and photons with a Photon Multiplicity Detector (PMD). Using these, we are able to count charged particles and photons in the central pseudorapidity region on an event-by-event basis. For a determination of the centrality of each collision, we use the transverse energy () measured in the Midrapidity Calorimeter (MIRAC [13]). For removal of background events, we also use the Zero-Degree Calorimeter (ZDC) and the Plastic Ball detector [14].
2.1 Charged particle multiplicity
We count charged particles using a circular Silicon Pad Multiplicity Detector (SPMD) [15] located 32.8 cm from the target covering , the central rapidity region at SPS energies (where ), and full azimuth. The detector consists of four overlapping quadrants, each fabricated from a single 300 thick silicon wafer. The active area of each quadrant is divided into 1012 pads forming 46 azimuthal wedges and 22 radial bins with a pad size increasing with radius to provide uniform pseudorapidity coverage. The efficiency of detecting a charged particle in the active area has been determined in a test beam to be better than 99%. Conversely, the detector is transparent to high energy photons, since only about 0.2% are expected to interact in the silicon. During the data taking, 95% of the pads worked properly and are used in this analysis.
In a central ion-ion collision, the occupancy can be as high as , implying that of the pads contain two or more hits. An unbiased way to estimate the total number of charged particles in a given event under such conditions is to use the sum of the energy deposited in pads exceeding 1/2 of the most probable energy loss divided by the mean energy loss per particle as determined in low-multiplicity events:
Because of the fluctuations in the energy loss, described by a Landau distribution, the uncertainty on can be estimated to be . For typical central events with a multiplicity of , this gives an uncertainty of about 2%. To check the overall scale, we compare the results with the multiplicity obtained by assuming that the particles are distributed uniformly so the multi-hit probability is given by Poisson statistics. A simple calculation gives , where is the total number of pads, and is the total number of hit pads. Using this as a check, we estimate the systematic error on , due to uncertainties in the gains and backgrounds, to be about 4%.
2.2 Photon multiplicity
We count photons in the preshower Photon Multiplicity Detector (PMD) situated 21.5 m from the target, covering the region . The photons impinging on the detector are converted in 3.34 thick lead and iron and the secondaries are detected in 3mm-thick square plastic scintillator pads of varying sizes (15mm, 20mm and 23mm). A matrix of 50 38 pads is placed in one light-tight box module and read out individually via wavelength shifting optical fibers coupled to an image intensifier and CCD camera system similar to that described in [16]. The modules with smaller pads were mounted in the forward angle region to minimize cluster overlap at large multiplicities and to provide reasonably uniform occupancy. Out of a total of 28 box modules implemented in the PMD, the data presented here correspond to 19 box modules having 35524 pads. The average occupancy for the part of the detector considered in the present case is around 15% for central events.
The principle of photon identification makes use of the fact that photons are more likely to shower in the lead converter and produce a large signal in the scintillator pads, while non-showering hadrons will produce a signal corresponding to a single minimum ionizing particle (MIP). Signals from several neighbouring pads are combined to form clusters and those with energy deposition larger than that corresponding to 3 MIPs are considered to be ”-like” clusters. This selection gives an average photon counting efficiency of about 70% which is almost uniform over the range of centrality and pseudorapidity considered. It also creates an effective lower cutoff of 30 MeV/c, at which point the efficiency falls below 35%. About 15% of the produced hadrons impinging on the PMD interact in the converter, generating secondaries which also deposit large energy on the detector. This contamination constitutes a background to photon counting. In order to minimize effects due to variations in the angular distributions of charged particles, we only use data with the Goliath magnet turned off.
The photon counting efficiency, hadron contamination and the associated errors are derived using test beam data and GEANT simulation using a method similar to the ones described in [16, 17]. The level of hadron contamination in the PMD was verified by comparing the azimuthal distribution of hits for magnet-on and magnet-off data[18]. The azimuthal distribution of charged tracks becomes very non-uniform in the presence of the magnetic field, the amount of non-uniformity indicating the magnitude of the hadron contamination.
It should be emphasized that in this analysis, we do not correct the data using these parameters. Instead we account for all of the detector effects by fully simulating the conversion of particles in the detector, as described below.
2.3 Data and Event Selection
In this analysis, we study reactions induced by a 158 AGeV Pb beam incident upon a 213m thick target. The fundamental “beam” trigger condition consists of a signal in a gas Čerenkov start counter [19] located 3.5 meters upstream of the target and no coincident signal in a veto counter with a 3mm circular hole located 2.7 meters upstream from the target. A beam trigger is considered to be a minimum-bias interaction if the transverse energy sum in the full MIRAC acceptance exceeds a lower threshold.
Pileup events are eliminated using a system of TDCs each started by a particular trigger counter and stopped by a second trigger. Using these, we remove events where a second interaction occurred within a window before and after the recorded event. Still, our TDC system cannot distinguish two events that arrive less than 50 ns apart. These are eliminated by requiring the sum of energy deposited in the MIRAC () and ZDC () to be consistent with a single event. After applying these cuts, 70% of the data sample remains.
3 General Features of Data and Comparison with VENUS 4.12
To describe the bulk of the data, we use the VENUS 4.12 [20] event generator with its default settings. To compare VENUS with our data, we propagate the raw generator output through a full simulation of our experimental setup using the GEANT 3.21 [21] package from CERN. The simulation incorporates the detector physics effects and folds them into the generated data, which is then analyzed using the same code used for the raw experimental data. In the rest of this paper, the term “VENUS” refers to the combination of VENUS 4.12 and the full GEANT 3.21 detector simulation, not to the raw generator output, unless otherwise specified.
The SPMD simulation includes the effect of Landau fluctuations in the energy loss of charged particles in the silicon and the pad geometry of the detector. In addition to the secondaries from the ion-ion collision itself, the SPMD is also sensitive to the -rays generated by the ion passing through the lead target. We can get a conservative estimate of the -ray multiplicity in physics events by studying events that satisfy the conditions for a beam trigger but not the interaction trigger. These “beam” events have a mean multiplicity in the SPMD of 11.4.5 and a width of 5.9.3. The angular distribution is consistent with a spatially uniform illumination of the detector surface. To include these ion-induced -rays in the simulation, we sample the measured charged multiplicity distribution for beam events and add it to the charged particle multiplicity for each simulated event. We estimate the uncertainty in the absolute scale of from the simulation to be less than 3% and the relative uncertainty between data and VENUS to be less than 2%.
The PMD simulation also incorporates the effects of additional fluctuations to the energy loss arising due to the statistical nature of the scintillation process; light transport through the wavelength shifting fibres and the image intensifier chains; and imperfections in the electro-optical imaging. The widths due to this extra fluctuation were obtained by a comparison of the GEANT and test beam results using single pions and electrons at various energies. As all of the readout chains were not used in the test beam experiment, a method of detailed intercomparison of the various features of data and simulation was used to obtain the gains of the individual readout units. We estimate the uncertainty on the absolute multiplicity scale of simulated -like clusters, due to uncertainties in various parameters of the simulation and data analysis, to be 15%, and that the relative uncertainty between data and VENUS is 5%.
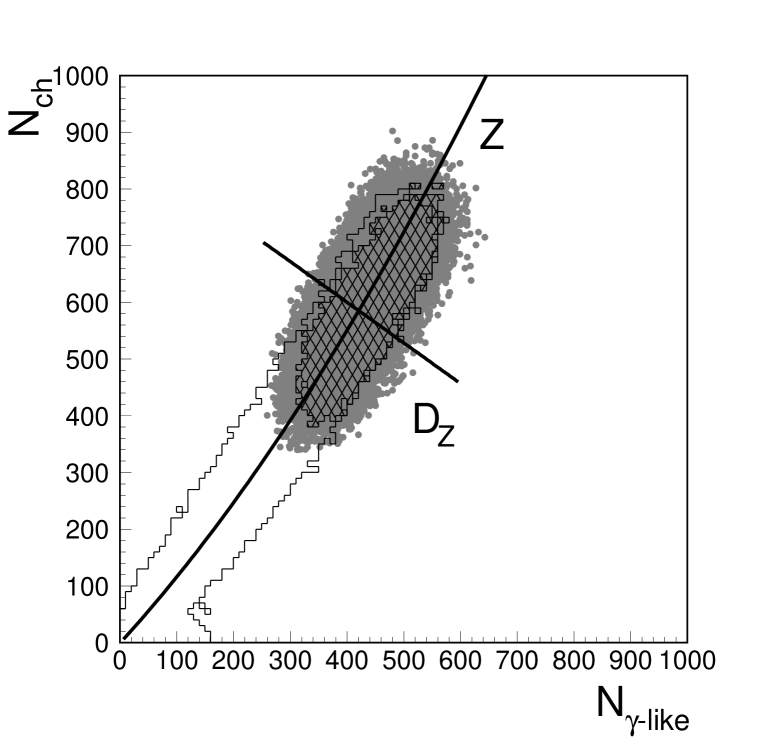
In Figures 2a and 2b we present the minimum-bias multiplicity distribution for charged particles and -like clusters. For the DCC search, we will concentrate on the 10% most central events, defined by a measured transverse energy of at least 300 GeV in . These correspond roughly to the top 620 mb of the Pb+Pb minimum bias cross section 6200 mb. After all cuts are applied, there are 212646 events in this sample, which we will refer to as the “central” sample in the rest of this paper. The central data sample is shown by closed circles in Figs. 2a and 2b and a comparison with VENUS events chosen by identical cuts is shown by the histogram. The correlation between the charged and neutral multiplicities is presented in Figure 3 with the minimum bias distribution outlined, the central VENUS events hatched, and the central data events shown as scattered points, each point corresponding to a single event.
The most distinctive feature of the scatter plot is the strong correlation between the charged and neutral multiplicities. A reasonable explanation of this would be if most of the produced particles are pions with their charge states partitioned binomially, as measured in experiments at similar energies [22]. A binomial distribution leads to a correlation width , which would explain the very tight correlation, since the relative fluctuations are proportional to . As this is seen in both data and VENUS, we can study the contributions to the different multiplicities to verify this hypothesis. In fact, about 80% of the charged particles produced in VENUS are pions, the rest being protons and kaons. Moreover, about 85% of produced photons come from decays. Thus, by simply counting the charged particles and photons produced in a heavy ion collision, we have a reasonable estimate of the number of charged and neutral pions created.
We verify the binomial nature of the charge fluctuations in VENUS by studying its “binomiality”:
| (3) |
where and are number of charged pions and the total number of pions for each event, and is the probability that a pion is charged. For a pure binomial distribution, and B is Gaussian with a mean at zero and an RMS of one. For VENUS without GEANT, we find an RMS of approximately for pions produced in the central rapidity region in events with an impact parameter less than 6 fm. This is consistent with the hypothesis that the correlation arises mainly from the binomial partition of , the total pion multiplicity.
4 Event-by-Event Search for DCCs
DCCs should modify the binomial partitioning of into charged and neutral pions. Events in which a DCC is produced (henceforth referred to as “DCC events”) will show up as deviations from the binomial behavior and appear as outliers with respect to the bulk of the data. We have already discussed that the charged and neutral multiplicities are directly sensitive to the charged and neutral pion multiplicities in each event. Thus, DCC events should appear in the correlation of charged and neutral multiplicities, while the individual distributions will be mainly unaffected.
4.1 Data Analysis
The strong correlation between charged and neutral multiplicities described above suggests a more appropriate coordinate system with one axis being the measured correlation axis and the other perpendicular to it. If all detected particles were pions and the detectors were perfect and had identical pseudorapidity acceptance, then the correlation axis would be a straight line. Instead, we must account for the fact that at high multiplicities, the pseudorapidity distributions tend to narrow, changing the relative acceptance of charged and neutral particles due to the non-identical apertures of the SPMD and PMD. Moreover, the large occupancies in the PMD lead to a slight saturation effect. It is then useful to define a coordinate system consisting of a correlation axis () described by a second-order polynomial, and the perpendicular distance () from it, which is defined to be positive for points below this Z axis. These axes are shown superimposed on Figure 3 and the projection along the Z-axis is shown in Figure 4a. The full projection along the -axis is shown in Figure 4b. To a very good approximation, the data are Gaussian distributed, which is consistent with binomial partition. The VENUS results, shown by the histogram, are also Gaussian, but with a slightly smaller width.
In both cases, , the standard deviation of a gaussian fit in the direction, increases with increasing Z. We have chosen to work with the scaled variable in order to compare relative fluctuations at different multiplicities. While binomial partition leads to fluctuations that grow as , the data and VENUS follow a slightly different power law, due to the presence of contaminating particles, like nucleons kaons, and etas. A reasonable parametrization of for has been found to be where for the data, and for the simulated events, and =.46. The discrepancy between VENUS and the data can be seen more clearly by measuring the width of the distribution with the in the denominator taken from the simulation. The VENUS distribution is a gaussian of width .998.002 (fit error only) and the data is also gaussian, of width 1.13.07 (error from relative scale uncertainties included).
4.2 Model of DCC production
To estimate the effect of DCC production we have modified the VENUS events to include characteristic fluctuations in the relative production of charged and neutral pions. We assume that only a single domain of DCC is formed in each central collision. A certain fraction of the VENUS pions is associated with this domain and a value of is chosen randomly according to the distribution shown in equation 1. Then the charges of the pions are interchanged pairwise ( or ) until the charge distribution matches the chosen value of . This simulates a DCC accompanied by the normal hadronic background in a way that conserves energy, momentum, and charge. The distribution for the = 0%, 25% and 60% DCC hypotheses are shown in Figure 5 with the data overlaid as closed circles. It is clear that the distributions get wider as is increased.
4.3 Upper Limit Calculation
As seen in the previous section, DCC events will show up as non-statistical tails on the axis. We see no such events in our data sample. Thus, we are faced with the possibilities that single-domain DCCs are very rare, very small, or both. To check which hypotheses are consistent with our data, we determine upper limits on the frequency of DCC production as a function of its size, as represented by .
We have computed distributions for several values of , ranging from 15% to 90%. To define an efficiency for detecting DCCs, we start from the observation that the distribution assuming the null hypothesis is Gaussian. With our statistics, we expect few events farther than 5 to 6 from the mean. An event containing a DCC, however, has an enhanced probability of being found in this region. The cut then defines a two-dimensional region in the scatter plot in which all events are considered to be “DCC candidates”. Once the cut is set, the DCC efficiency is defined, for VENUS events, as
| (4) |
which is a function of both the DCC fraction and the cut position.
The background is determined by a Gaussian fit to the VENUS distribution, in order to extrapolate beyond the Monte Carlo statistics. With the efficiency and background determined, we calculate the Poisson upper limit for a 90% confidence level, which is 2.3 if there are no measured events over the cut and no background events are expected. These three numbers are combined into an upper limit, for events, via the formula:
| (5) |
We have calculated limits for two scenarios. The first is based upon the conservative assumption that VENUS should describe the data perfectly in the absence of a DCC signal. Under these assumptions, as obtained from VENUS (as it was in Figure 5) and , which is well away from the data point with the largest . The 90% C.L. limit is presented in Figure 6 as a solid line. The other scenario assumes that the difference between the data and VENUS is due to detector effects and that the widths should be the same. In this case, , with taken from the data, and we choose a tighter cut . This limit is presented in the same figure as a dashed line. The two limits are quite different at 15% but get closer at 30%. In both cases, the uncertainty in the absolute comparisons between the data and VENUS have not been included in the upper limit estimate.
5 Discussion
Earlier studies estimated the DCC radius to be around fm. Coupled with a vacuum energy density given by the chiral effective potential to be 60-120 MeV/fm3, and an assumed Gaussian distribution of width , an average DCC was thought to generate pions [23]. The SPMD sees all of the charged particles produced in the central rapidity region, 80% of which are pions, letting us estimate the total number of centrally produced pions in an average event to be about 720. Thus, we would expect a DCC to be approximately . Our analysis clearly rules out anything larger than about 25% within the scope of the assumed model, but cannot say much about anything smaller. However, if the pions tend to cluster in phase space, there are methods that should be able to find DCC events, and these are currently under study [24, 25].
A small and frequent DCC might also appear as a slightly enhanced width, similar to what we observe in our data when compared to VENUS. However, this enhancement could also result from uncertainties in the detector modelling or the underlying physics model itself. For instance, theoretical uncertainties might arise because no model has ever been used to study charge correlations in heavy ion collisions. Rescattering phenomena, resonances, or Bose-Einstein effects may have predictable effects on the expected binomial distribution. These issues will be addressed in future studies.
6 Conclusions
We have used the WA98 apparatus to perform the first search for the production of Disoriented Chiral Condensates in 158 AGeV Pb+Pb collisions. No events with large charged-neutral fluctuations have been observed. By comparing the correlations of the charged and neutral multiplicity, measured on an event-by-event basis, to a simple model incorporating a DCC signal into VENUS 4.12 events, we have set a 90% CL upper limit on the frequency of DCC production as a function of its size.
7 Acknowledgements
We wish to express our gratitude to the CERN accelerator division for excellent performance of the SPS accelerator complex. We acknowledge with appreciation the effort of all engineers, technicians and support staff who have participated in the construction of the this experiment. This work was supported jointly by the German BMBF and DFG, the U.S. DOE, the Swedish NFR, the Dutch Stichting FOM, the Stiftung fuer Deutsch-Polnische Zusammenarbeit, the Grant Agency of the Czech Republic under contract No. 202/95/0217, the Department of Atomic Energy, the Department of Science and Technology, the Council of Scientific and Industrial Research and the University Grants Commission of the Government of India, the Indo-FRG Exchange Programme, the PPE division of CERN, the Swiss National Fund, the International Science Foundation under Contract N8Y000, the INTAS under Contract INTAS-93-2773, ORISE, Research-in-Aid for Scientific Research (Specially Promoted Research & International Scientific Research) of the Ministry of Education, Science and Culture, the University of Tsukuba Special Research Projects, and the JSPS Research Fellowships for Young Scientists. ORNL is managed by Lockheed Martin Energy Research Corporation under contract DE-AC05-96OR22464 with the U.S. Department of Energy. The MIT group has been supported by the US Dept. of Energy under the cooperative agreement DE-FC02-94ER40818. In addition we would like to thank R. Birgeneau, H.Y. Chang, A.E. Chen, W.S. Edgerly, W.T. Lin, O. Runolfsson and B. Wadsworth.
References
- [1] Krishna Rajagopal. In Hwa, editor, Quark-Gluon Plasma 2. World Scientific, 1995.
- [2] A. Anselm and M.G. Ryskin. Phys. Lett., B266:482, 1991.
- [3] K.L. Kowalski J.D. Bjorken and C.C.Taylor. SLAC-PUB-6109, 1993.
- [4] K. Rajagopal and F. Wilczek. Nucl. Phys., B399:395–425, 1993.
- [5] K. Rajagopal and F. Wilczek. Nucl. Phys., B404:577–589, 1993.
- [6] R.D. Pisarski and F. Wilczek. Phys. Rev., D29:338–341, 1984.
- [7] Y. Fujimoto C.M.G. Lattes and S. Hasegawa. Phys. Rep., 65:151, 1980.
- [8] G. Arnison et al. Phys. Lett., B122(2):189–196, 1983.
- [9] G.J. Alner et al. Phys. Lett., B180(4):415–422, 1986.
- [10] T.C. Brooks et. al. Phys. Rev., D55:5667–5680, 1997.
- [11] P. Melese for the CDF collaboration. In Proceedings XI Topical Workshop on Collider Physics, Padova, Italy, May 27-June 1, 1996.
- [12] P. Donni et. al. CERN/SPSLC 91-17 and CERN/SPSLC 95-35.
- [13] T.C. Awes et al. Nucl. Instr. and Meth., A279:479, 1989.
- [14] A. Baden et al. Nucl. Instr. and Meth., A203:189, 1982.
- [15] W.T. Lin et al. Nucl. Inst. and Meth., A389:415–420, 1997.
- [16] M.M. Aggarwal et al. Nucl. Inst. and Meth., A372:143, 1996.
- [17] M.M. Aggarwal et al. Submitted to Phys. Rev. C., 1997.
- [18] W.H.v.Heeringen. PhD thesis, University of Utrecht, 1996.
- [19] T. Chujo et. al. Nucl. Instr. and Meth., A383:409–412, 1996.
- [20] K. Werner. Phys. Rept., 232:87–299, 1993.
- [21] CERN. GEANT 3.21 Manual.
- [22] P. Grassberger and H.I. Miettinen. Nucl. Phys., B89:109–117, 1975.
- [23] S. Gavin. Nucl. Phys., A590:163, 1995.
- [24] R. Thews Z. Huang, I. Sarcevic and X.N. Wang. Phys. Rev., D54, 1996.
- [25] T.K. Nayak. In D.K. Srivastava B.C. Sinha and Y.P. Viyogi, editors, Proc. of Int’l Conf. on Physics and Astrophysics of the Quark-Gluon Plasma (ICPA-QGP’97, New Delhi, 1997. Narosa Publishing House (in press).
a.) b.)
b.)
a.) b.)
b.)

