An Expression of Interest to Detect and Measure the Direct CP Violating Decay and Other Rare Decays at Fermilab Using the Main Injector
The KAMI Collaboration
E. Cheu, S.A. Taegar
University of Arizona, Tucson, Arizona 85721
K. Arisaka, J. Park, W. Slater, A. Tripathi
University of California at Los Angeles, Los Angeles, California 90095
C.O. Escobar
Universidade de Campinas, UNICAMP, CP 6165, Campinas 13083-970, SP, Brasil
E. Blucher, R. Kessler, A. Roodman, N. Solomey, C. Qiao,
Y. Wah, B. Winstein, R. Winston
The Enrico Fermi Institute, The University of Chicago, Chicago Illinois
60637
A. R. Barker
University of Colorado, Boulder, Colorado 80309
E. C. Swallow
Department of Physics, Elmhurst College, Elmhurst, Illinois, 60126 and
The Enrico Fermi Institute, The University of Chicago, Chicago, Illinois
60637
G. Bock, R. Coleman, R. Ford,
Y. B. Hsiung, D. A. Jensen, V. O’Dell,
E. Ramberg, R. E. Ray, R. Tschirhart, H. B. White
Fermi National Accelerator Laboratory, Batavia Illinois 60510
K. Hanagaki, S. Mochida, T. Yamanaka
Department of Physics, Osaka University, Toyonaka, Osaka, 560 Japan
M. D. Corcoran
Rice University, Houston, Texas 77005
M. Arenton, G. Corti, B. Cox, A. Ledovskoy, K.S. Nelson
University of Virginia, Charlottesville, VA 22901
A. Alavi-Harati, T. Alexopoulos, A.R. Erwin, M. A. Thompson
University of Wisconsin, Madison, Wisconsin 53706
ABSTRACT
We, the KAMI (Kaons At the Main Injector) collaboration, express our interest to continue the experimental program of rare kaon decay physics at Fermilab using the Main Injector. The 120 GeV Main Injector beam will provide neutral kaon beams which are two orders of magnitude more intense than those currently available at Fermilab. This dramatic increase in flux will allow us to study direct CP violation and other rare decay processes with unprecedented precision and reach.
KAMI’s primary physics goals shall be:
-
1.
The first detection of the rare, direct CP violating decay and measurement of its branching ratio with an accuracy of 10%, corresponding to a measurement of the CP violation parameter with 5% accuracy; and
-
2.
Studies of various other rare decay processes such as , , , , , , etc. with sensitivities of approximately .
To accomplish the above goals, it is necessary to upgrade the existing KTeV detector in two major areas; hermetic photon vetos for , and fiber tracking for decay modes with charged particles.
This document summarizes the status of a feasibility study and our R & D plan for the near future.
1 Motivations
1.1 Theoretical background and motivation
The origin of the matter/antimatter asymmetry manifest in our world is of fundamental interest and remains outside the scope of the now “Standard Model” of particle interactions. The theoretical structure of the Standard Model can accommodate matter/antimatter asymmetries, but the dynamical origin of these effects must reside at a level of understanding beyond the Standard Model. After 33 years of hard work since the original observation of these asymmetries in the neutral kaon system we are now at the threshold of performing measurements of striking new asymmetry effects expected in the Standard Model. These effects are observed through “CP violation” in the mixing and decay amplitudes of K and B meson decays. The Standard model predicts large CP violation effects in the decay amplitudes of rare B meson and very rare kaon decays. More importantly, the Standard Model predicts effects in the B and K systems with a common formalism, so that matter/anti-matter asymmetries observed in these two different systems must agree if the Standard Model is on the right track.
To date, CP violation has only been observed through the window of oscillations. The effect is manifest as a difference in the rate of and mixing. Experiments at Fermilab and CERN are now underway to study this difference in precise detail, with the possibility of extracting a signal for CP violation in the decay amplitude of decays. An observation of CP violation in a decay amplitude (known as “Direct CP Violation”) would be the first really new piece of information about CP violation since the original discovery 33 years ago and the first significant insight into its origin. While this would be of immense significance, the theoretical predictions for the magnitude of direct CP violation in decays are plagued with large uncertainties, making it difficult to extract Standard Model parameters from the measurement. In contrast, the theoretical predictions for rare B and very rare K decays are much more reliable and provide a laboratory to quantitatively measure the fundamental CP violating parameters of the Standard Model. The reliability and magnitude of the predicted asymmetries in rare B and very rare K decays has stimulated an ambitious world-wide effort to measure these effects.
The very rare kaon decays of greatest interest are and . The importance of these measurements have been discussed at length in the literature for some time [1][2][3][4]. In the context of the Standard Model, measurement of these two branching fractions can uniquely determine the two fundamental CP violation parameters of the model. These two parameters are referred to as and , where directly sets the scale of CP violation within the model. Likewise, measurements in the system of B meson decays can determine the and parameters uniquely. Comparison of and in the K and B systems provides a very powerful cross-check of our understanding of CP violation within the Standard Model. The branching fraction is proportional to and provides a direct probe of CP violation within the Standard Model. The branching fraction is proportional to and hence is sensitive to both and . The and processes are expected to occur with branching fractions at the level of and , respectively. Measurement of these processes is extremely challenging due to the very low branching fractions and the presence of unmeasurable neutrinos in the final states.
Experimental rare kaon decay programs that can meet these technical challenges demand instrumentation that is at or beyond state-of-the-art in the field. These high performance kaon beam and detector systems enable the precision study of less rare kaon decays that are of interest in their own right, as well as providing key performance milestones along the way.
The primary goal of the KAMI collaboration will be to detect the decay , measure its branching ratio, and extract a value for which is accurate to approximately 5%. In addition, there are a number of other rare kaon decays of interest to the collaboration. Some of these decays are sensitive to direct CP violation, while others probe critical regions of the Standard Model. It is possible to address these other modes in KAMI without compromising the study.
In this Expression of Interest, we describe a detailed plan for how we intend to address these compelling physics issues. We first describe our current activities with the KTeV (Kaons at TeVatron) experiment at Fermilab. After a summary of the status of KTeV, we will describe our plans and goals for KAMI. The status of detailed simulations, an R&D plan, as well as preliminary budgets and schedules are presented.
1.2 Experimental status
All attempts to measure the decay thus far have relied on observation of the Dalitz decay mode of the to . The charged vertex from the provides kinematical constraints which allow for simple reconstruction of the and effective rejection of backgrounds to the sensitivity levels reached thus far. The best published limit to date for the decay is (90% CL) from Fermilab experiment E799-I [5].
The 2 decay mode of the provides more than two orders of magnitude higher sensitivity per unit time than the Dalitz mode, but at the cost of increased background due to fewer kinematical constraints. Attempts to measure this decay in the future will almost certainly migrate in the direction of the 2 mode to take advantage of this increased sensitivity. The focus of future experiments will therefore be to understand how to reduce backgrounds in the face of reduced constraints.
The most recent attempt to measure has been made by the KTeV experiment. KTeV has used both the Dalitz and the 2 decay modes of the . The 2 mode was used primarily to begin understanding the backgrounds which will ultimately have to be confronted by KAMI. Preliminary results for the 2 decay mode are presented in Section 1.4.4.
Considering the fact that the current best limit is six orders-of-magnitude higher than the predicted level, we believe that a programmatic, step-by-step approach will be necessary to eventually achieve signal detection. The KTeV run in 1997 was a significant step towards this goal. We expect to make another significant step in a 1999 run of KTeV, as described in Section 1.4.5. This will provide us with an ideal opportunity to study this mode with much better sensitivity than has been possible in the past with a minimum investment.
1.3 Current status of the KTeV experiment
The KTeV collaboration was formed with the goal of probing the most relevant questions relating to CP violation which are accessible via the neutral kaon system, using the currently available TeVatron beam and state-of-art detector technology [6]. A new physics program to measure the value of with unprecedented precision was approved as E832 in 1992 as the primary goal of the KTeV project. A program to investigate rare CP violating kaon decays, originally approved as E799 in 1988, evolved into E799-II.
After several years of construction, the experiment was successfully commissioned in the summer of 1996. Data collection began in the Fall of 1996 with a new detector, a new experimental hall and a new beamline. The run concluded in September of 1997 and intensive analysis of data is currently underway. By all accounts it was a very successful run made possible, in part, by the substantial experience gained over time from previous efforts.
E832 collected data at a rate which was 10 times faster than E731, its predecessor. E731’s measurement of gave a result of ( [7], for an overall uncertainty of about 7 x , dominated by the statistical error of . KTeV expects to significantly improve on this result.
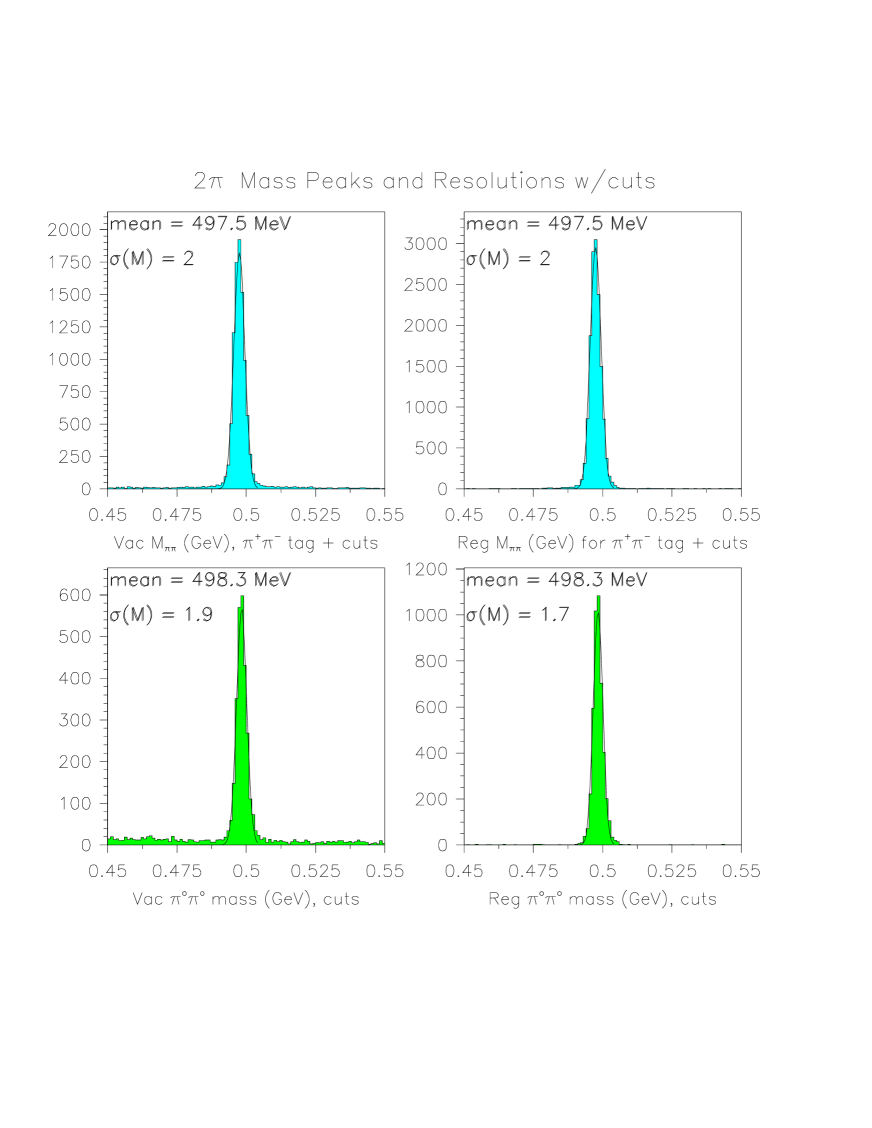
Online mass plots from E832, after loose online cuts, are shown in Figure 1. and decays from both and are shown. Both charged and neutral modes have a similar mass resolution of about 2 MeV.
A single day of E799-II data is equivalent to half of the entire run of E799-I in 1992 for many decay modes. As an example of what can be expected from E799-II, we summarize in Table 1 the expected SES and 90% confidence limit for three CP violating rare decay modes in the data collected during 1997. These numbers are extrapolated from a detailed analysis of one-day of E799 data.
| Decay Mode | Results | |
|---|---|---|
| SES | ||
| 90% CL | ||
| SES | ||
| 90% CL | ||
| (Dalitz mode) | SES | |
| 90% CL |
Both E832 and E799-II have made considerable advances over their immediate predecessors and represent the continuous progression of a neutral kaon program at Fermilab. KTeV is the latest in a long series of successful neutral kaon experiments at Fermilab. The next major step in this continuing program will be KAMI (Kaons At the Main Injector) where we expect to make similarly impressive gains over time.
1.4 New Results from KTeV
New results have begun to emerge from KTeV on numerous fronts, even before the completion of data taking. These new results include the first measurement of the rare decay , the first observation of the beta decay, the first direct search for the supersymmetric R0 particle, and the first search for using the 2 decay mode of the . These results are briefly described below. Many more new results will be available soon.
1.4.1 First measurement of
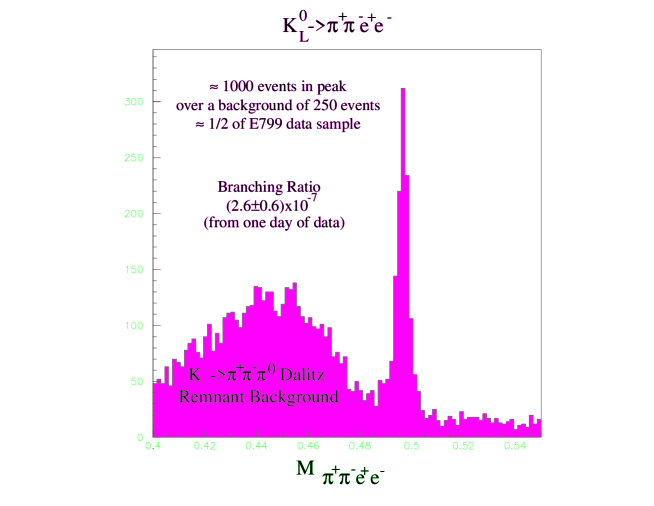
In the 1997 run of KTeV, the previously undetected decay has been definitively observed [9]. We show in Fig. 2 the mass peak from approximately one half of the data accumulated thus far. Approximately 1000 events are observed in the peak over a background of 250 events for this data sample. A preliminary branching ratio of (2.60.6) 10-7 has been measured based on one day of data taking.
One reason for the strong interest in the decay is the prospect for observing CP violation [10]. Interference of the indirect CP violation Bremsstrahlung process with the CP conserving M1 emission of a virtual photon is expected to generate an asymmetry in the angle between the normals to the decay planes of the and the in the center of mass. In addition, direct CP violation effects, albeit small, can occur in this mode via the interference between various amplitudes. Detailed investigation of this asymmetry is currently in progress.
1.4.2 First observation of the beta decay
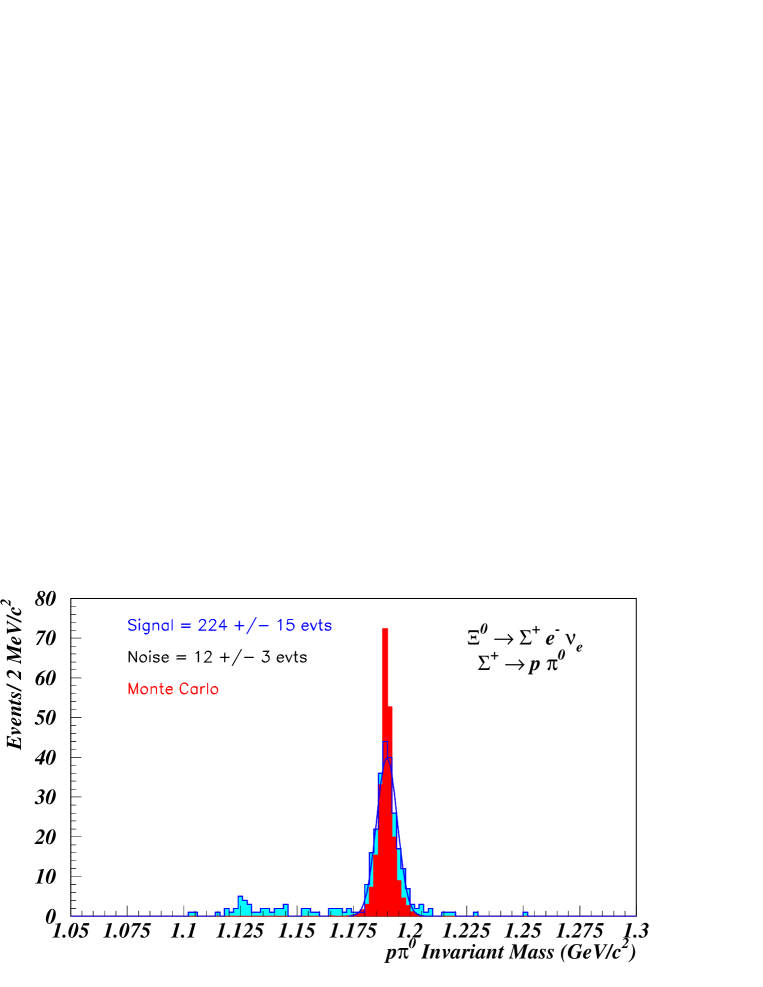
The beta decay, with , has been observed for the first time by KTeV. The asymmetry of the electron is particularly interesting, as it offers a fundamental test of the V-A structure of the weak interaction. We have looked for double vertex events where there is a reconstructed from a proton and a ( mass constrained) downstream of the vertex formed by an electron track and the ‘track’ from the reconstructed . Figure 3 shows the reconstructed mass (with a Monte Carlo overlay). Work is progressing toward obtaining a branching ratio, normalizing to . Asymmetry measurements will also eventually be made.
1.4.3 Search for the supersymmetric R0
A search for a light gluino, called the R0, through its dominant decay mode R with , has been performed on a one-day E832 data sample. This search is motivated by recent predictions in the literature [11][12]. The photino in this SUSY scenario is a cold dark matter candidate. This is the first time a direct search for such a decay has been performed. Figure 4 shows the invariant mass distribution for the data (solid) and an R0 Monte Carlo (dashed). The R0 search region is above 650 MeV/c2. With one day’s data, we are sensitive to an R0 mass between 1.5 - 4.5 GeV/c2 and an R0 lifetime between 1 - 5000 ns, with an R production ratio below to 2.5x and an upper limit on the R0 production cross section times branching ratio of the order of cm2/(GeV2/c3) at =0.1. Since this search is quite clean, more data will be analyzed for this mode in the near future.

1.4.4 Preliminary result for from KTeV 97 special run
The best published limit to date for the decay is (90% CL) from Fermilab experiment E799-I [5]. One of KTeV’s many goals was to extend this limit by several orders of magnitude.
Although the best limit for from KTeV in the 1997 run will come from the full analysis of the Dalitz mode, we are also investigating the 2 decay mode. The 2 mode provides us with more than two orders of magnitude higher sensitivity per unit time, but at the cost of increased background due to fewer kinematical constraints. This study is an important input to the design of the KAMI detector.
To understand the type and level of backgrounds we will ultimately be confronted with in KAMI, a special half-day of data was taken in December 1996. During this special run, one beam was further collimated down to 4 cm x 4 cm (at the CsI) in order to obtain better resolution on the decay. The second beam was completely closed off. From a preliminary analysis, we have obtained an upper limit on the branching ratio of 1.8 x at a 90% CL [8]. This represents a factor of 30 improvement over the best existing limit, obtained by E799-I using the Dalitz decay mode of the .
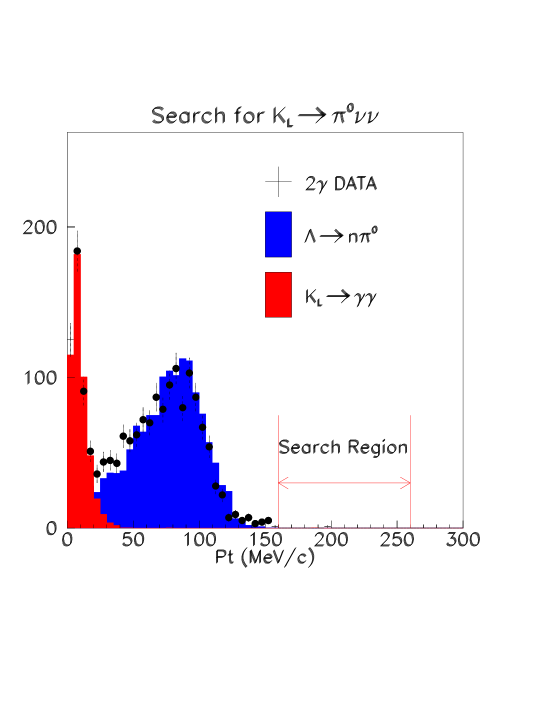
Figure 5 shows the distribution of candidate events after the final cuts. As is shown here, the observed distribution can be well reproduced by and . For values above 160 MeV/c2, one event still remains. This event is consistent with a neutron or interaction in the detector. This understanding is based on detailed studies of beam interactions in the vacuum window using KTeV data. From these studies we know that these interactions are the source of high- s which strike the CsI calorimeter. This will not be a source of background for KAMI as the neutral beam will see only vacuum until it encounters the vacuum window immediately upstream of the CsI calorimeter.
1.4.5 at KTeV 99
KTeV expects to run for a second time in 1999 [23]. The kaon flux from the combined FY97 and FY99 runs will allow us to complete our measurement of and to reach our proposed sensitivities for a wide array of rare decay modes. It will also play a significant role in helping us to plan for KAMI.
In order to study the decay mode using , we have proposed a dedicated run with a single small beam, similar to the short study done by KTeV at the end of 1996 [23]. This short run has resulted in the best limit to date, as reported in the previous section.
Table 2 summarizes the expected single event sensitivity(SES) with four weeks of running time, projected from half a day of data taken in December 1996. We expect to achieve a sensitivity of with the same beam size used for the 1996 run (4 cm x 4 cm at the CsI).
Since the KTeV Letter of Intent for the FY99 run was submitted in June of 1997, we have performed extensive Monte Carlo simulations of the expected background level. Table 3 summarizes the results. The interaction of beam neutrons with the detector is likely to be the most serious background, as was the case in the 1996 data. This background can be reduced by detecting the beam neutrons. An hadronic section of the Back-Anti, six nuclear interaction lengths deep, will be installed just downstream of the existing EM section of the Back Anti in order to address this issue. With a 99% detection efficiency for the beam neutron, we expect that this background will appear around a sensitivity level of , as shown in Table 3.
| KTeV 97 | KTeV 99 | Improvement | |
| Proton Intensity | 3.33 | ||
| Repetition Cycle | 60 sec. | 80 sec. | 0.75 |
| Beam Size | 4.0 x 4.0 cm2 | 4.0 x 4.0 cm2 | 1.00 |
| Running Time | 11 hours | 4 weeks | 61.1 |
| Improvement(KTeV 99/KTeV 97) | 150 | ||
| SES | 4.6 x | 3.0 x | |
| (no conversion) | (4.4 x | ||
| (with at least one conversion) | (1.0 x |
In order to further distinguish signal events from this type of background, we are also considering the possibility of using an active photon converter located between the vacuum window and the first drift chamber. This will provide verification that the decay originated within the fiducial volume of the detector. The converter will also improve the kinematical constraints on the decay, allowing for reconstruction of the invariant mass, which should help in rejecting other types of backgrounds.
A converter, consisting of a 1 mm thick lead sheet sandwiched between two sheets of scintillator, will convert at least one photon from a decay 30% of the time. Thus, the expected sensitivity when at least one gamma converts will be about , as given in Table 2.
| Decay Mode | Background Level |
|---|---|
| nA A |
1.5 Future prospects
Because of the tremendous physics importance associated with the decay , dedicated searches have been proposed at BNL [13] and KEK [14] along with our proposal to focus on this mode in KAMI.
The BNL group proposes to execute the experiment using a micro-bunched proton beam with a 45 degree targeting angle to produce a kaon beam with a mean momentum of 700 MeV/c. The low kaon momentum allows for a measurement of the momentum of the decaying using time-of-flight. Sufficient kinematical constraints are available in order to reconstruct all four-vectors, including those of the missing neutrinos. The timescale for the BNL experiment is similar to the timescale for KAMI and the sensitivity expected by the BNL group is also similar to that expected by KAMI.
The KEK experiment is very similar to KAMI conceptually in that extremely good photon veto efficiency is required. It is expected that a sensitivity of will be achieved by 1999 during the first phase of the experiment, using the existing 12 GeV proton machine at KEK. The ultimate goal of this group is to perform this measurement with a new 50 GeV high-intensity machine, JHP, which is expected to be operational in 2003.
2 The KAMI Experiment
The next major step in the continuing neutral kaon program at Fermilab will be KAMI (Kaons At the Main Injector). As in the case of each previous effort, KAMI will benefit greatly from our experience with its predecessor; in this case KTeV. KTeV’s success gives us every reason to be optimistic about the prospects for KAMI.
2.1 Detector concepts
A clear observation of the decay will be the highest priority for KAMI. The KAMI detector must be optimized with this principle in mind. At the same time, we would like to explore other important rare decay modes such as and . In order to achieve these physics goals with minimum investment, the KAMI detector has been designed according to the following principles:
-
1.
Utilize the existing KTeV infrastructure to the greatest extent possible. This includes the experimental hall, the CsI calorimeter, and significant parts of the readout electronics and the DAQ system.
-
2.
For , install newly constructed hermetic photon veto detectors.
-
3.
For charged decay modes, and to maintain our ability to calibrate the CsI calorimeter to the required accuracy, insert scintillating fiber tracking planes inside of the vacuum tank. The vacuum tank will pass through the gap of the analysis magnet.
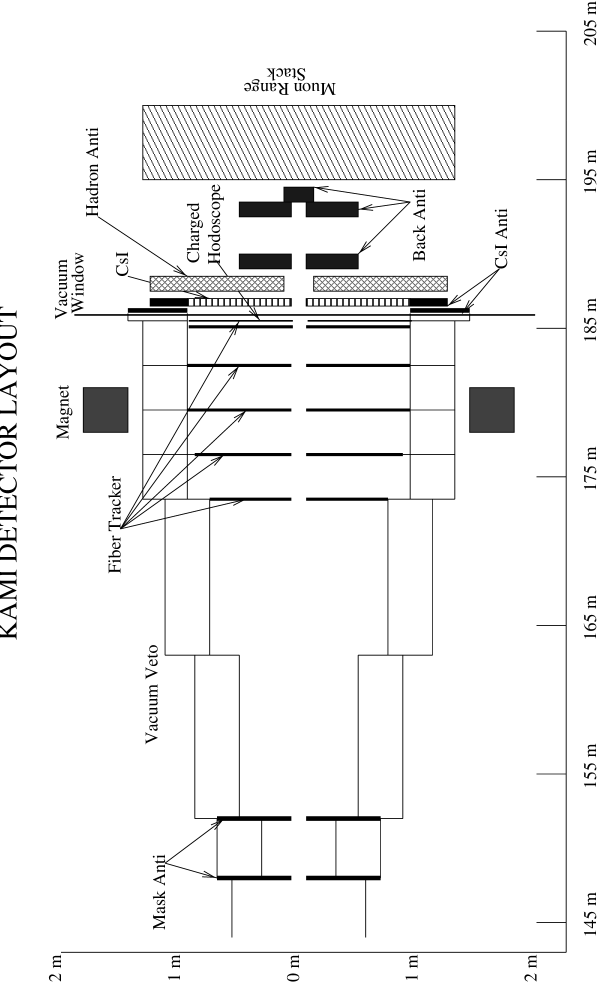
Figure 6 shows the layout of a possible detector design based on the above concepts.
With a 24 mrad targeting angle, the average momentum of decaying kaons will be between 10-15 GeV, depending on the distance of the decay volume from the production target. This is about a factor of five lower than the kaon spectrum at KTeV and is due primarily to the lower beam energy of the Main Injector.
Because of the lower energy kaons in KAMI, the overall detector geometry must be compressed longitudinally in order to maintain good acceptance. The fiducial decay region for will be about 21 m long. The following 12 m of the decay volume contains a charged particle spectrometer. The most striking feature is that the inner wall of all of the vacuum pipes are lined with an hermetic system of photon veto detectors.
2.2 Physics sensitivity
The signal sensitivity for is determined by the kaon flux, geometrical acceptance and effective running time. In order to achieve a high sensitivity, the large flux associated with a large beam size is desirable. However, in order to obtain good resolution for the reconstruction of , the transverse beam size must be restricted. We have tuned the beam size in order to collect at least 30 signal events per year (Standard Model BR assumed) while maintaining the required resolution.
Table 4 lists the sensitivities expected by KAMI as well as for proposed experiments at BNL and KEK. For comparison, the sensitivity at KTeV is also listed for the decay mode. Two possible scenarios are listed for KAMI; KAMI-Far and KAMI-Near. KAMI-Far uses the existing KTeV production target and neutral beam line with minor modifications, where as KAMI-Near requires a new target station located 120 m downstream of the existing target station. This allows for a higher kaon flux per unit physical beam size at the calorimeter. The obvious advantage of the KAMI-Far scenario is the cost savings, as well as the reduction of lambda decay induced backgrounds such as .
| KTeV 97 | KTeV 99 | KAMI-Far | KAMI-Near | BNL | KEK | |
| Proton Energy | 800 GeV | 800 GeV | 120 GeV | 120 GeV | 24 GeV | 13 GeV |
| Intensity/pulse | ||||||
| Repetition cycle | 60 s | 80 s | 2.9 s | 2.9 s | 3.6 s | 4.0 s |
| Flat top | 20 s | 40 s | 1.0 s | 1.0 s | 1.6 s | 2.0 s |
| Targeting angle | 4.8 mrad | 4.8 mrad | 24 mrad | 24 mrad | 45 deg | 6 deg |
| Beam x width | 0.22 mrad | 0.22 mrad | 0.6 mrad | 1 mrad | 4 mrad | 4 mrad |
| Beam y width | 0.22 mrad | 0.22 mrad | 0.6 mrad | 1 mrad | 125 mrad | 4 mrad |
| Beam solid angle | 0.048 str | 0.048 str | 0.36 str | 1 str | 500 str | 16 str |
| Kaons/pulse | ||||||
| Kaon flux at BA | 0.3 MHz | 0.6 MHz | 28 MHz | 110 MHz | 150 MHz | 0.75 MHz |
| Neutron flux/pulse | ||||||
| Neutron flux at BA | 0.8 MHz | 1.2 MHz | 200 MHz | 550 MHz | 5 GHz | 1.2 MHz |
| Ave. kaon mom. | 70 GeV/ | 70 GeV/ | 13 GeV/ | 10GeV/ | 0.7 GeV/ | 2 GeV/ |
| Z decay region | 38 m | 38 m | 34 m | 34 m | 3.5 m | 2.7 m |
| Decay probability | 2.1% | 2.1% | 10% | 10% | 16% | 4.3% |
| Kaon decay /pulse | ||||||
| Kaon decay /sec | 7.1 kHz | 12 kHz | 2.8 MHz | 8.2 MHz | 25 MHz | 32 kHz |
| Running time | 0.46 day | 28 days | 365 days | 365 days | 365 days | 84 days |
| DAQ live time | 0.65 | 0.65 | 0.65 | 0.65 | 0.65 | 0.65 |
| Live time | 0.7 | 0.7 | 0.7 | 0.7 | 0.7 | 0.7 |
| Kaon decays/day | ||||||
| Total kaon decay | ||||||
| Acceptance | 5% | 5% | 7.1% | 7.4% | 1.6% | 8% |
| Single Event Sens. | ||||||
| No. of | 0.01 | 30 | 124 | 37 | 0.06 |
| KTeV 97 | KTeV 99 | KAMI-Far | KAMI-Near | |
| Proton Energy | 800 GeV | 800 GeV | 120 GeV | 120 GeV |
| Intensity/pulse | ||||
| Repetition cycle | 60 s | 80 s | 2.9 s | 2.9 s |
| Flat top | 20 s | 40 s | 1.0 s | 1.0 s |
| Targeting angle | 4.8 mrad | 4.8 mrad | 8 mrad | 8 mrad |
| Beam x width | 0.5 mrad | 0.6 mrad | 0.6 mrad | 2.5 mrad |
| Beam y width | 0.5 mrad | 0.6 mrad | 0.6 mrad | 2.5 mrad |
| Beam solid angle | 0.5 str | 0.72 str | 0.36 str | 6.3 str |
| Kaon production/pulse | ||||
| Average kaon momentum | 70 GeV/ | 70 GeV/ | 21 GeV/ | 15GeV/ |
| Z decay region | 38 m | 38 m | 23 m | 23 m |
| Decay probability | 2.1% | 2.1% | 10% | 10% |
| Kaon decay /pulse | ||||
| Kaon decay /sec | 0.45 MHz | 0.82 MHz | 7.1 MHz | 120 MHz |
| Running time | 98 days | 112 days | 365 days | 365 days |
| DAQ live time | 0.65 | 0.65 | 0.65 | 0.65 |
| Live time | 0.7 | 0.7 | 0.7 | 0.7 |
| No. of kaon decays/day | ||||
| Total Kaon Decays | ||||
| (Br= exp’d) | ||||
| Acceptance | 5.2% | 5.2% | 2.1% | 2.1% |
| Single Event Sens. | ||||
| No. of events | 0.1 | 0.5 | 4 | 64 |
| (Br= exp’d) | ||||
| Acceptance | 5.5% | 5.5% | 2.4% | 2.4% |
| Single Event Sens. | ||||
| No. of events | 0.04 | 0.1 | 0.8 | 15 |
| (Br=) | ||||
| Acceptance | 1.7% | 1.7% | 0.7% | 0.7% |
| Single Event Sens. | ||||
| No. of events | 2500 | 7700 | 64 k | 1.1 M |
| Acceptance | 5.4% | 5.4% | 2.3% | 2.3% |
| Single Event Sens. | ||||
| (Br=) | ||||
| Acceptance | 27% | 27% | 10% | 10% |
| Single Event Sens. | ||||
| No. of events | 1.1 k | 3.4 k | 25 k | 427 k |
| (Br=) | ||||
| Acceptance | 21% | 21% | 10.8% | 10.8% |
| Single Event Sens. | ||||
| No. of events | 0.4 | 1 | 11 | 197 |
As indicated in Table 4, KAMI-Far is sensitive enough to detect 30 events per year. After three years of operation, we expect to have on the order of 100 signal events. With KAMI-Near, more than 100 signal events could be collected within one year. Since this branching ratio is proportional to , the statistical error on 100 events corresponds to an accuracy of 1/2 = 5% on , assuming no background. A detailed study of background levels is given in Section 6.
Table 5 shows the sensitivity for some charged decay modes. Here, we assume a more aggressive 8 mrad targeting angle (instead of 24 mrad) in order to obtain the highest sensitivity possible. Generally speaking, KAMI-Far is more than a order of magnitude improvement over KTeV, and KAMI-Near could add another order of magnitude improvement in sensitivity. As shown in the table, the kaon flux at KAMI-Near will reach levels exceeding 100M decays per second. This will result in a sensitivity of better than per year for most of the charged decay modes.
3 Neutral Kaon Beam at the Main Injector
3.1 Primary proton beam
A study for modifying a limited portion of the 800 GeV Switchyard to run 120 GeV protons from the Main Injector was recently completed [15]. This effort describes the work needed to deliver 120 GeV protons to the Meson Area and KAMI. The optics for KAMI require the addition of 3(4) quadrupole doublets in existing beamline enclosures for the KAMI-Far (Near) targets in NM2 (NM3). This report emphasizes the need to complete the installation of beamline elements for 120 GeV running in the upstream portion of the Switchyard before the start of the TeVatron 1999 fixed target run. This would allow confirmation of the phase space occupied by the proton beam from the Main Injector well before the final installation of the downstream portions of the new 120 GeV beamlines. In addition, it appears feasible to transport low-intensity 120 GeV protons to KTeV during the 1999 run without changes to the 800 GeV KTeV primary beamline. Losses on two of the dipoles in the beamline restrict high intensity running [16].
To best utilize the full intensity available from the Main Injector, KAMI is being designed to operate in a debunched beam. Debunching of the RF structure of the Main Injector allows a uniform spill structure, improving the ability of the KAMI detector to handle high rates. Discussions with the Main Injector experts indicate debunching is feasible but care must be taken with beam loading effects [17].
3.2 Target station and neutral beamline
The KAMI-Far option uses the existing KTeV NM2 target station and neutral beamline [19]. The last three dipoles just upstream of the KTeV target would need to be modified to provide a steeper targeting angle. An additional 1.5 ft. of earth shielding would be required over NM2.
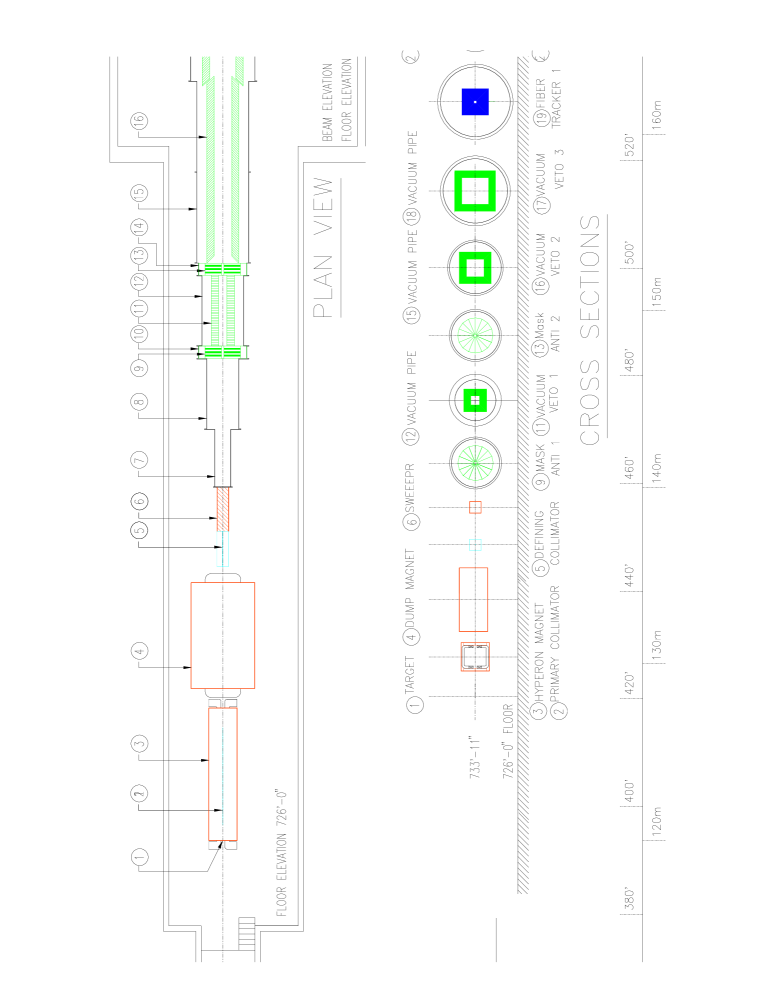
The KAMI-Near option requires a new target station located in NM3. The KTeV beam and experimental hall design included sufficient transverse space for shielding a KAMI target station in NM3 and the building has a “shelf” on which crane rails can be installed. The design of a near target station for 120 GeV was first considered in the KAMI CDR [17]. It consists of a production target, a “hyperon” sweeper magnet, a magnetized proton dump, a beam defining collimator, and a final sweeper dipole as shown in Figure 9. Many of the existing KTeV target station elements will be reused. Much work remains to optimize these concepts and to incorporate our experience from KTeV.
Table 6 summarizes the kaon and neutron flux as well as the average momentum of decaying kaons for various targeting angles ranging from 8 to 24 mrad. The flux is normalized in units of per incident proton, and per str solid angle. In this flux estimation, we have assumed a 3 inch thick lead absorber to reduce the photon flux, as is the case in KTeV. A 20 inch thick Be absorber was used in KTeV during E832 data taking to improve the neutron/kaon ratio, but is not considered in this table. The Be absorber would attenuate the neutron and kaon flux by a factor of 0.19 and 0.35, respectively.
| Targetting angle | 8mrad | 12mrad | 16mrad | 24mrad |
|---|---|---|---|---|
| Kaon flux (/proton/str) | ||||
| at m | 9.05 | 7.50 | 6.12 | 4.37 |
| at m (KAMI-Near) | 8.21 | 6.62 | 5.39 | 3.78 |
| at m (KAMI-Far) | 6.47 | 5.06 | 3.98 | 2.60 |
| Neutron flux (/proton/str) | 184. | 79.8 | 43.1 | 18.6 |
| Neutron/Kaon ratio (at m) | 20.3 | 10.6 | 7.0 | 4.3 |
| Kaon average momentum (GeV/) | ||||
| Generated kaon | 27.1 | 23.1 | 19.8 | 15.4 |
| Decayed at KAMI-Near | 15.4 | 13.6 | 12.1 | 10.1 |
| Decayed at KAMI-Far | 20.5 | 18.0 | 16.1 | 13.4 |
| Neutron average momentum (GeV/) | 48.9 | 36.4 | 27.8 | 18.3 |
The kaon flux and momentum spectrum are calculated using the Malensek parametrization [20]. The momentum spectra for both neutrons and kaons at various targeting angles are shown in Fig. 7.

The kaon momenta are presented in three different ways in Table 6 and Fig. 7: the momentum of kaons generated at the target; the momentum of kaons which decay in the KAMI-Far configuration; and the momentum of kaons which decay in the KAMI-Near configuration. The spectrum for KAMI-Near is softer because lower energy kaons will decay closer to the production target.
The neutron spectrum in Fig. 7 has been generated using the parametrization of Edwards et al. [21]. The forward neutron production has been modified with a dependence from Engler et al. [22]. The flux predicted by this generator was a factor of 5.7 too low compared to the value measured in KTeV. We have therefore decided to multiply the simulated flux by this factor in order to be conservative.
Currently, we are studying the beam profile which results from the existing KTeV collimator system. Fig. 8 shows the Kaon beam profile reconstructed from events in E832. (One should note that KTeV has two parallel beams.) The beam halo is a possible source of accidental background. We are currently studying data from KTeV to better understand the origin of the beam halo and possible ways in which it might be further reduced.

4 The KAMI Detector
4.1 Overall geometry
The detector geometry is primarily governed by the stringent requirement of photon rejection efficiency, which must be fully hermetic along the entire kaon decay volume.
The most upstream section is a 5 m long veto region which is surrounded by the two Mask Anti detectors and vacuum photon veto detectors to reject all upstream decays. This section is followed by a 21 m long fiducial region, again completely covered by vacuum photon veto detectors located inside of the vacuum tank.
The next 12 m contains a charged spectrometer, consisting of five fiber tracking modules, a wide-gap analyzing magnet, and four sections of photon veto detectors. A charged hodoscope is located downstream of the last tracking module, followed by a vacuum window.
The KTeV pure CsI calorimeter will be re-used and will sit just downstream of the vacuum window. The gap between the vacuum window and the CsI is filled by two sets of CsI Anti counters to cover any cracks between the vacuum veto system and the CsI. Behind the CsI, the neutral beam is dumped onto a beam-hole calorimeter known as the Back Anti, designed to veto photons going down the CsI beam hole. Finally, there are multiple layers of iron shielding and muon counters for muon identification.
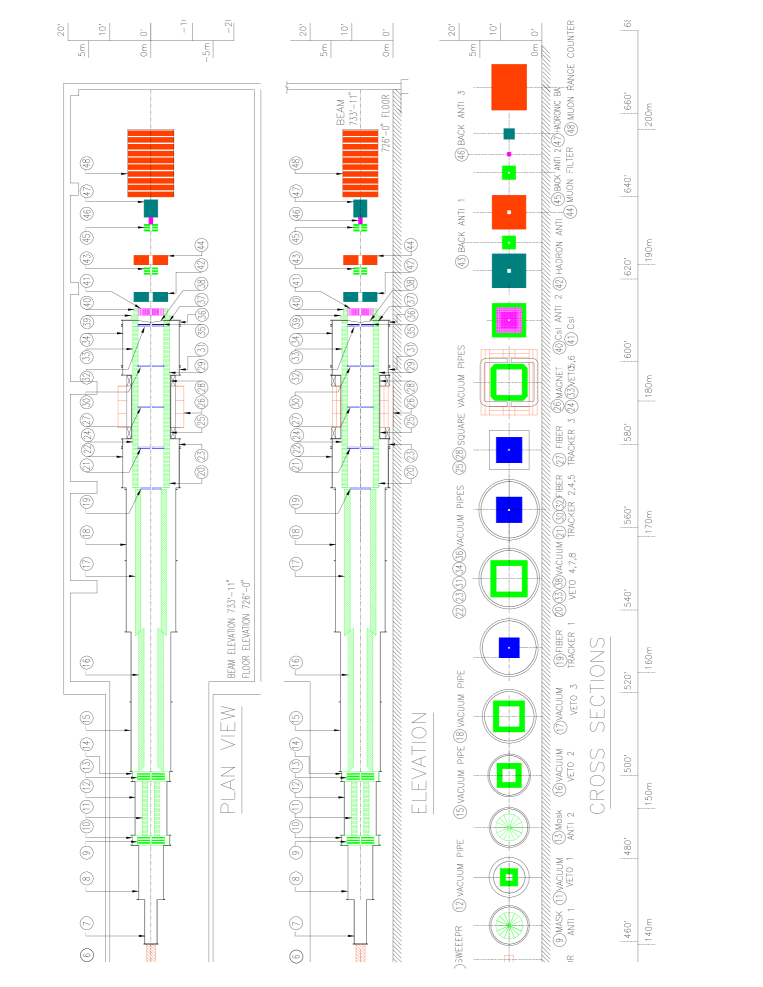
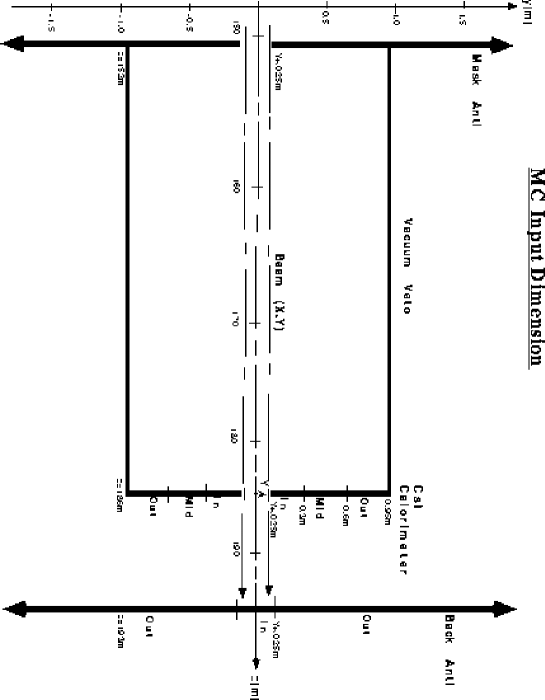
Figure 9 and Figure 10 are detailed schematics of the upstream and downstream sections of the detector. The neutral beam line for the KAMI-Near option is also shown in Figure 9. Table 7 shows the locations of all the detector elements.
| z(up) | z(down) | x(in) | x(out) | y(in) | y(out) | |
| (m) | (m) | (m) | (m) | (m) | (m) | |
| [KAMI-Far] | ||||||
| Production target | 0.00 | 0.30 | - | 0.0015 | - | 0.0015 |
| Primary collimator | 9.60 | 11.60 | - | 0.0029 | - | 0.0029 |
| Defining collimator | 85.00 | 88.00 | - | 0.0255 | - | 0.0255 |
| [KAMI-Near] | ||||||
| Production target | 120.00 | 120.30 | - | 0.0015 | - | 0.0015 |
| Primary collimator | 120.40 | 128.00 | - | 0.0043 | - | 0.0043 |
| Defining collimator | 135.50 | 137.50 | - | 0.0078 | - | 0.0078 |
| Mask Anti 1 | 147.30 | 148.00 | 0.07 | 0.70 | 0.07 | 0.70 |
| Vacuum Veto 1 | 148.00 | 153.00 | 0.25 | 0.65 | 0.25 | 0.65 |
| Mask Anti 2 | 152.00 | 152.70 | 0.07 | 0.70 | 0.07 | 0.70 |
| Vacuum Veto 2 | 152.70 | 163.00 | 0.50 | 0.90 | 0.50 | 0.90 |
| Vacuum Veto 3 | 163.00 | 173.50 | 0.75 | 1.15 | 0.75 | 1.15 |
| Fiber Tracker 1 (x/y) | 173.50 | 173.60 | 0.07 | 0.70 | 0.07 | 0.70 |
| Vacuum Veto 4 | 173.60 | 176.50 | 0.95 | 1.35 | 0.85 | 1.35 |
| Fiber Tracker 2 (x/y) | 176.50 | 176.60 | 0.07 | 0.85 | 0.07 | 0.85 |
| Vacuum Veto 5 | 176.60 | 179.50 | 0.95 | 1.35 | 0.95 | 1.35 |
| Magnet (gap) | 178.00 | 181.00 | - | 1.45 | - | 1.45 |
| Fiber Tracker 3 (x) | 179.50 | 179.60 | 0.07 | 0.95 | 0.07 | 0.95 |
| Vacuum Veto 6 | 179.60 | 182.50 | 0.95 | 1.35 | 0.95 | 1.35 |
| Fiber Tracker 4 (x/y) | 182.50 | 182.60 | 0.07 | 0.95 | 0.07 | 0.95 |
| Vacuum Veto 7 | 182.60 | 185.50 | 0.95 | 1.35 | 0.95 | 1.35 |
| Fiber tracker 5 (x/y) | 185.50 | 185.60 | 0.07 | 0.95 | 0.07 | 0.95 |
| Charged Hodoscope | 185.60 | 185.65 | 0.07 | 0.95 | 0.07 | 0.95 |
| Vacuum Veto 8 | 185.70 | 185.90 | 0.95 | 1.45 | 0.95 | 1.45 |
| Vacuum window | 185.90 | 185.95 | - | 1.95 | - | 1.95 |
| CsI Anti 1 | 186.05 | 186.30 | 0.95 | 1.45 | 0.95 | 1.45 |
| CsI Anti 2 | 186.30 | 186.70 | 0.95 | 1.25 | 0.95 | 1.25 |
| CsI | 186.30 | 186.80 | 0.075 | 0.95 | 0.075 | 0.95 |
| Hadron Anti | 187.30 | 188.00 | 0.15 | 1.25 | 0.15 | 1.25 |
| Back Anti 1 | 189.30 | 189.80 | 0.075 | 0.50 | 0.075 | 0.50 |
| Muon Filter | 190.00 | 190.70 | 0.15 | 1.25 | 0.15 | 1.25 |
| Back Anti 2 | 192.50 | 193.00 | 0.075 | 0.50 | 0.075 | 0.50 |
| Back Anti 3 (Pb/Quartz) | 193.00 | 193.50 | - | 0.15 | - | 0.15 |
| Hadronic BA | 193.50 | 194.80 | - | 0.50 | - | 0.50 |
| Muon range counter | 195.00 | 200.00 | - | 1.70 | - | 1.30 |
4.2 CsI calorimeter
The KTeV CsI calorimeter is the most advanced, high-precision electromagnetic calorimeter currently in use. The calorimeter consists of 3100 pure CsI crystals and is described in detail in Section 5.1. The crystals are read out using photomultiplier tubes and the signals are digitized at the PMT base in 19 ns time slices, in synch with the RF structure of the beam. The digitizer is a multi-ranging device with 16 bits of dynamic range in the form of an 8-bit mantissa and a 3-bit exponent. The noise per channel is about 0.8 MeV. The energy resolution of the calorimeter is better than 1% over the energy region of 5 - 100 GeV. Resolution at this level will be necessary in KAMI in order to reject backgrounds to decays such as and .
Because the KAMI beam will likely be debunched with no real RF structure, the digitization scheme for the readout electronics will have to be modified. Additionally, the array will have to be re-stacked from the two beam hole configuration currently used by KTeV to the single beam hole configuration (15 cm 15 cm) required by KAMI. No additional modifications should be necessary.
4.3 Photon veto detectors
One of the most challenging detector issues facing KAMI is the efficient detection of all photons produced by background events along the 34 m long vacuum decay region. Complete hermeticity and efficient photon detection down to energies as low as a few MeV is required.
The inefficiency at low energy is dominated by sampling effects, where a fraction of the shower electrons are absorbed in the lead, while at high energy it is more dominated by photonuclear absorption. In the latter case, it is possible for a photon to experience a photonuclear absorption interaction before it begins to shower. If all of the secondary products in the interaction are neutrons, the interaction may escape detection. Photonuclear absorption has been studied extensively in the past in various energy regions [14].
A photon veto detector for KAMI will likely be based on the existing KTeV veto design. However, in order to improve detection efficiency for low energy photons, both finer sampling and more scintillation light are required. The cost of such a detector is of primary concern and a good deal of effort has gone into designing a low-cost device.
As discussed in Section 5.2, a GEANT simulation of a possible photon veto design shows that with 1 mm lead sheets and 5 mm thick scintillator tiles, better than 80% detection efficiency for photons with energies between 2-20 MeV can be achieved. For high energy photons, photonuclear absorption effects need to be taken into account. More detailed study is still necessary.
The photon veto system for KAMI consists of three major elements; the Mask Anti, the vacuum veto and the Back Anti. Each detector system is described in the following sections.
4.3.1 Mask Anti detector
Background events from upstream decays must be rejected by the active mask photon detector, called the Mask Anti (MA). A detailed simulation of backgrounds originating from decays indicates the need for two stages of detector, as shown in Figure 6 and Figure 10. Each Mask Anti detector is a 20 radiation length deep sampling calorimeter, consisting of alternating layers of 1 mm thick lead sheets and 5 mm thick scintillator sheets.
4.3.2 Vacuum veto detector
The vacuum veto is a fine sampling calorimeter consisting of 1 mm thick lead sheets and 5 mm thick plastic scintillator. All of the materials are located on the inside wall of the vacuum tank to avoid any dead material at the boundary of the tank and the veto detector.
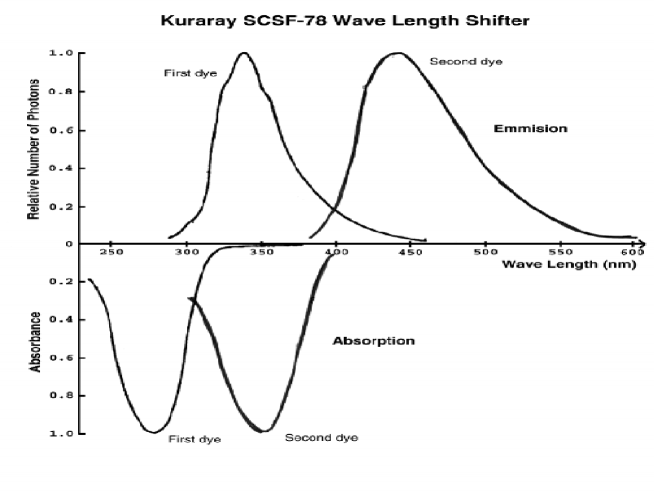
Wave length shifting fibers are inserted in the scintillator to efficiently collect photons and to transport them to photomultipliers which are to be mounted outside of the vacuum tank for easy access. We are investigating the possibility of using the two wave length shifting dyes which are used in Kuraray SCSF78 scintillator. The absorption and emission spectrum of two dyes are shown in Figure 11. We plan to use the first dye in the scintillator plates, and the second dye in the scintillator fibers.
At 20 cm intervals in the z direction, about 8000 WLS fibers will be bundled together and viewed by 2-3 inch PMTs at both ends of the fibers. In and near the spectrometer magnet, fine mesh photomultipliers must be used. Signals from both ends of the fibers will be meantimed for better timing resolution.
The lead sheets in the vacuum veto modules will be tilted by 45 degrees relative to the beam direction (z-axis) in the fiducial decay region to provide the best sampling ratio for 45 degree incident photons and to avoid any cracks for angles of incidence up to 90 degrees. Table 8 shows the sampling ratio and total depth as a function of the opening angle of photons.
| Photon opening | Sampling | Total | Total |
|---|---|---|---|
| angle (degree) | frequency (mm) | depth () | depth () |
| 0 | 1.41 | (Infinite) | (Infinite) |
| 5 | 1.31 | 138 | 4.3 |
| 10 | 1.22 | 69 | 2.3 |
| 15 | 1.15 | 46 | 1.5 |
| 20 | 1.10 | 35 | 1.2 |
| 30 | 1.04 | 24 | 0.8 |
| 45 | 1.00 | 16.9 | 0.56 |
| 60 | 1.04 | 13.8 | 0.46 |
| 75 | 1.15 | 12.4 | 0.41 |
| 90 | 1.41 | 12.0 | 0.40 |
For high energy photons (above 1 GeV), the inefficiency of the vacuum vetos must be smaller than to reduce the number of background events to a manageable level. As mentioned previously, a small fraction of photons will undergo a photonuclear interaction and produce only neutrons. As shown in Table 8, the proposed vacuum veto detector has multiple nuclear interaction lengths for shallow-angle, high-energy photons. This should allow detection of secondary neutrons and minimize the inefficiency which results from photonuclear interactions.
In Table 9, the vacuum veto counters are compared to the photon veto detectors for KTeV and BNL-E787. The KAMI design is based on the same WLS fiber readout scheme as KTeV, but has the same fine sampling ratio as BNL-E787.
Currently, inexpensive scintillator is under investigation by the MINOS Collaboration. By extruding polystyrene, the cost can be reduced by an order of magnitude compared to the conventional commercial product. D0 has already made such extruded scintillator for their pre-shower detector. Table 10 summarizes the scintillator types and performance for D0, MINOS and KAMI.
| KTeV | BNL-E787 | KAMI | |
|---|---|---|---|
| Lead sheet thickness | 2.8 mm | 1 mm | 1 mm |
| Scintillator thickness | 2.5 mm | 5 mm | 5 mm |
| Total Depth | 16 | 14.3 | 20 |
| Number of Layers | 24-32 | 75 | 100 |
| Light Guide | WLS fiber | Clear light | WLS fiber |
| (1 mm | pipe | (1 mm | |
| single clad | double clad | ||
| 3 cm spacing) | 1-2 cm spacing) | ||
| No. of p.e. /MIP/layer | 2.4 pe | 10 pe | 10 pe |
| No. of p.e. /MIP | 60 pe | 750 pe | 1000 pe |
| No. of p.e. /MeV | 0.3 pe/MeV | 5 pe/MeV | 5 pe/MeV |
| D0 | MINOS | KAMI | |
|---|---|---|---|
| Cross section | Triangle | Rectangular | Rectangular |
| 5 mm x 9 mm | 1 cm x 2 cm | 2 cm x 5 mm | |
| Length | 2.8 m | 8 m | 2 m |
| WLS fiber | 0.84 mm | 1 mm | 1 mm |
| Type of WLS | 3HF | BCF91 | SCSF78 |
| Emission lambda | 550 nm | 520 nm | 450 nm |
| Photo detector | VLPC | PMT | PMT |
| (QE=60%) | (QE=12%) | (QE=25%) | |
| No. of p.e. /MIP/layer | 15 p.e. | 8 p.e. (at 2m) | 10 p.e. exp’d |
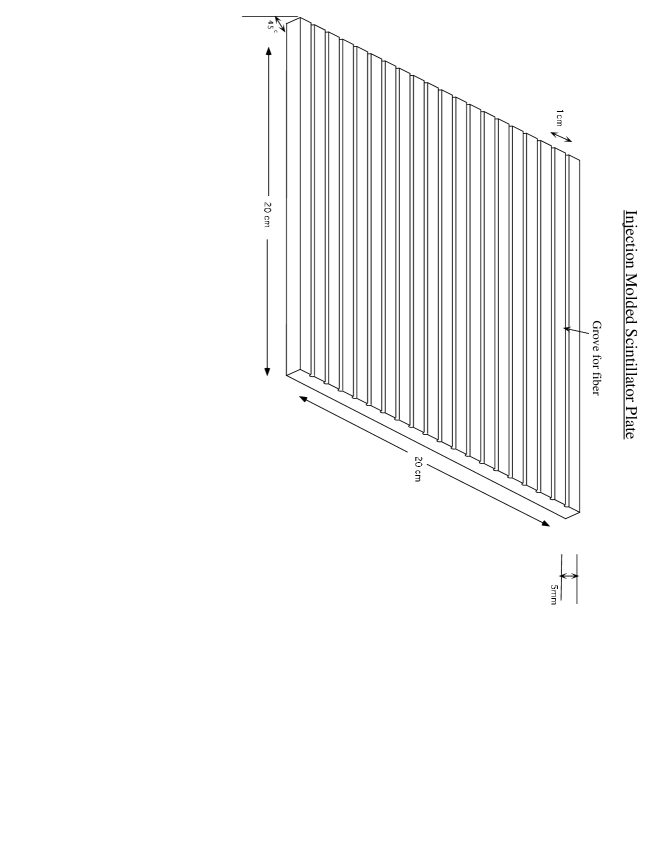
Another possibility is to use injection molded scintillator. The PHOENIX collaboration at BNL has developed scintillating tile for their Shashulik Calorimeter using this technology. KEK’s group is also developing such scintillator for a similar veto system. A schematic of a typical scintillator is shown in Fig 12.
4.3.3 Back Anti detector
The Back Anti resides in the neutral beam and detects photons which pass through the beam hole of the CsI calorimeter. Due to the high counting rate and high radiation dose at this position, a very fast, radiation hard calorimeter is necessary. One well-established, radiation hard material is quartz. We are considering a tungsten/quartz fiber, or tungsten/quartz plate sampling calorimeter as our base design. This area will be exposed to 200 - 500 MHz of neutron interactions. In order to distinguish photon interactions from neutron interactions, it is extremely important to make the Back Anti as transparent to neutrons as possible. Using a Cherenkov radiator such as quartz will help in this regard. The current design has four layers of longitudinal segmentation and allows for different thresholds to be applied to each region. An hadronic section of the Back Anti could be installed just behind the electromagnetic section if it were determined that this would be useful.
In order to detect photons which pass through the CsI beam hole but which miss the Back Anti, additional veto counters are installed immediately upstream of the Back Anti. These counters will be constructed similar to the Mask Anti.
4.3.4 CsI Anti detector
The gap between the vacuum window and the CsI calorimeter must be filled by additional photon veto detectors in order to plug any possible cracks which photons might pass through. These are known as the CsI Anti detectors. There are two stages of CsI Anti; a small one inside of the blockhouse which houses the CsI, and a large one just upstream of the blockhouse. Due to the limited space available inside of the blockhouse, only a 20 cm ring outside of the CsI can be covered. This is not large enough to detect all of the photons which escape through the end of the vacuum tank. Therefore, another veto detector with a larger outer dimension must be installed between the vacuum window and the blockhouse. The CsI Anti for KAMI is very similar to the one currently in use by KTeV except for its finer sampling thickness and larger volume. The KAMI CsI Anti consists of 1 mm thick lead sheets and 2.5 mm thick plastic scintillators built into modules which are 25 cm (13 ) deep due to the limited space available in the CsI blockhouse.
4.4 Charged particle spectrometer
The KAMI charged particle spectrometer consists of the KTeV spectrometer magnet and five tracking stations consisting of scintillating fiber planes. The spectrometer is described in detail below.
4.4.1 Scintillating fiber tracker
The KAMI tracking detectors are made from 500 m diameter scintillating fibers. There are a total of 5 modules, spaced at 3 m intervals. Four of the five modules are identically constructed of four sets of fiber planes in an x/x′ y/y′ configuration. The fifth module is located at the middle of the magnet for redundant measurement of momentum and to reject background events with a kink. This is especially important in rejecting and backgrounds to two lepton decay modes such as and . This module has only x/x′ planes in order to minimize the thickness of material.
Visible Light Photon Counters (VLPC) are currently under consideration for the fiber readout. The high quantum efficiency of VLPC detectors (60%) make them particularly attractive, although they must operate at liquid Helium temperature.
The fibers may be read out at just one end or both ends. In the former case, the far end of the fiber would be mirrored to improve the light collection. Single ended readout reduces the cost and has been demonstrated to produce sufficient numbers of photo electrons. However, there is significant time skewing associated with single ended readout which will impact our timing resolution. Reading the fibers out at both ends allows mean-timing of the two signals for good timing resolution and makes it possible to include the fibers in a trigger with a narrow time window. The cost of the readout, of course, doubles.
The end of fiber to be read out will be spliced to a clear fiber, which is fed through to the outside of the vacuum tank and then brought to the cryogenic VLPC system. More than 5 p.e. per MIP is expected which, even in the worst situation, results in a 99.3% detection efficiency for each view (x/x′ or y/y′). The detection efficiency of a prototype device in the presence of a 40 MHz background has been measured to be better than 98% by D0 [28]. A 15 cm x 15 cm hole will occupy the central region of each tracking plane in order to minimize neutron interactions from the beam. The fibers in this region will be cut in the middle and read out at both ends.
A total of 98.7 k channels are required for the tracking system in order to read the fibers out at both ends. A breakdown of the channel count appears in Table 11.
| Tracker No. | Plane type | Size (x/y) | #ch/plane | #plane |
|---|---|---|---|---|
| Fiber Tracker 1 | xx′yy′ | 140 x 140 cm | 4666 | 4 |
| Fiber Tracker 2 | xx′yy′ | 160 x 160 cm | 5332 | 4 |
| Fiber Tracker 3 | xx′ | 160 x 160 cm | 5332 | 2 |
| Fiber Tracker 4 | xx′yy′ | 180 x 180 cm | 6000 | 4 |
| Fiber Tracker 5 | xx′yy′ | 180 x 180 cm | 6000 | 4 |
| Total # channels | 98658 | 18 |
4.4.2 Spectrometer magnet
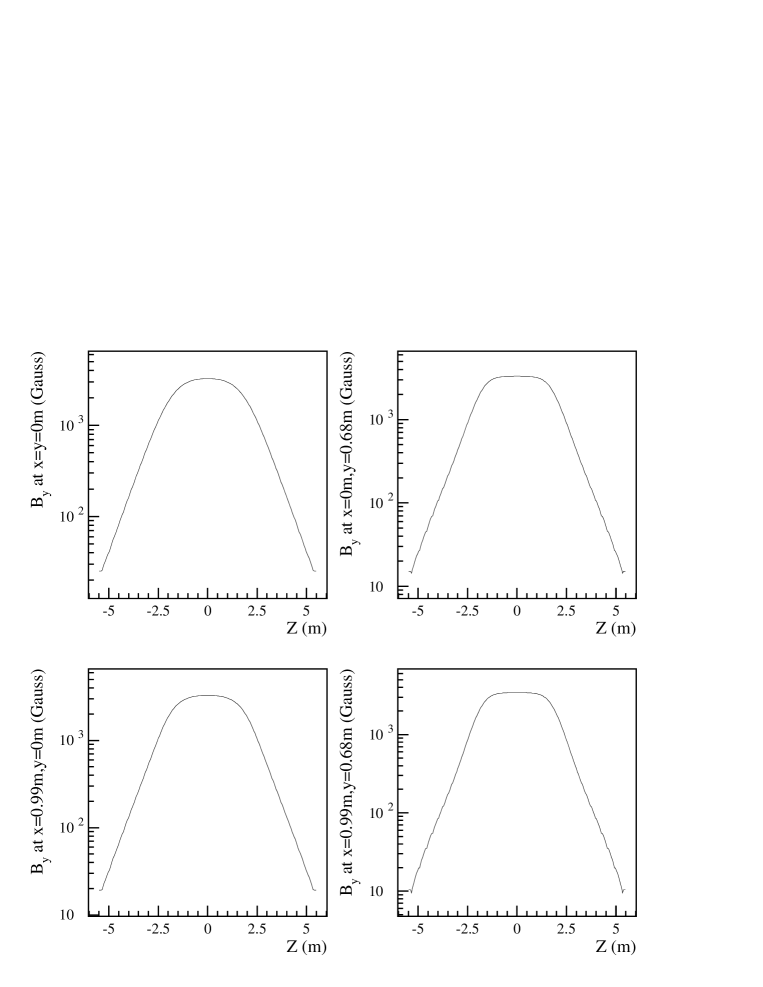
The existing KTeV spectrometer magnet will be used for KAMI. In order to allow for the 2.8 m square vacuum pipe to pass through, the magnet will have to be re-gapped from the current 2.1 m gap to 2.9 m. The coil positions will have to be adjusted slightly in order to reproduce the excellent field uniformity achieved in KTeV. Figure 13 shows the expected y-component of the magnetic field along the z-axis for four different x and y positions.
4.5 Other detectors
4.5.1 Vacuum pipe and vacuum window
Most of the vacuum pipe sections are of conventional cylindrical construction, similar to the steel pipes currently used in KTeV. The vacuum pipe must be of sufficient strength to support the photon veto detectors. The only exception is the vacuum pipe section which passes through the inside of the spectrometer magnet. This particular pipe section will have a square cross section and will be constructed of non-magnetic stainless steel. A detailed mechanical design is underway.
Since all of the momentum measurements of charged particles are performed in vacuum, the vacuum window does not need to be super thin. Any conversion of photons in the window can be detected by the CsI calorimeter, in principle. We do not see any technical difficulties here. Several materials are under consideration which will satisfy both our technical and safety requirements.
We have already achieved a vacuum of torr at KTeV. We plan to use the same pumping system for KAMI, perhaps with some modest upgrades. With minor modifications, we anticipate torr for KAMI which has a much smaller evacuated volume than KTeV. The vacuum pumping ports will all be located upstream of the Mask Anti detectors.
4.5.2 Charged hodoscope
The Charged Hodoscope is necessary as part of the charged particle trigger and to veto charged particles in neutral triggers. The inefficiency of the hodoscope should be controlled at the level of for the latter purpose. For this reason, it is located inside of the vacuum tank just upstream of the vacuum window.
The charged hodoscope consists of two sets of plastic scintillator planes; an x-view and a y-view. Each counter has a dimension of 1 cm (thick) x 2.5 cm (wide) x 1.9 m (long). Both ends are viewed by fast, small photomultipliers from outside of the vacuum. This configuration will provide accurate timing information (100 psec) for charged particles.
4.5.3 Muon range counter
For better muon/pion identification than is achieved by KTeV at low energy, a muon range counter may be required. Such systems have been used in other two-lepton mode experiments such as BNL791/871, where the muon ranges were measured with 10% accuracy.
4.6 Electronics
4.6.1 Trigger
The trigger for KAMI will be a three-tiered system, where the first two levels will be realized in hardware and the third level in software. The first level charged trigger will use the charged hodoscope, located just upstream of the vacuum window. This hodoscope consists of two crossed planes, so that event topologies consisting of oppositely charged tracks are easily distinguished. We will also explore the possibility of implementing a hit counting scheme at level-1 using the scintillating fiber tracker. The neutral level-1 trigger will use the CsI calorimeter to form a coherent energy sum from the entire calorimeter. The whole level-1 trigger system will be synchronized to a global clock. However, since the KAMI beam will be debunched, level-1 triggers can arrive anywhere within the period of this clock. Therefore, we need to perform further studies into how much smearing of the total energy threshold occurs due to the debunched beam structure.
The neutral level-2 trigger will consist of a hardware cluster counting scheme similar to the one used by KTeV. Since the anode of each of the CsI phototubes is directly connected to the input of the digitizer, the phototube dynode signals will be used to generate the bits required by the cluster counter. The cluster counter uses a parallel adding scheme to quickly find the number of clusters in the calorimeter. For two cluster events, the dominant trigger rate results from events in which two of the photons are either missed or fused. The event rate from decays is greatly reduced by a charged hodoscope veto.
The cluster counter is particularly sensitive to the effects of a debunched beam. A photon hitting the CsI deposits its energy in many crystals. This, coupled with the fluctuations in time of arrival of a photon relative to a fixed gate, can lead to large variations in the resulting pulse used to generate a cluster counter bit. Since missing a single bit can change the number of clusters found, we will have to study the effects of the beam structure on the cluster counter trigger.
For the third level trigger, we will use filter software to fully reconstruct each event before writing it to tape. The filter code will make very loose cuts on events to quickly determine whether events are consistent with the required topology. We expect that the reconstruction software will require between 3-5 ms per event and will reduce the number of events written to tape by a factor of 5-10.
4.6.2 Readout electronics
To avoid deadtime incurred during readout, we are exploring the possibility of using a fully buffered readout system. This will require upgrading most of the current KTeV readout elements, including the ADCs, latches, TDCs and trigger readout. For the KTeV experiment buffered readout was not implemented and reduced the livetime by approximately 20%. Currently, we are exploring the commercially available TDCs and ADCs which support buffered readout. The cluster counter readout is already buffered, but we must explore whether the readout depth is sufficient for the conditions at KAMI.
The CsI readout consists of a digital photomultiplier tube or DPMT. The DPMT contains two ASICs, the QIE (charge integrating encoder) and the DBC (data buffering and clocking) chip which provides the clock signals and readout of the QIE. In its current configuration, the DBC begins transferring data from a level-1 FIFO to a level-2 FIFO after the receipt of a valid level-1 trigger. At 53 MHz, this transfer requires up to 5 s for 32 time slices. A simple modification to the DBC would remove the deadtime associated with this transfer.
4.6.3 Data acquisition
For the KAMI detector we plan to use the same data acquisition system as was used in the KTeV detector. The architecture of this system consists of a buffer memory matrix. In this scheme, data is received by the data acquisition system in multiple parallel streams. Each of these streams writes data into dual-ported memories. For the KTeV experiment, a total of six streams were used.
In the memory matrix, the rows orthogonal to each of the data streams are connected to a processor plane which contains multiple CPUs. These CPUs perform level-3 filtering of the events, and typically rejected 80-90% of the events read out from the detector in KTeV. The data from each event is transferred to the processor plane via a 64-bit VME DMA. The system is flexible enough so that one event can be sent to any of the processor planes, allowing one to both split the data by trigger type and allocate one of the processor planes as a monitoring plane. For example, in the KTeV experiment three of the processor planes received the beam trigger events in a round-robin fashion. The fourth plane received approximately 10% of the events and did a detailed analysis of the data to monitor the data quality.
Each of the six data streams has a bandwidth of approximately 40 MB/s for a total bandwidth of 240 MB/s. The instantaneous bandwidth for each plane is approximately 40 MB/s, the VME64 specification. Note that because of the matrix architecture of the data acquisition system, the whole system can readily be expanded, depending upon the average event size and rate.
5 Expected Detector Performance
This chapter describes the expected performance of major detector elements in detail based on our current studies.
5.1 CsI calorimeter
The KTeV calorimeter consists of 3100 pure CsI crystals, 27 radiation lengths long, prepared for optimal resolution and linearity. It is instrumented with low-gain, highly linear PMTs, each with its own digitizer.
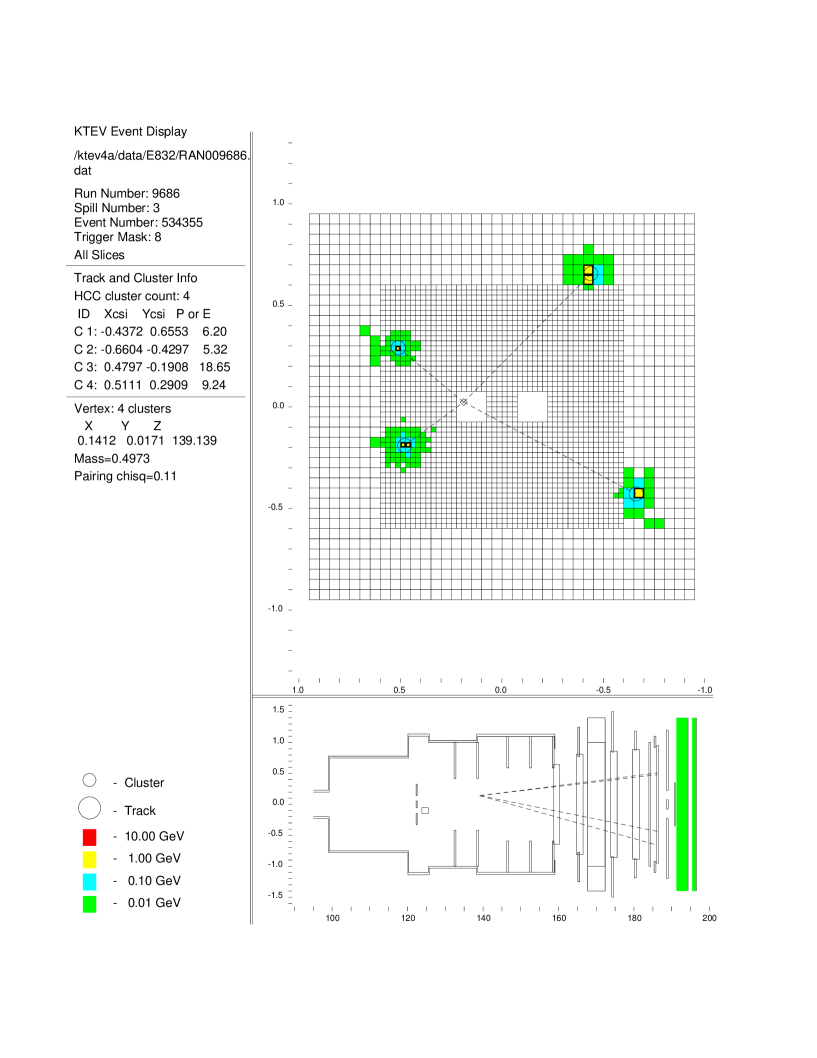
The layout of the CsI calorimeter for KTeV can be seen in Figure 14, an event display of a decay. The length of the crystals was chosen to be 27 radiation lengths (50 cm) in order to achieve excellent energy resolution and linearity. There are two sizes of crystals, cm3 crystals in the central region of the calorimeter, and cm3 crystals in the outer region. The entire calorimeter is m2. The two transverse dimensions were chosen to optimize the mass resolution, while minimizing the number of channels. To optimize the resolution and linearity of the calorimeter we individually tuned the Aluminized-Mylar wrapping of each crystal so that the scintillation response along the shower is uniform, to the level of 5%. Finally, on average, the actual light yield for our crystals is 20 photo-electrons/MeV, which corresponds to a contribution to the energy resolution of .
The signal from each crystal is digitized by a “Digital PMT” base, or DPMT. This DPMT is mounted directly behind each crystal. The DPMT is an auto-ranging device, with eight ranges. The input current, I, is split into eight binary ranges, ie. into I/2, I/4, I/8, I/16, I/32, I/64, I/128, and I/256. Then each of the eight split currents are integrated, with a clock speed of up to 53 MHz. After integration, it is determined which of the eight binary ranges is in range, and the integrated current from this range is digitized with an 8-bit FADC. Thus the DPMT produces an 8-bit mantissa and a 3-bit exponent for 16 bits of dynamic range.
Advantages of the DPMT include extremely low noise, multiple samples per crystal and a wide dynamic range. The noise level is approximately 4 fC, or less than 1 MeV. The multiple samples allow for additional rejection of out-of-time accidental activity. In addition, the time resolution of the DPMT has been found to be 150 psec, using a calibration laser flasher system.
For the KAMI experiment, the important calorimeter considerations include energy resolution, resistance to radiation damage, efficiency to separate nearby photons, and gaps between crystals. Let us discuss these issues in turn.
The energy and position resolution of the calorimeter can be determined from momentum analyzed electrons from decays. The ratio of energy measured in the calorimeter to momentum measured in the spectrometer is shown in Figure 15. For electrons incident over the entire calorimeter, and having momentum from 4-100 GeV, the resolution is . The resolution as a function of momentum, with the estimated contribution from the momentum resolution removed, is shown in Figure 16. The resolution is 1.3% at the KAMI mean photon energy of roughly 3 GeV. Some improvement in the resolution at low energies will be possible, since in KTeV we have masked off typically 50% of the scintillation light to improve the linearity of our PMTs. For KAMI, where sub 1% linearity is not critical, we will remove these masks to increase the scintillation light output.


In one year of running KAMI-Near, we expect that the radiation dose in the center of the calorimeter will be approximately 60 kRads. At this dose we expect to see some degradation of the calorimeter’s resolution. The radiation resistance of the CsI crystals has been tested in two ways. First, controlled tests of a small sample of crystals were performed in which doses of 10 kRads were applied, and the change in scintillation response was monitored. The results varied significantly from crystal to crystal, with changes in the expected energy resolution ranging from 10% to 50% at 10 kRads. Second, by the middle of the 1996-1997 KTeV run, the center of the CsI had been exposed to a dose of 1 kRad. Although the scintillation light response along the shower has been observed to change in roughly 100 of the 3100 crystals, no significant degradation of the resolution has been observed in these crystals or in the array as a whole. By the end of the 1997 KTeV run the dose will have doubled, and a further evaluation of its effect will be made.
One of the ways in which events appear as background to is for two of the photons to overlap or fuse in the calorimeter. This background is suppressed by requiring that the photon’s transverse distribution of energy in the calorimeter be consistent in shape with typical electro-magnetic clusters. A shape is formed using the measured position of the cluster as a lookup for the mean and rms of the energy in each crystal in the cluster. Typically a 7x7 array is used in the 2.5 cm crystals, and a 3x3 array is used in the 5.0 cm crystals. The efficiency of the shape requirement from a Monte Carlo simulation of the background is shown in Figure 17 as a function of the distance between photons for the case of photons in the 2.5 cm 2.5 cm crystals. Nearby photons can be distinguished 50% of the time when they are separated by roughly the crystal’s transverse dimension.

Finally, the CsI calorimeter was constructed to minimize the amount of inactive material between crystals and the size of gaps between crystals. The crystals are wrapped with one layer of Aluminized-Mylar (and two overlapping layers on one face). In addition, the wrapping was secured with a thin layer of backless transfer tape. The inactive material thus comprises only 0.22% of the array in cross-sectional area. Also, gaps between crystals were minimized by pushing horizontally on each individual row of the array. However, on lines extending radially from the beam holes, there are trajectories on which photons will only go through the mylar wrapping. The probability that a photon will lie on such a trajectory is roughly . A more complete simulation is needed to estimate the probability that a photon will convert in the mylar, and lead to a significant energy deposition. In KTeV data itself, the inactive material and gaps between crystals has been seen in an enhancement in the number of events with low electron E/P which occur at the boundaries of crystals. In the 2.5 cm crystals, the E/P ratio is between 0.80 and 0.95 due to crystal boundaries for of all electrons.
5.2 Photon veto detectors
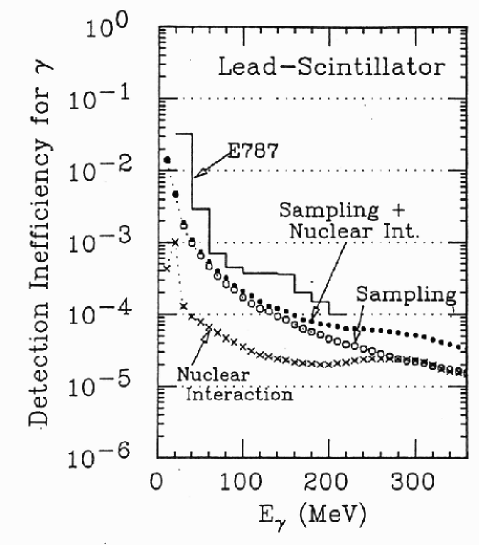
The detection efficiency of the photon veto detectors ultimately determines the background level for the search. A direct measurement of the inefficiency for a similar detector was performed by BNL E787 in a search, using . The results of this study are shown in Fig. 18. A group at KEK has done detailed simulations of photon veto inefficiencies for their proposal to measure [14]. Their result is also plotted in the same figure.
Photon detection efficiency is, of course, a strong function of energy with the lower energies being more problematic. Inefficiencies at low energy ( 30 MeV) are dominated by sampling effects where a significant fraction of the energy is absorbed in the inactive material. Inefficiencies at higher energies are dominated by the small probability of photonuclear interactions.
At KAMI, the energy of a typical photon is higher than 1 GeV resulting in inefficiency expectations of less than . If two missing photons from the background process both have energies above 1 GeV, the resulting background would be less than . Unfortunately, this is not always the case as the energies of the two missing photons can be distributed quite asymmetrically. This is shown in Figure 23 in Section 6.1.2.
A detailed study, described in Section 6, indicates that the most serious background events result when the lower-energy missing photon carries less than 20 MeV. To estimate the inefficiency for such photons, a GEANT simulation was performed, assuming the detector geometry described in Section 4.3.2. An initial study was done with a 17 deep sampling calorimeter consisting of either 0.5 mm, 1 mm or 2 mm thick lead sheets with 5 mm thick scintillator plates.
The top two plots in Fig. 19 show the inefficiency as a function of photon energy, for various photo electron thresholds and lead sheet thickness. Below 10 MeV, detection of photons becomes increasingly difficult.
In reality, low energy photons tend to have larger opening angles which increases the sampling inefficiency, unless the lead sheets are tilted to compensate. To address this, a more detailed simulation was performed based on the real four vectors of the two photons from background events which miss the CsI. The inefficiency was measured as a function of the tilt angle of the lead sheets relative to the beam direction (z-axis). As is shown in the bottom two plots in Fig. 19, the inefficiency is a weak function of the tilt angle. A 45 degree tilt angle gives the best result, as expected. With a 2-3 p.e. threshold, a 20% inefficiency appears to be feasible, even with 1 mm lead sheets.

In order to better understand the inefficiency at higher energies, we plan to perform a detailed simulation of photonuclear effects to determine the ultimate limitations of the photon veto detectors. Due to the large nuclear interaction length of the photon veto detector for shallow angle photons, we expect to achieve an inefficiency of better than for photons 1 GeV.
5.3 Scintillating fiber tracker
Thanks to the tremendous effort by the D0 collaboration and others at Fermilab, scintillating fiber tracking is becoming a mature technology. The D0 fiber tracker consists of 2 m long, 830 m diameter scintillating fibers spliced to 5 m long, 1 mm diameter clear fibers [28]. The light emerging from the clear fibers is viewed by VLPC detectors. The D0 prototype detector produces 9 p.e. per MIP with the expectation of 12 p.e. per MIP with their final detector. Position resolution of 92 m has been achieved using double layers of fibers.
We plan to use the same technology for the KAMI changed particle spectrometer. As mentioned in Section 4.4.1, we are considering reading out both ends of the fibers to obtain better time resolution and triggering capabilities. Our plan is to use smaller diameter fibers than the D0 fiber tracker. A double layer of 500 m fibers will result in 60 m position resolution, better than that currently achieved by KTeV using drift chambers. The clear fiber light guide used by KAMI would be shorter than the one used by D0, resulting is less attenuation. Thus, even with thinner fibers, we expect to obtain more than 5 p.e. per MIP. A detailed study of the momentum resolution is currently underway.
CDF has also developed a prototype fiber tracker [29]. Using 500 m diameter fibers, they have obtained more than 4 p.e. per MIP, as shown in Fig. 20.

6 Background Study
The kaon flux at KAMI will reach levels which should result in the observation of approximately 100 decays, as shown in Section 2.2. In order to optimize KAMI’s detector geometry and to understand the detector performance required to suppress backgrounds at such a high sensitivity level, we have performed detailed Monte Carlo simulations. This section describes the results of these studies.
It is first necessary to restrict the transverse size of the beam for the decay search for two reasons:
-
1.
To obtain good resolution for the reconstructed ; and
-
2.
To minimize the geometrical acceptance for photons which pass through the beam hole in the CsI calorimeter. The photons in the beam hole must be vetoed by the Back Anti detector which is exposed to a high flux of neutrons and kaons.
We have optimized the beam sizes for the two different target positions shown in Table 4. A beam size of 0.36 str is optimum for KAMI-Far, and 1 str is optimum for KAMI-Near. With these beam solid angles, we can expect 30 and 124 signal events per year for KAMI-Far and KAMI-Near, respectively, as listed in Table 4. These event rates are adequate in order to extract a meaningful value for .
Once the beam size is determined, the kinematical distribution of signal events may be studied. The distribution and vertex distribution are shown in Fig 21.

The background level is a strong function of photon detection inefficiency. Understanding this relationship is the main focus of this chapter. There are several possible sources of background events. From kaon decays, , and are the major concerns. From Hyperon decays, n, and (with sequential n decays) are the major contributors. In addition, neutron interactions with residual gas or with detector elements may produce s with high .
So far, most of our studies have been focused on the study of backgrounds, since this will be the ultimate physical background source which can produce a single with high in the CsI calorimeter.
6.1 background estimate
One of the difficulties of studying backgrounds in rare decay experiments is the excessive amount of CPU time which is required to generate a sufficient number of background events. This problem can be solved by artificially degrading the photon veto efficiency, as described below.
In order for to become a background event, two photons must be detected by the CsI and the other two photons must go undetected. There are many different ways for photons to escape detection. The photons can go undetected either in the vacuum veto counters, the Back Anti or the CsI. Additionally, two photons can fuse in the CsI and be detected as a single cluster.
If we artificially reduce the efficiency of the various detectors, the probability of missing two photons increases, thus, we gain statistics. As long as we keep a detailed record of why each photon is missed, we can impose better detector efficiences analytically as additional offline cuts without losing statistics.
6.1.1 Kaon beam generation
The neutral kaon beam for these studies is generated using the standard KTeV/KAMI Monte Carlo simulation software, assuming the following conditions:
-
1.
For KAMI-Far, the target is located at z=0 m, while for KAMI-Near, the target is located at z=120 m.
-
2.
The targeting angle is set to 24 mrad to reduce the neutron flux.
-
3.
For KAMI-Far, the beam solid angle is 0.6 mrad 0.6 mrad = 0.36 str. For KAMI-Near, the beam solid angle is 1 mrad 1 mrad = 1str.
-
4.
Kaon decays are generated in the 34 m long fiducial region from z=152 - 186 m (from the position of the Mask Anti to the CsI calorimeter).
-
5.
The kaon momentum is generated in the range of 5-120 GeV using the Malensek parameterization [20].
6.1.2 Detector geometry
For simplicity, we have modeled the detector geometry as shown in Figure. 22. The relevant details of the detector model are:
-
1.
At z = 152 m, there is one Mask Anti(MA) which is flat and infinitely wide in the x and y directions. Later, this section will be replaced by an additional MA with a box geometry to make it finite in size.
-
2.
The Vacuum Photon Veto (PV) is 1.9 m (x) 1.9 m (y) 34 m (z) and has a simple box shape. It is located between the MA and the CsI calorimeter.
-
3.
There is no charged spectrometer included in the simulation. The Charged Veto is not considered in this study either, since we are simulating only photons.
-
4.
The CsI is divided into three regions; CsI-In, CsI-Mid and CsI-Out. CsI-In is the central region of 30 cm 30 cm where the efficiency is low for low-energy photons due to accidental activity. CsI-Mid is the middle region of the calorimeter, bounded by 60 cm 60 cm. Both CsI-In and CsI-Mid consist only of small (2.5 cm 2.5 cm) crystals. CsI-Out is the outer-most part of the calorimeter, and consists only of large (5 cm 5 cm) crystals. Both CsI-Mid and CsI-Out are expected to have high efficiency, even for low energy photons. CsI-Out is expected to have poorer rejection power for fused photons than CsI-In and CsI-Mid because of the larger transverse size of the crystals.
-
5.
The Back Anti (BA) is located at z=193 m and divided into two regions; BA-In (inside of the the neutral beam) and BA-Out (outside of the beam). The x/y dimentions of BA-In is 2.5 cm larger than the beam size (at z=186 m) in both x and y. This region is exposed to a high neutron flux and is expected to have poor photon detection efficiency. BA-Out is infinitely large and is expected to have a high efficiency for detecting photons.
The exact dimensions of the various detector elements used in the simulation are listed in Table 12. The beam size is defined as X and Y at Z=186 m.
| Material | Z (m) | Xin (m) | Xout (m) | Yin (m) | Yout (m) | |
|---|---|---|---|---|---|---|
| MA | Pb/Scint. | 152 | X+.025 | Inf. | Y+.025 | Inf. |
| PV | Pb/Scint. | 152-186 | 0.95 | - | 0.95 | - |
| CsI-In | CsI(2.5 cm2) | 186 | X+.05 | 0.30 | Y+.05 | 0.30 |
| CsI-Mid | CsI(2.5 cm2) | 186 | 0.30 | 0.60 | 0.30 | 0.60 |
| CsI-Out | CsI(5.0 cm2) | 186 | 0.60 | 0.95 | 0.60 | 0.95 |
| BA-In | Pb/Quartz | 193 | 0 | X+0.025 | 0 | Y+0.025 |
| BA-Out | Pb/Scint. | 193 | X+0.025 | Inf. | Y+0.025 | Inf. |
It is important to categorize the reasons why photons go undetected in as much detail as possible. In most cases, the photons will be lost due to the inefficiency of the detector. However, in case of the CsI, photons can be lost due to fusion as well. The way in which photons may be missed can be broken down into the following seven categories:
00) Inefficiency in BA-In [BAI]
10) Inefficiency in BA-Out [BAO]
20) Inefficiency in PV [PV]
30) Fusion in CsI-In/Mid (small crystals) [CIf]
40) Fusion in CsI-Out (Large crystals) [COf]
50) Inefficiency in CsI-In (central 30 cm region) [CI]
60) Inefficiency in CsI-Mid/Out (outer region). [CO]
In the case of loss due to inefficiency, each category can be further divided into the following ten energy regions:
0) 0.00 - 0.02 GeV
1) 0.02 - 0.04 GeV
2) 0.04 - 0.06 GeV
3) 0.06 - 0.10 GeV
4) 0.10 - 0.20 GeV
5) 0.20 - 0.40 GeV
6) 0.40 - 1.00 GeV
7) 1.00 - 3.00 GeV
8) 3.00 - 10.0 GeV
9) 10.0 - infinite.
In the case of loss by fusion ([CIf] [COf], or ID = 30, 40), each category is further divided into the following ten distance categories:
0) 0 - 2.5 cm
1) 2.5 - 5.0 cm
2) 5.0 - 7.5 cm
3) 7.5 -10.0 cm
4) 10.0 -12.5 cm
5) 12.5 -15.0 cm
6) 15.0 -17.5 cm
7) 17.5 -20.0 cm
8) 20.0 -22.5 cm
9) 22.5 -infinite.
By combining all of the categories listed above, there are a total of 70 possible reasons for losing photons. This means that for two photons there are 70 x 70 = 4900 possible reasons. Photons are not equally distributed throughout these 4900 bins. Studies indicate that there are several key parameters which contribute most to the background. These are:
-
1.
Vacuum veto inefficiency for very low energy photons ( 20 MeV);
-
2.
Vacuum veto inefficiency for high energy photons (1-3 GeV);
-
3.
Inefficiency in the CsI for high energy photons (3-10 GeV);
-
4.
Inefficiency in the BA for very high energy photons ( 10 GeV);
-
5.
Inefficiency due to fusions in the small CsI crystals.
When two photons are missed, one photon tends to have a low energy and a large opening angle, while the other photon has a high energy and a small opening angle. Figure 23 shows the correlation between two missed photons. Figure 23-a is a scatter plot of the two photon energies. Figure 23-b shows the correlation of opening angle vs. energy for the higher energy photons. Figure 23-c shows the correlation of opening angle vs. energy for the lower energy photons. Figure 23-d is the same as plot Figure 23-c, except the photon energy is restricted to below 20 MeV.

In order to derive the correlations between detector parameters, we start with completely inefficient detectors, except for the CsI. We assume that the CsI has a 1% inefficiency for photons above 1 GeV. For energies less than 1 GeV in the CsI, and for photons in all other detectors, (i.e. MA, PV or BA), 100% inefficiency is assumed. Table 13 shows the initial inefficiency for each detector for each energy bin.
| ID | Energy | MA/PV/BA | CsI |
|---|---|---|---|
| Low-High (GeV) | Inefficiency | Inefficiency | |
| 0 | 0.0 - 0.02 | 1 | 1 |
| 1 | 0.02 - 0.04 | 1 | 1 |
| 2 | 0.04 - 0.06 | 1 | 1 |
| 3 | 0.06 - 0.10 | 1 | 1 |
| 4 | 0.10 - 0.20 | 1 | 1 |
| 5 | 0.20 - 0.40 | 1 | 1 |
| 6 | 0.40 - 1.00 | 1 | 1 |
| 7 | 1.00 - 3.00 | 1 | |
| 8 | 3.00 - 10.0 | 1 | |
| 9 | 10.0 - Inf. | 1 |
For fusions, we assume 100% detection efficiency if the distance between the two photons is larger than the twice of crystal size. Otherwise, we set the efficiency to 0. The fusion inefficiencies are listed in Table 14.
| ID | Distance | CsI-In/Mid | CsI-Out |
|---|---|---|---|
| Low-High (cm) | Inefficiency | Inefficiency | |
| 0 | 0.0 - 2.5 | 1 | 1 |
| 1 | 2.5 - 5.0 | 1 | 1 |
| 2 | 5.0 - 7.5 | 0 | 1 |
| 3 | 7.5 - 10. | 0 | 1 |
| 4-9 | 10. - Inf. | 0 | 0 |
These artificially high inefficiencies ensure high statistics for each type of background.
6.1.3 Offline cuts
After events are generated by the Monte Carlo, the following offline cuts are applied prior to tightening the photon veto efficiency cuts:
-
1.
Only two clusters in the CsI, each with E 1 GeV;
-
2.
5 GeV Total Energy in CsI 20 GeV;
-
3.
150 MeV/c;
-
4.
No hits in the MA/PV/BA; and
-
5.
A reconstructed z vertex between 152 m and 171 m.
These cuts were carefully chosen from our early studies to reject various types of backgrounds (n, , etc.). Under these conditions, the acceptance for the signal is 7.1% for KAMI-Far, and 7.4% for KAMI-Near.
6.1.4 Background estimation
In a standard Monte Carlo job, one can generate an order of events. If one category of missed photon pairs, say PV(0-0.02 GeV) and BA(10GeV) receives N events, the expected number of background events of this type at signal sensitivity of (i.e. the Standard Model signal level) can be estimated by the formula below, where an acceptance of 7% is assumed for the signal. First, the Single Event Sensitivity (SES) is calculated:
SES = Br() / (No. of generated events) / Acceptance() N
= 9 / / 0.07 N
= 1.3 N.
The number of Background events, , which result when a signal sensitivity of is achieved is given by
= SES / 3 = 0.43(N ).
In principle, we can calculate 4900 such numbers for all of the different categories simultaneously. This will form a matrix of background events, where and both run over the 70 different categories of lost photons.
It is highly desirable to have more than 100 events in each category in order to minimize the statistical error. This is very important for the case where the inefficiency can not be reduced by more than an order-of-magnitude from the initial value listed in Table 13.
By looking at this matrix of 4900 entries, one can determine how to impose additional efficiency requirements for each detector (i.e. smaller inefficiency). One can also sum up each column to determine the overall background contribution from each of the 70 categories;
If one imposes the additional reduction of inefficiency, Ineff, for the ’th type of background, then becomes Ineff and becomes Ineff.
The final goal is to determine the 70 parameters, Ineff, which satisfy the condition
| (1) |
One way to determine the optimum value of the parameter Ineff is to reduce it until becomes significantly smaller than one, say less than 0.1. After executing this procedure for all 70 categories, if one ends up with ten categories each with 0.1 events, the total number of background events would be on the order of 1.
By appling this method iteratively, we have derived the values in Table 15 as the default veto efficiencies for various detectors. This table is consistent with the measurements by BNL E787 and Inagaki’s study [14] for the energy region between 20 MeV and 400 MeV. To be conservative, the actual inefficiencies in this table were set higher than their numbers.
Below 20 MeV, a 20% inefficiency is assigned to the vacuum veto system, based on the result of the GEANT simulation described in Section 5.2. Above 1 GeV, inefficiency values were optimized to achieve our background reduction goals.
| ID | Energy | MA/PV | CsI-Mid/Out | CsI-In/BA-Out | BA-In |
|---|---|---|---|---|---|
| Low-High (GeV) | Inefficiency | Inefficiency | Inefficiency | Inefficiency | |
| 0 | 0.0 - 0.02 | 1 | 1 | 1 | |
| 1 | 0.02 - 0.04 | 1 | 1 | ||
| 2 | 0.04 - 0.06 | 1 | 1 | ||
| 3 | 0.06 - 0.10 | 1 | |||
| 4 | 0.10 - 0.20 | 1 | |||
| 5 | 0.20 - 0.40 | 1 | |||
| 6 | 0.40 - 1.00 | 1 | |||
| 7 | 1.00 - 3.00 | ||||
| 8 | 3.00 - 10.0 | ||||
| 9 | 10.0 - Inf. |
In addition, the inefficiencies in Table 16 for separating fused photons were applied, based on our study with the existing KTeV CsI calorimeter, described in Section 5.1.
| ID | Distance | CsI-In/Mid | CsI-Out |
|---|---|---|---|
| Low-High (cm) | Inefficiency | Inefficiency | |
| 0 | 0.0 - 2.5 | 1.0 | 1.0 |
| 1 | 2.5 - 5.0 | 0.1 | 1.0 |
| 2 | 5.0 - 7.5 | 0 | 0.1 |
| 3 | 7.5 - 10. | 0 | 0.1 |
| 4-9 | 10. - Inf. | 0 | 0 |
6.1.5 Results for KAMI-Far option
We have studied the KAMI-Far option using the inefficiencies in Tables 15 and 16. After imposing these inefficiencies, Table 17 was generated for the categories which contribute more than 0.01 events to the background level, calculated for a signal sensitivity of (i.e. Standard Model signal level). Since all of the background numbers are normalized in this way, one can consider the table entries to be the expected Noise to Signal level.
| ID1 | ID2 | #background | Type1(Bin) | Default | Type2(Bin) | Default |
| 20 | 68 | 0.0890.002 | PV (0.02) | 0.2 | COi(3-10) | |
| 20 | 27 | 0.0790.000 | PV (0.02) | 0.2 | PV (1-3) | |
| 19 | 20 | 0.0670.005 | BA (10) | 0.001 | PV (0.02) | 0.2 |
| 19 | 30 | 0.0610.007 | BA (10) | 0.001 | CIf(2.5) | 1.0 |
| 20 | 67 | 0.0400.002 | PV (0.02) | 0.2 | COi(1-3) | |
| 17 | 68 | 0.0250.001 | BA (1-3) | 0.1 | COi(3-10) | |
| 20 | 28 | 0.0200.000 | PV (0.02) | 0.2 | PV (3-10) | |
| 16 | 26 | 0.0190.001 | BA (0.4-1) | 1.0 | PV (0.4-1) | |
| 19 | 31 | 0.0170.002 | BA (10) | 0.001 | CIf(2.5-5) | 0.1 |
| 21 | 68 | 0.0140.000 | PV (.02-.04) | 0.03 | COi(3-10) | |
| 17 | 27 | 0.0130.000 | BA (1-3) | 0.1 | PV (1-3) | |
| 21 | 27 | 0.0130.000 | PV (.02-.04) | 0.03 | PV (1-3) | |
| 16 | 27 | 0.0120.000 | BA (0.4-1) | 1.0 | PV (.02-.04) | |
| 19 | 21 | 0.0110.001 | BA (10) | 0.001 | PV (.02-.04) | |
| Total of 0.57 background events / SM signal () | ||||||
In order to further reduce the background level, tighter kinematical cuts were studied. Signal events have a maximum of 231 MeV/c, while backgrounds have a maximum of 209 MeV/c. By taking advantage of our good resolution, one can consider a cut at 215 MeV/c. This cut was made before the additional photon veto inefficiency table was imposed. Signal acceptance was reduced from 7.1% to 1.2% by this cut. The level of background which results is shown in Table 18.
| ID1 | ID2 | #background | Type1(Bin) | Default | Type2(Bin) | Default |
| 20 | 68 | 0.1030.023 | PV (0.02) | 0.2 | COi(3-10) | |
| 17 | 68 | 0.0520.012 | BA (1-3) | 0.1 | COi(3-10) | |
| 20 | 67 | 0.0310.022 | PV (0.02) | 0.2 | COi(1-3) | |
| 21 | 68 | 0.0170.004 | PV (.02-.04) | COi(3-10) | ||
| 20 | 27 | 0.0130.001 | PV (0.02) | 0.2 | PV (1-3) | |
| Total of 0.30 background events / SM signal () | ||||||
A large fraction of the remaining background was found to be the odd combination of two photons i.e. each photon comes from a different . As a result, the two photons detected by the CsI tend to have a large energy imbalance. By requiring E(low)/E(high) 0.3 the background level can be further reduced, as shown in Table 19, while the signal acceptance is reduced to 0.88%.
| ID1 | ID2 | #background | Type1(Bin) | Default | Type2(Bin) | Default |
| 20 | 68 | 0.0970.026 | PV (0.02) | 0.2 | COi(3-10) | |
| 17 | 68 | 0.0450.012 | BA (1-3) | 0.1 | COi(3-10) | |
| 20 | 67 | 0.0210.021 | PV (0.02) | 0.2 | COi(1-3) | |
| 17 | 67 | 0.0100.010 | BA (1-3) | 0.1 | COi(1-3) | |
| 26 | 60 | 0.0210.015 | PV (0.4-1) | 0.2 | COi(0.02) | 1 |
| Total of 0.25 background events / SM signal () | ||||||
6.1.6 Results for KAMI-Near option
The possibility of moving the target station downstream to a position of z = 120 m, the KAMI-Near option, was also studied. A larger beam size of 1 mrad x 1 mrad = 1 str was used.
Even though the beam solid angle is larger than for KAMI-Far, the beam size at the BA is smaller. As a result, the background level related to the inefficiency in BA-In can be further reduced.
Table 20 itemizes the sources of backgrounds for the standard cut at 150 MeV/c. As shown in this table, there is no entry for BA-In. All the background sources are related to the inefficiency of the vacuum veto (PV) at low energy( 40 MeV).
| ID1 | ID2 | #background | Type1(Bin) | Default | Type2(Bin) | Default |
| 20 | 68 | 0.0860.003 | PV (0.02) | 0.2 | COi(3-10) | |
| 20 | 27 | 0.0740.000 | PV (0.02) | 0.2 | PV (1-3) | |
| 20 | 67 | 0.0350.003 | PV (0.02) | 0.2 | COi(1-3) | |
| 20 | 28 | 0.0190.000 | PV (0.02) | 0.2 | PV (3-10) | |
| 21 | 68 | 0.0140.000 | PV (.02-.04) | 0.03 | COi(3-10) | |
| 21 | 27 | 0.0130.000 | PV (.02-.04) | 0.03 | PV (1-3) | |
| Total of 0.32 background events / SM signal () | ||||||
With tighter cuts, the background level is reduced even further to 0.13 events/SM signal as shown in Table 21, while the acceptance is reduced from 7.4% to 1.0%.
| ID1 | ID2 | #background | Type1(Bin) | Default | Type2(Bin) | Default |
| 20 | 68 | 0.0430.003 | PV (0.02) | 0.2 | COi(3-10) | |
| 20 | 67 | 0.0270.004 | PV (0.02) | 0.2 | COi(1-3) | |
| 20 | 27 | 0.0140.000 | PV (0.02) | 0.2 | PV (1-3) | |
| Total of 0.13 background events / SM signal () | ||||||
An additional energy balance cut of E(low)/E(high) 0.3 reduces the background/Signal level to 0.077, while the signal acceptance goes down to 0.71%, as shown in Table 22.
| ID1 | ID2 | #background | Type1(Bin) | Default | Type2(Bin) | Default |
| 20 | 68 | 0.0260.015 | PV (0.02) | 0.2 | COi(3-10) | |
| 26 | 60 | 0.0130.013 | PV (0.4-1) | 0.2 | COi(0.02) | 1 |
| 21 | 68 | 0.0100.004 | PV (.02-.04) | 0.03 | COi(3-10) | |
| Total of 0.077 background events / SM signal () | ||||||
6.1.7 Summary
Table 23 summarizes the results for both the KAMI-Far and KAMI-Near options for various kinematical cuts. In this table, the expected accuracy on the measurement of , based on the number of signal and background events, is listed as well for each case. Since the branching ratio is proportional to , the statistical error on the number of signal events corresponds to an accuracy of 1/2 on , assuming there is no background. If we have to subtract the number of background events , the accuracy on is degraded and given by . Poisson statistics are used for both signal and background.
From Table 23, it is clear that KAMI-Near with a loose cut (at 150 MeV/c) results in the most precise measurement of . After one year of running, 6% accuracy can be achieved.
| Pt 150 MeV | Pt 215 MeV | Pt 215 MeV | |
| E(low)/E(high)0.3 | |||
| [KAMI-Far] | |||
| Signal acceptance | 7.1% | 1.2% | 0.88% |
| Signal/year in SM | 30 events | 5.1 events | 3.7events |
| Noise/Signal ratio | 0.57 | 0.30 | 0.25 |
| Accuracy on (/year) | 13% | 28% | 32% |
| [KAMI-Near] | |||
| Signal acceptance | 7.4% | 1.0% | 0.71% |
| Signal/year in SM | 124 events | 17 events | 12 events |
| Noise/Signal ratio | 0.32 | 0.13 | 0.077 |
| Accuracy on (/year) | 6% | 14% | 16% |
The most critical detector parameters and their design goals, based on the above study, can be summarized as follows:
-
1.
Low energy (20 MeV) photon detection in PV Ineff. 0.2
-
2.
High energy (1-3 GeV) photon detection in PV Ineff.
-
3.
High energy (3-10 GeV) photon detection in CsI Ineff.
-
4.
Very high energy (10 GeV) photon detection in BA Ineff. .
For the KAMI-Near option, the BA inefficiency can be relaxed to level. However, we should also consider the fact that the neutron flux in the BA is higher in the case of KAMI-Near.
In Section 9, our future plan to study the feasibility of these detector design goals will be discussed in some detail.
6.2 Other possible background sources
There are many possible background sources other than . None of these other backgrounds appear to be as critical, particularly from the perspective of detector performance. Detailed studies into these other background sources are still underway. Careful and thorough studies have already been done by the KEK group for their own proposal [14]. We have greatly benefited from their contribution.
6.2.1 Background from
The decay has a much larger branching fraction (21.6%) than . However, the final state has six photons which make its rejection much easier. Once care is taken to reduce backgrounds, it is easy to show that the rejection of can be achieved to the required level, thanks to the additional photons.
The most problematic background from decays is the case where the decay takes place upstream of the Mask Anti. If four photons go undetected and two photons from two different s pass through the Mask Anti and reach the CsI calorimeter, the vertex position reconstructed from the two mis-paired photons could be shifted downstream into the fiducial decay region. To reject such events, the upstream beam pipe is completely surrounded by the double stage Mask Anti and the vacuum veto system. This ensures that at least one of the 4 extra photons can be detected in this region.
6.2.2 Background from
This decay has a large branching ratio (36%) but the endpoint is at 104 MeV/c. The distribution and vertex distribution are shown in Fig. 24. By restricting the neutral beam divergence through the use of a small beam, this background can be effectively rejected by a cut around 150 MeV/c.

Since lambdas have a shorter lifetime than kaons, after 100 m or so of decay length their flux becomes completely negligible. Thus, in the KAMI-Far option, lambdas are not an issue.
More careful study is required to understand the lambda background for the KAMI-Near scenario. If one of the photons from n hits the CsI and the other photon is missed, an extra cluster in the CsI from accidental activity could combine with the detected photon to mimic a with high which reconstructs inside the allowed fiducial volume.
A related background source is the cascade decay into , followed by the lambda decay mentioned above. This is troublesome even without accidentals because the final could carry a as large as 230 MeV. This background should be removed by detecting the from the initial cascade decay in the upstream region surrounded by the double stage Mask Anti.
6.2.3 Background from and decays
Another source of background comes from copious kaon decays to two charged particles such as and . To reject these decays, at least one charged particle must be vetoed before it strikes the CsI. This can be achieved at the required level by adding a charged veto in front of the calorimeter. The inefficiency of scintillation counters has been extensively studied by the KEK group [14] and they have demonstrated that 1 cm thick scintillators, located in front of the calorimeter can reduce this type of background to a negligible level.
6.2.4 Background from nA A
Beam neutrons can interact with any material in their path and produce s copiously. Thus, it is of critical importance to minimize material thickness in the beam region. In KTeV, neutron interactions in the vacuum window and downstream detector elements, such as the drift chambers, have proven to be the most serious background for the search using the decay mode of the .
To reduce this background to a manageable level in KAMI, the entire region from the beam collimator to just upstream of the CsI calorimeter should be evacuated to the level of torr. This estimate is based on the number of neutron interactions in a vacuum of this level which would result in 2 photons in the CsI calorimeter. We have already achieved torr in the KTeV vacuum decay region. Since the vacuum decay region in KAMI is much shorter than that of KTeV, with modest upgrades of the existing vacuum pumping system, we expect to achieve torr.
7 Other Decay Modes
There are many rare kaon decays other than which are of substantial interest for a variety of reasons. The large kaon flux provided by the Main Injector combined with KAMI’s large acceptance for many of these channels make KAMI the best place to study these decays. None of the other proposed experiments for measuring have this capability.
In addition to , there are other rare kaon decays which are sensitive to direct CP violation. According to the Standard Model, a substantial fraction of the decays and should be direct CP violating and are expected to have branching ratios within reach of KAMI.
KAMI will also have the capacity to perform sensitive searches for other rare and forbidden decays. These include processes forbidden by the Standard Model, such as the lepton flavor violating decay . Other processes, such as , are highly suppressed in the Standard Model and provide windows where new physics might be detected.
It will also be possible to extend the sensitivity of the measurement at the Main Injector, should it be necessary. A statistical accuracy of is feasible at the Main Injector in 1 year of running based on the order of magnitude increase in decay rates combined with the 7-fold increase in the regeneration amplitude obtained at the lower kaon momentum.
7.1 and
The physics motivation for the decay
has a long history in the literature.
The decay has a CP conserving component, an indirect
CP violating component and a direct CP violating component. The
direct CP violating component is of primary interest and
could be the largest of the three [24]. The branching ratio for this
decay is predicted to be on the order of several times and the
current best limits on the decay are at the level [25].
Once detected, untangling the various contributions to the decay,
particularly in the presence of the attendant background from the
radiative Dalitz decay of the kaon,
,
is a significant experimental challenge. There
could be a significant electron asymmetry present, of the form
| (2) |
which would signal the interference of the CP violating and CP conserving amplitudes. This asymmetry will, of course, be diluted by the radiative Dalitz background.
Estimates for the sensitivity expected in KAMI for are listed in Table 5. Sensitivities of and are expected for KAMI-Far and KAMI-Near, respectively. Note that the m2 beam holes in the fiber planes reduce the acceptance by about 30% for this mode.
The related mode is of interest for similar reasons. However, the CP conserving amplitude may be significantly larger for this mode than for because there is no helicity suppression. The branching ratio for this decay is also predicted to be on the order of and the current best limits on the decay are at the level [26].
Estimates for the sensitivity expected in KAMI for are listed in Table 5. Sensitivities of and are expected for KAMI-Far and KAMI-Near, respectively.
7.2
In the 1996-97 run of KTeV, the previously undetected decay has been observed [9]. As mentioned in Section 1.4.1, the strong interest in this mode is because of the prospect for observing CP violation as predicted in Ref. [10]. This decay can proceed via the four processes shown in Fig. 25. The interference of the indirect CP violation Bremsstrahlung process (Fig. 25a) with the CP conserving M1 emission of a virtual photon (Fig. 25b) is expected to generate an asymmetry in the angle between the normals to the decay planes of the and the in the center of mass. In addition, direct CP violation effects, albeit small, can occur in this mode via the interference of the weak process of Fig. 25c with the other three amplitudes.
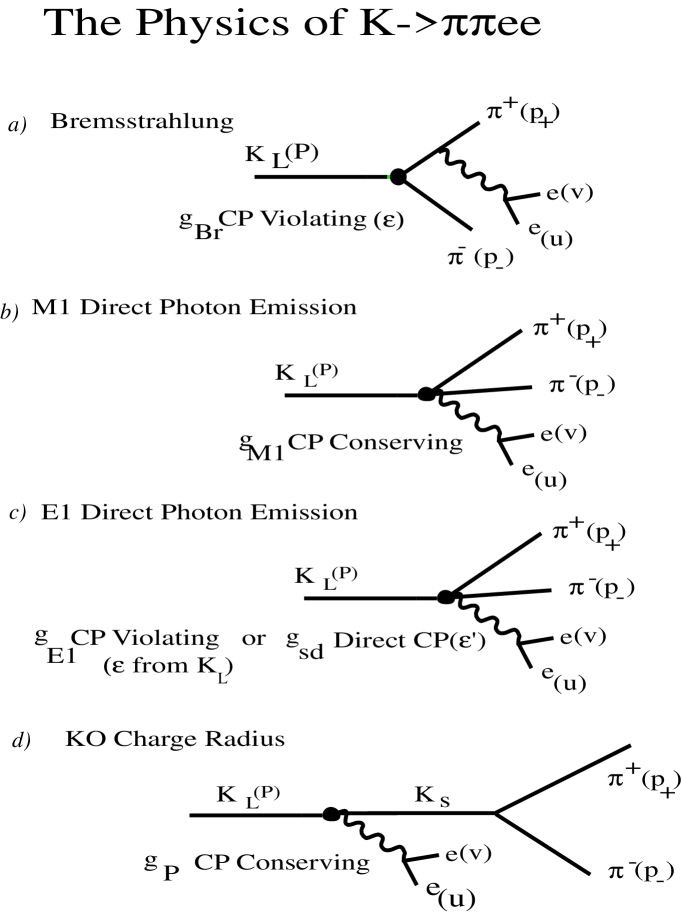
We show in Fig. 26 the angles in which the indirect and direct CP violation asymmetries are expected to be observed. The angular distribution as a function of and , where is the angle of the positron with respect to the direction of the Mππ cms in the Mee cms, is given by
The , and terms are the ones in which CP violation is expected to appear. The term is where direct CP violation would occur. Ignoring small terms and integrating over , the angular distribution is obtained:
An asymmetry in the distribution will signal the presence of indirect CP violation. This would be the fourth observation of indirect CP violation in 35 years and the first manifestation of CP violation in a dynamic variable. An asymmetry of 13.1% is expected between 0 and 0 in the events accepted by the KTeV spectrometer. This asymmetry will be measured in the 800 GeV/c KTeV data with a statistical error of 1% using the total data from the 1997 and 1999 runs ( one half the expected statistical error of the 1997 run).
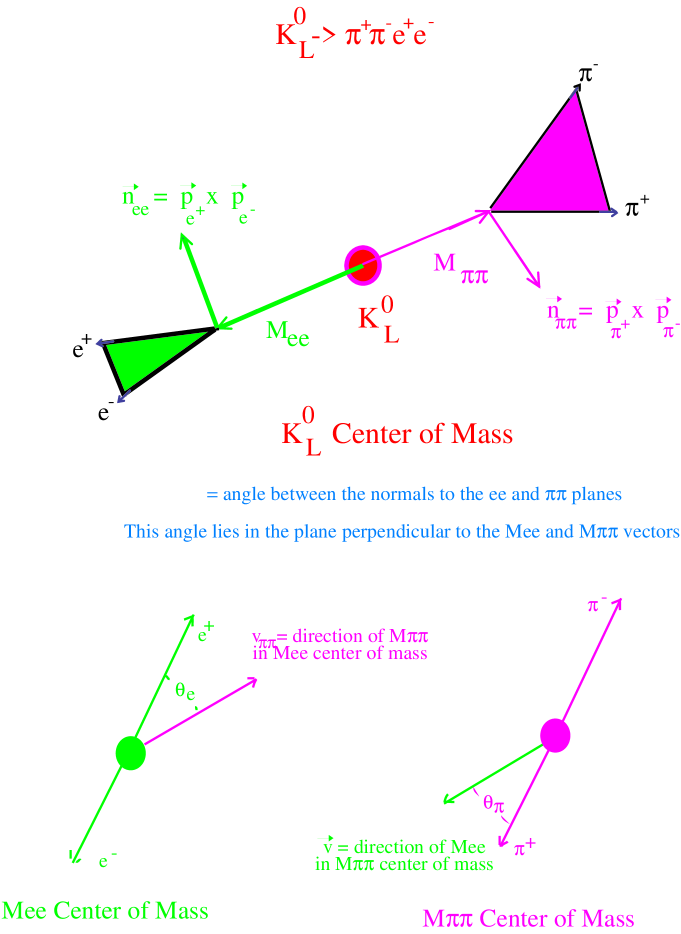
Estimates for the number of decays expected in KAMI are listed in Table 5. 64 k and 1.1 M events are expected for KAMI-Far and KAMI-Near, respectively.
With the greatly increased numbers of events available in either KAMI configuration relative to that which can be accumulated in the 800 GeV/c KTeV operation in the next few years, the asymmetry in can be measured much better. This is demonstrated in Fig. 27 which shows the expected error in the asymmetry measurement for KTeV, KAMI-Far and KAMI-Near as a function of the level of the asymmetry.
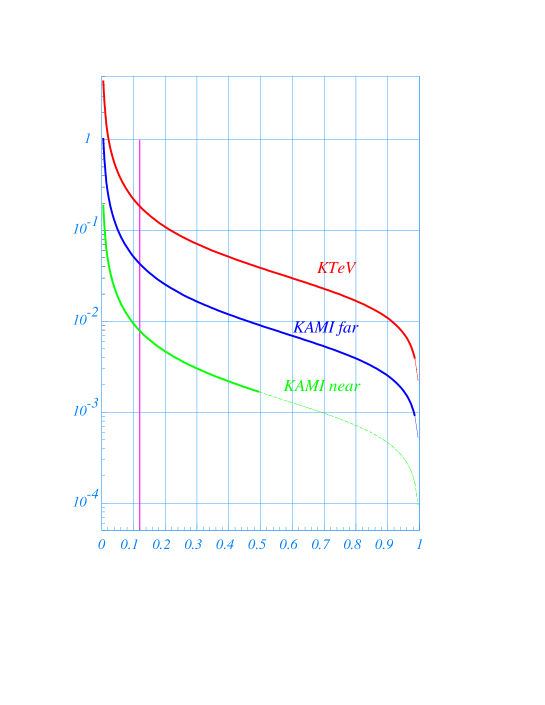
Finally, although direct CP violation effects which are due to the Standard Model CKM phase in decays are expected to be small, the increased statistics available in a KAMI experiment will allow an examination with increased sensitivity of the more complex, joint distribution to search for evidences of direct CP violation.
7.3 and
The decays and , as well as other processes which violate lepton number conservation, can occur in the Standard Model if the neutrino masses are not zero or degenerate. However, existing limits on neutrino masses and mixing angles imply exceedingly small branching ratios which are not observable. Observation of either of these modes would therefore provide clear evidence for physics outside of the Standard Model.
An active analysis of is underway in KTeV and the 1997 data set should result in a sensitivity of . Estimates for the sensitivity expected in KAMI are listed in Table 5. Sensitivities of and are expected for KAMI-Far and KAMI-Near, respectively.
KTeV did not trigger on because of data acquisition bandwidth limitations. KAMI hopes to incorporate such a trigger if it can be shown that the large background to this mode can be suppressed.
7.4 and
is a flavor-changing neutral-current processes which serves as an interesting probe of second-order weak processes in the Standard Model. The decay is sensitive to Vtd, the same CKM element responsible for much of the short-distance physics of . The theoretical interpretation of is unfortunately complicated by uncertainties in the contribution. However, KAMI will be able to collect large samples of , and decays which will allow a detailed analysis of the form factor.
Estimates for the sensitivities and event numbers expected in KAMI for are listed in Table 5. On the order of 25 k and 427 k decays are expected for KAMI-Far and KAMI-Near, respectively.
The physics of the decay is identical to that of . However, helicity suppression reduces the rate of Standard Model decays relative to by a factor of order . This leaves open the possibility of observing a non-Standard Model component to the decay which proceeds via a pseudoscalar interaction which is unconstrained by helicity suppression. The best published limit for this decay is (90% CL) [27].
Estimates for the sensitivities expected in KAMI for are listed in Table 5. Sensitivities of and are expected for KAMI-Far and KAMI-Near, respectively.
7.5 Other decays
There are many other rare decays accessible by KAMI which address important physics issues. For example, and decays to 4 leptons will be abundant in KAMI.
The decay proceeds primarily through the two-photon intermediate state . The form factor must be accurately known in order to isolate the contribution of second-order weak processes to the decay , as discussed earlier. Additionally, the angular distribution between the and decay planes provide a mechanism to search for a possibly large direct CP violating amplitude in the transition. KAMI can collect on the order of of these decays.
The angular distribution between the decay planes of the lepton pairs in the related decay is also sensitive to direct CP violation in the transition. KAMI can collect on the order of such decays for detailed study.
The angular distribution measurement for offers a parity violation test in electromagnetic decays for q2 in the hundreds of MeV2 range. In fact, all four-body decays modes offer such dynamical tests. KAMI can collect on the order of decays.
Finally, the decay is the neutral partner of the previously mentioned decay, but does not contain the inner brem term which contributes to the latter decay mode. This mode offers yet another opportunity to observe a non-Standard Model CP violation effect. The predicted branching ratio for this decay is on the order of [18]. KAMI can collect on the order of decays.
As can be seen from the above discussion, the KAMI charged mode program alone represents a diverse and important physics program which probes the Standard Model and issues of CP violation at significant levels. This program is completely compatible with the KAMI program to measure and is not possible to execute at any of the other proposed experiments.
8 Comparison with Other Proposals
At present, there are two other proposals to measure the rate for ; one from a collaboration working at KEK [14] and another from a collaboration working at BNL [13].
We will concentrate our remarks in this section on the BNL proposal. This is because that proposal attempts to reach a similar level of sensitivity to ours (roughly 30 events per year at the expected level), on a similar time scale. At present, the KEK collaboration is proposing to reach a single event sensitivity per year at the level expected from the Standard Model, and they will be working at the new JHP facility when it becomes available.
Even so, we have learned much from our colleagues at KEK. Their proposal incorporates many clever ideas, and they have performed some incisive measurements, particularly of the capabilities of various photon vetos at low energies. In fact, we are beginning a collaborative effort with them on these important issues.
Before giving our comments, we want to state again that reaching the goal of measuring the rate for at the 10% level will take time and will be difficult to achieve. In making critical remarks about our competition, we do not mean to imply that we are sure our approach will in fact succeed.
Given sufficient beam flux, the problem for all attempts at measuring the rate for is rejection of background. The dominant source of background again universally appears to come from decays where two photons are missed in the detector. The proponents of the BNL experiment have opted to make the center piece of their experiment the ability to kinematically reject background. Indeed, such a handle, if viable, would be invaluable in that one could tolerate greater inefficiency in the photon vetos.
Kinematic rejection means that one measures the momentum via time-of-flight and reconstructs the detected invariant mass and direction. Thus, one can determine the center-of-mass momentum of the and discriminate against the decay which has a unique value for this quantity.
To make use of the measured time-of-flight of the (actually of the decay photons), one is pushed, first of all, into having a very well bunched source of decays, and, second, into working at very low momentum. Thus, the mean kaon momentum for the BNL experiment is only 0.7 GeV, 20 times less than in the present proposal. BNL accelerator physicists have not yet achieved the required bunching of the beams and this is critical to the viability of this technique. We will assume that this hurdle is crossed and then list our remaining concerns. Where direct comparisons are made, they are to our KAMI-Far geometry which has similar sensitivity to that of the BNL experiment.
1. Working in such a low energy, very large solid angle [500 str] beam, something that has not been attempted before, could be problematic. A major problem for the KEK experiment attempting to measure , which uses a beam with some similar characteristics to that proposed by BNL, has been a sea of low-energy neutrons. The BNL experiment has collaborators from this KEK experiment so they should be well aware of such problems. And BNL is in the process of measuring the neutron flux. From our experience, all important effects from a neutron halo are much reduced at higher energy where beams are naturally of smaller solid angle and the experiment is situated further from the production target. Better geometry really helps, especially in a neutral beam.
2. Higher energy photons are easier to veto than lower energy ones, as has been seen in the earlier discussions in this proposal. Thus, the constraint of working at lower energies to be able to use time-of-flight means that, in general, one needs to veto lower energy photons. This eats somewhat into the advantage of needing less veto power. (However, with kinematic reconstruction one does suppress some low-energy photons with a missing mass cut. And at higher energy the faster ’s in the lab, when they decay nearly along their line-of-flight, can produce even lower energy photons than for the lower energy case.)
3. As another consequence of the lower energy beam, the total neutron flux for the BNL experiment is much higher than for the FNAL one. At BNL, it is estimated to be roughly 5 GHz while at FNAL, it is 200 MHz. The BNL proponents argue that most of the neutrons are of too low an energy to be of any concern, and that they are much more spread out in time than the expected signals from decay photons. Nevertheless, given that both detectors have a Back-Anti or beam catcher that must live in such environments, this is a concern.
4. Another problem for the BNL experiment (not mentioned in their proposal) could be anti-neutrons in the beam. We have said that a high neutron flux, particularly a halo, could be serious. The BNL group argues that the most important problem with neutrons is the production of from material such as residual gas in the vacuum. They then rightly argue that only neutrons above 800 MeV/c can produce ’s (most of the 5 GHz is below that value). However, anti-neutrons can and do produce ’s even at rest; and if there is a component of anti-neutrons in the halo, this could be even more serious in faking photons in their detector. Of course at higher energies, neutrons and anti-neutrons behave for all intents and purposes identically. The increase in the cross-section for very low energy anti-neutrons means that the BNL group should also worry about (and measure) the anti-neutron content of their beam: estimates would put it at a few percent of the kaon rate.
5. The imposed kinematic cut to reject the events also rejects 65% of signal events. Also, the requirement of measuring the photon energies and angles means that an active converter must be employed (see 7 below) which costs another factor of 2 in acceptance. These are the two major factors contributing to the FNAL experiment having 7% acceptance (see Table 23) while at BNL it is 1.6%. As a result, the BNL kaon decay rates, for similar sensitivity, are about a factor of 9 greater than for FNAL (25 MHz vs. 2.8 MHz) as seen in Table 4.
6. Another concern is associated with the geometry of the BNL “beam-catcher.” Again for timing reasons, their layout shows this device situated 15 m behind the calorimeter; and the beam pipe in this region must be surrounded by anti-counters to catch any photons from kaon decays in the decay region. But the rates in these counters will be high: about 70 MHz just from kaon decays occurring in this 15 m region alone. Thus, the full rate of kaon decays that the BNL experiment needs to reject is 95 MHz, more than 30 times the similar rate for our proposed experiment. These rates are getting to the point where one worries about serious veto dead-time and, more importantly, inefficiencies.
7. Additional problems arise because of the rather elaborate photon converter the BNL group is forced to use in order to reconstruct the decay photons. We have already mentioned the loss in acceptance that this entails. But more serious is the spreading of the resulting electromagnetic showers. In order to obtain the desired resolution, the BNL group must add in calorimeter channels corresponding to a region of diameter of about 120 cm [30]. The corresponding figure for the KTeV calorimeter is just 15 cm. Given the much higher rate conditions at BNL than at FNAL as well as the correspondingly greater weight that a stray minimum-ionizing particle has at lower energy, this is an area of considerable concern. (In the first phase of E799, we also had a converter situated in front of a precision calorimeter, but in the end the complications associated with shower spreading were never outweighed for the physics we were doing by its purported advantages.) Additionally, because extremely good timing is required from the calorimeter and given that their beam is a thin rectangle taking up a good part of the width of the calorimeter, a bar geometry is being considered with only a y-view [30]. Thus the effective region that is added together to account for a single photon becomes a significant fraction of the area of the calorimeter itself.
8. To obtain the required vacuum, the BNL group has opted to configure their photon veto system outside of the vacuum. From our experience with counters operating in vacuum, we can obtain a sufficient vacuum without the problems associated with a roughly 5% vacuum wall between the kaon decay and the detector. Having the counters in vacuum improves their efficiency, especially in the low energy region. This is an important consideration in our design.
9. Finally, the BNL experiment, if built as configured in their proposal, would attack a limited area of neutral kaon physics. It is of course good to focus on a particular problem, particularly one with the importance of the decay mode. However, it is also good to have a broad program and it appears that there is little else the BNL experiment can address. With the wall of the vacuum tank and no magnetic field or tracking, they will not be able to study any charged mode that requires background rejection. And the granularity of the calorimeter, as discussed above, may not allow for any incisive study of multi-body neutral decays.
In contrast, our approach is to produce a detector which is fully hermetic and has state-of-the-art tracking capabilities, allowing a broad program of investigation. We have opted for high acceptance and therefore relatively low rates and clean signatures: a high energy, very well defined and shielded beam with low neutron contamination, no conversions, and vetos in vacuum. We have outlined an R&D program which will reveal whether we can achieve the necessary rejection power which, admittedly, will be very challenging.
Our comments about the BNL proposal are made in the spirit of giving the reader our honest reservations about their approach. We have had the advantage of having their proposal available in the preparation of our own one. We, of course, look forward to their comments about the present document.
9 Detector Development Plan
As KAMI is a natural extension of the ongoing KTeV experiment, we greatly benefit from KTeV’s current activities. KTeV completed the first phase of its highly successful data taking in September 1997, with plans to continue a second phase of the experiment in 1999, with minor modifications.
The existing KTeV detector represents a significant investment of time, money, and manpower. It can evolve into a powerful detector for KAMI in an efficient and cost effective manner. This Section first describes the current R & D activities within the KTeV group which are directly related to our plans for making the transition from KTeV to KAMI. Then a plan for bringing the Main Injector beam to the existing KTeV target and using the existing KTeV detector facility for KAMI R&D studies is described.
Our ultimate goal for these proposed R&D studies is to determine if it is indeed possible to design a detector which meets the specifications required for sufficient background rejection, as described in Section 6.
9.1 Studies of data from KTeV
9.1.1 CsI calorimeter
KTeV’s greatest asset is the CsI calorimeter. As already mentioned in Section 5.1, it has been demonstrated to perform to a very high level. Energy resolution, position resolution and fusion rejection efficiency have been studied with very encouraging results. These results were incorporated into the Monte Carlo simulation programs, which produced the background study reported in Section 6.
We will continue to study the detection inefficiency for photons of various energies as well as the time resolution of the CsI. Both issues can be addressed using existing KTeV data. These studies should conclude shortly.
9.1.2 Vacuum photon veto
The vacuum veto detectors in KTeV, referred to as the Ring Counters, were designed primarily to reduce the 3 background contribution to the 2 signal. They have performed this task well. While the hermeticity and level of performance required by the photon veto detectors for KAMI are well in excess of that required by KTeV, the KTeV Ring Counters still provide us with a valuable tool for understanding photon veto counter performance. A detailed analysis of the KTeV Ring Counter performance will provide valuable information on how to design veto detectors for KAMI. These studies are ongoing.
9.1.3 Back Anti
The Back Anti (BA) resides in the neutral beam and detects photons which pass through the beam hole of the CsI calorimeter. Since it is exposed to an intense flux of neutrons and kaons, degradation of its veto efficiency has been observed in KTeV. For example, for typical E799 intensities (for rare decay studies), the neutron flux is 44 MHz at the BA. As the existing BA has one nuclear interaction length, with the low energy threshold required for the study in the Dalitz decay mode, the signal sensitivity is reduced by 50% due to neutron interactions. We are developing the best algorithm possible to reduce backgrounds while maintaining good signal sensitivity.
9.2 Detector R&D at KTeV 99
The anticipated KTeV run in 1999 will give us an ideal opportunity to study detector prototypes for KAMI in a realistic environment. As described in our Letter of Intent for KTeV 99 [23], we propose to perform detector R & D in two areas; photon vetos and fiber tracking.
9.2.1 Vacuum photon veto
The KAMI vacuum veto is based on the existing KTeV photon veto design. However, to achieve much better efficiency for low energy photons as low as several MeV, finer sampling using 1 mm lead sheets (instead of 2.8 mm in KTeV), thicker scintillator (5 mm instead of 2.5 mm in KTeV), and more dense WLS fiber readout are currently being considered. At the same time, we are considering the use of either extruded or injection molded scintillator in order to reduce costs significantly.
We plan to develop a small prototype detector (about 50 cm by 50 cm active region) based on our current design described in Section 4.3. The key issues to be studied are:
-
1.
Light collection efficiency i.e. the number of photo electrons per incident energy as a function of thickness of the scintillator and the density of WLS fibers;
-
2.
Detection efficiency for low energy photons (0 - 20 MeV), as a function of lead sheet thickness and tilt angle;
-
3.
Detection efficiency for high energy photons ( 1 GeV), as a function of total depth;
-
4.
Pulse shape and time resolution; and
-
5.
Mechanical design, including support structure for the lead sheets and the interface between the WLS fiber routing and the vacuum pipe.
9.2.2 Back Anti
The Back Anti is critical for detecting photons down the CsI beam holes from and decays. It covers the largest acceptance of all the photon vetos and it must operate in an environment with a significant neutron flux.
Under KAMI operating conditions, the neutron flux is expected to exceed 100 MHz. Therefore it becomes critical to design a BA which is neutron transparent, yet has high rejection power for photons. One way to achieve such rejection is through fine-grained depth segmentation, with active sampling every 3-4 radiation lengths. The energy threshold on each individual section can be tuned to maximize photon rejection and to distinguish photons from neutrons. Fast timing resolution is also useful to distinguish out-of-time neutron interactions, once the beam is debunched as expected for KAMI. For this reason, we are considering a Cherenkov medium such as lucite or quartz as the active material, as described in Section 4.3.3.
During the KTeV 1999 run, a neutron flux of close to 100 MHz is expected. To study using the Dalitz mode, we must use the BA to veto photons in this environment. Therefore, we plan to develop a KAMI-compatible Back Anti so that we can fully test its functionality in a realistic environment during the KTeV 1999 run.
9.2.3 Fiber tracking
The scintillating fiber tracker is another major piece of new hardware necessary for KAMI. We have been following the developments made by the D0 collaboration closely, and we have benefited from their experience [28]. The required number of channels is about the same as for the D0 fiber tracker, though the mechanical design is quite different. The KAMI fiber tracking planes will be operated inside of the vacuum decay volume and will have holes cut out of their center to allow beam to pass through. We are considering 500 m diameter fibers, assuming that the photon yield is sufficient.
We plan to develop our own prototype device consisting of thin fibers and a mechanical structure which allows operation in the vacuum. It is our hope that we can borrow resources from the D0 collaboration, in particular, the VLPC readout and associated cryogenics.
Members of KTeV have recently started working on the D0 fiber tracker in order to gain critical experience with this new technology which will eventually be applied to KAMI.
9.3 R & D with Main Injector beam
Physics data taking for the 1999 KTeV run will be completed by the end of FY99. The next natural step is to bring the Main Injector beam to the KTeV target station. In addition to learning a great deal about the transport of 120 GeV beam, we could begin to understand the performance of individual detector elements with the lower energy kaons.
9.3.1 120 GeV beam study with the KTeV target station
The highest priority will be the measurement of kaon and neutron production rates with various targeting angles using the Main Injector beam. The KTeV spectrometer magnet can be run at a lower field setting in order to measure the kaon flux. The neutron flux can be measured using the new BA which will be developed and used for the KTeV 1999 run. The beam profile can be studied by using reconstructed kaon decays.
In principle, we can study all the beam parameters necessary for the KAMI-Far option without any serious upgrade of the KTeV spectrometer.
9.3.2 Detector study
Prototypes of the vacuum veto detector as well as the fiber tracker will continue to be studied after the KTeV 99 run. Fully reconstructed kaon decays can be used to understand their performance in detail. As mentioned several times, understanding the photon detection efficiency at low energy (20 MeV) and high energy (1GeV) is most critical for background-free detection of . We plan to complete all of the studies by the end of the year 2000 with Main Injector beam.
10 Cost Estimate and Schedule
10.1 Cost estimate
We have just started a rough cost estimate based on our experience with KTeV. This section contains estimates only for the major items. We expect to complete a more through study by the time of the submission of a proposal.
The total cost of the vacuum veto detector is estimated to be $4.4M. The cost is broken down in Table 24.
The total cost of the fiber tracking system is dominated by the cost of the VLPC detectors and by the associated electronics and cryogenics. A cost breakdown appears in Table 25. This estimate is for reading out both ends of the fibers.
| Item | Unit cost | Amount | Total |
|---|---|---|---|
| Plastic Scinti.(5 mm t) | $6k/ton | 100 ton | $0.60M |
| Lead Sheet (1 mm t) | $3k/ton | 200 ton | $0.60M |
| WLS Fiber (1 mm ) | $0.8/m | 1500 km | $1.20M |
| Photo tube (2”,Linear) | $400/tube | 1000 | $0.40M |
| Photo tube (2”, FM) | $1000/tube | 100 | $0.10M |
| Vacuum tank etc. | $1.50M | ||
| Total Cost | $4.4M |
| Item | Unit cost | No. of Unit | Total |
|---|---|---|---|
| VLPC | $25/ch | 98658 | $2.5M |
| Preamp etc. | $25/ch | 98658 | $2.5M |
| Fiber plane etc. | $100K/module | 5 | $0.5M |
| Optical cables | $100K/module | 5 | $0.5M |
| Total cost | $6.0M |
The overall cost estimate for the entire detector is listed in Table 26. It totals $15.6 M. This includes the cost of detector upgrades for both the KAMI-Far and KAMI-Near options. However, the cost for the new target station for the KAMI-Near option is not included.
| Item | Unit cost | Units | Total |
|---|---|---|---|
| Beam Collimator | $0.5M | ||
| Mask Anti | $200K | 2 | $0.4M |
| Photon Veto | $3-700K | 7 | $4.4M |
| Fiber Tracker | $1M | 5 | $6.0M |
| Magnet regaping | $0.3M | ||
| Charged hodoscope | $0.1M | ||
| Vacuum window | $0.1M | ||
| CsI Anti | $200K | 2 | $0.4M |
| CsI upgrade | $0.2M | ||
| Back Anti | $0.2M | ||
| Muon range counter | $50K | 10 | $0.5M |
| DAQ/Electronics | $2.0M | ||
| Others | $0.5M | ||
| Total cost | $15.6M |
10.2 Cost estimate for detector R & D
We have outlined the detector R &D plan in Section 9. This can be achieved at a modest cost spread over the next three years. Table 27 shows the itemized yearly budget to carry out this R&D program. Also shown here is the cost of the Back Anti for the KTeV 99 run, since this development is directly related to KAMI.
| Year | Items | Cost | Subtotal |
|---|---|---|---|
| 1998 | Vacuum Photon Veto Prototype | $60K | |
| Extruded (or injection molded) scintillator | $25K | ||
| WLS fiber | $10K | ||
| Lead sheet | $5K | ||
| Mechanical structure | $10K | ||
| PMT and readout electronics | $10K | ||
| Back Anti, EM Section (used in KTeV 99) | $50K | ||
| Quartz (or lucite) plates | $30K | ||
| Light guide | $10K | ||
| Mechanical modificaion to KTeV Back Anti | $10K | ||
| Back Anti,Hadronic Section (used in KTeV 99) | $40K | ||
| Scintillator plate | $10K | ||
| Light guide | $5K | ||
| Iron plate | $5K | ||
| Support frame | $10K | ||
| PMT and readout electronics | $10K | ||
| 1999 | Fiber Tracker Prototype | $60K | |
| Thin fiber ribbon | $10K | ||
| Supporting frame | $10K | ||
| Vacuum feed through | $5K | ||
| Clear light guide | $5K | ||
| VLPC, readout electronics and cryogenics | $30K | ||
| Vacuum Photon Veto Prototype (Second version) | $50K | ||
| Readout electronics R&D | $30K | ||
| 2000 | Vacuum Veto (Pre-production version) | $50K | |
| Fiber Tracker (Pre-production version) | $50K | ||
| Total Cost | $390K |
10.3 Schedule
In order to finalize the detector design and operating conditions, we consider the following two phases of R & D as the most critical:
-
1.
Detailed study of the three new major detectors systems; vacuum photon veto, Back Anti and fiber tracker;
-
2.
Understand and optimize the kaon beam line, including target position, targeting angle and collimator design for both and charged decay modes.
We expect to complete all necessary studies by the end of year 2000 so that we can start construction of major hardware in 2001. Table 28 lists the milestones necessary to meet this goal. Here we assume that we start from a dedicated run with the KAMI-Far configuration at the earliest possible date, since it requires the least expensive upgrades to the existing KTeV detector. Our final goal is to construct the KAMI-Near configuration with full tracking capability by the year 2005. We believe that this plan is compatible with Fermilab’s plans over this time period.
| Year | Milestone |
|---|---|
| 1997 | Submission of EOI. |
| 1998 | Construction of the prototype of Vacuum veto and BA. |
| Submission of the scientific proposal. | |
| 1999 | KTeV 99 run. |
| First tests of photon veto, BA, fiber tracker prototypes. | |
| Submission of the Technical Design Report. | |
| 2000 | First delivery of the Main Injector beam onto the KTeV target. |
| Neutral beam study. | |
| Tests of detector prototypes (veto, BA, tracker) continue. | |
| Final design of the detector completed. | |
| 2001 | Photon veto construction. |
| 2002 | Partial construction of fiber tracker. |
| 2003 | First physics data taking of with KAMI-Far. |
| Full construction of fiber tracker. | |
| 2004 | Second year of KAMI-Far operation, including charged modes. |
| KAMI-Near target station construction. | |
| 2005 | First physics data taking with KAMI-Near. |
| 2006 | KAMI-Near data taking continues… |
11 Conclusion
The neutral kaon program at Fermilab has a long and distinguished history. We believe the future is equally bright. With the advent of the Main Injector, we anticipate a great opportunity for incisive exploration of CP violation and other important physics in the kaon sector.
In this Expression of Interest, we have demonstrated that this bright future is made possible by combining the existing KTeV infrastructure with new state-of-the-art detector technology which has been largely developed at Fermilab for other experiments.
The physics importance of is compelling and it appears feasible to detect a large number of events which will allow a measurement of the parameter with an accuracy which is compatible with the measurements proposed at B factories.
Many other important decay modes are also accessible at sensitivity levels between and . These measurements are not possible at the dedicated experiments proposed at other Labs.
The KAMI project represents an efficient and cost effective plan for extending Fermilab’s neutral kaon program into the future. We plan to continue our current studies and will engage in an aggressive R&D program in order to make the best use possible of the formidable neutral kaon factory which will be provided by the Main Injector.
12 Acknowledgements
As we prepare this Expression of Interest to map out the future of the neutral kaon program at Fermilab, we would like to acknowledge the work of all of our KTeV Collaborators who have made the present possible. Without their dedicated efforts to make KTeV a success, it would not be possible to progress towards the future. We would also like to acknowledge the efforts of the numerous engineers and technicians from all of the collaborating institutions who helped to design and build the KTeV detector, much of which will be used for KAMI. We would like to thank Fermilab for its continuing support of our program. In particular, we would like to thank the Computing Division, Beams Division and Particle Physics Division for their invaluable support before, during and after the first KTeV run. Many thanks also to Elizabeth Pod from the University of Chicago for her help with several of the figures in this document.
References
- [1] G. Buchalla and A. J. Buras, Nucl. Phys. B400, 225 (1993).
- [2] G. Buchalla and A.J. Buras, Phys. Rev. D54, 6782 (1996).
- [3] A. J. Buras, hep-ph/9609324, September 1996 (to appear in “Workshop on K-Physics”, Orsay, May 1996).
- [4] A. J. Buras and R. Fleischer, hep-ph/9704376, April 1997 (To appear in “Heavy Flavors II”, World Scientific, 1997).
- [5] M. Weaver et al., Phys. Rev. Lett. 72, 3758 (1994).
- [6] K. Arisaka et al., KTeV Design Report: Fermilab Report FN-580 (Jan., 1992).
- [7] L. K. Gibbons et al., Phys. Rev. Lett. 70, 1203 (1993).
- [8] T. Nakaya, Flavor Changing Neutral Current Conference, Santa Monica, CA (1997).
- [9] V. O’Dell, KTeV Collaboration, “Status and New Results of the KTeV Rare Kaon Program” , MIST Workshop Fermilab, (May, 1997). To be published.
- [10] L. M. Seghal and M. Wanninger, Phys. Rev. D46, 1035 (1992); P. Heiliger and L.M. Seghal, Phys. Rev. D48, 4146 (1993).
- [11] G.R. Farrar, Phys. Rev. Lett. 76, 4111 (1996).
- [12] G.R. Farrar, Phys. Rev. Lett. 76, 4115 (1996).
- [13] I-H. Chiang et. al., BNL proposal P926, “Measurement of ,” (September 1996).
- [14] T. Inagaki et al., “Measurement of the decay,” KEK proposal, (June 1996).
- [15] Fermilab Report, “Switchyard in the Main Injector Era Conceptual Design Report”, C.Brown et al., (July 1997).
- [16] Fermilab Report, “Feasibility of 120 GeV Beam to KTeV and KAMI”, T.Kobilarcik, (July 1997).
- [17] Fermilab FN-568, “Conceptual Design Report: Kaons At The Main Injector”, K.Arisaka et al., (June 1991).
- [18] P. Heiliger and L.M. Seghal, Phys. Lett. B307, 182 (1993).
- [19] Fermilab Report, “KTeV Beam Systems Design Report”, R. Coleman et al., July 1994.
- [20] A. J. Malensek, FERMILAB-FN-0341 (1981).
- [21] D. Edwards et al., Phys. Rev. D18, 76 (1978).
- [22] J. Engler et al., Nucl. Phys. B84, 70 (1975).
- [23] E. Cheu et al., “A Letter of Intent to Continue the Study of Direct CP Violation and Rare Processes in Neutral Kaon Decays at KTeV in FY1999,” June 1997.
- [24] J.F. Donoghue, R. Holstein, and G. Valencia, Phys. Rev. D 35, 2769 (1987).
- [25] D.A. Harris et al., Phys. Rev. Lett. 71, 3918 (1993).
- [26] D. A. Harris et al. (E799-I), Phys. Rev. Rett. 71, 3914 (1993).
- [27] K. Arisaka et al., Phys. Rev. Lett. 71, 3910 (1993).
- [28] R. Ruchti, Nuclear Physics B44 (Proc. Suppl.), 308 (1995).
- [29] M. Atac, M Mishina et al., CDF/ANAL/TRACKING/PUBLIC3569 “Measurement of the Light Yield from Scintillating Fibers with IFT Prototype,” (April 11, 1996).
- [30] Doug Bryman, private communication.