Properties of Jets in Boson Events from 1.8 TeV Collisions
F. Abe
17 H. Akimoto
38
A. Akopian
31 M. G. Albrow
7 S. R. Amendolia
27
D. Amidei
20 J. Antos
33 S. Aota
36
G. Apollinari
31 T. Arisawa
38 T. Asakawa
36
W. Ashmanskas
18 M. Atac
7 F. Azfar
26 P. Azzi-Bacchetta
25
N. Bacchetta
25 W. Badgett
20 S. Bagdasarov
31
M. W. Bailey
22
J. Bao
40 P. de Barbaro
30 A. Barbaro-Galtieri
18
V. E. Barnes
29 B. A. Barnett
15 M. Barone
9 E. Barzi
9
G. Bauer
19 T. Baumann
11 F. Bedeschi
27
S. Behrends
3 S. Belforte
27 G. Bellettini
27
J. Bellinger
39 D. Benjamin
35 J. Benlloch
19 J. Bensinger
3
D. Benton
26 A. Beretvas
7 J. P. Berge
7 J. Berryhill
5
S. Bertolucci
9 S. Bettelli
27 B. Bevensee
26
A. Bhatti
31 K. Biery
7 M. Binkley
7 D. Bisello
25
R. E. Blair
1 C. Blocker
3 S. Blusk
30 A. Bodek
30
W. Bokhari
26 G. Bolla
29 V. Bolognesi
2 Y. Bonushkin
4
D. Bortoletto
29 J. Boudreau
28 L. Breccia
2 C. Bromberg
21
N. Bruner
22 E. Buckley-Geer
7 H. S. Budd
30 K. Burkett
20
G. Busetto
25 A. Byon-Wagner
7
K. L. Byrum
1 C. Campagnari
7
M. Campbell
20 A. Caner
27 W. Carithers
18 D. Carlsmith
39
J. Cassada
30 A. Castro
25 D. Cauz
27 Y. Cen
30
A. Cerri
27
F. Cervelli
27 P. S. Chang
33 P. T. Chang
33 H. Y. Chao
33
J. Chapman
20 M. -T. Cheng
33 M. Chertok
34
G. Chiarelli
27 T. Chikamatsu
36 C. N. Chiou
33
L. Christofek
13 S. Cihangir
7 A. G. Clark
10 M. Cobal
27
E. Cocca
27 M. Contreras
5 J. Conway
32 J. Cooper
7
M. Cordelli
9 C. Couyoumtzelis
10 D. Crane
1
D. Cronin-Hennessy
6 R. Culbertson
5 T. Daniels
19
F. DeJongh
7 S. Delchamps
7 S. Dell’Agnello
27
M. Dell’Orso
27 R. Demina
7 L. Demortier
31
M. Deninno
2 P. F. Derwent
7 T. Devlin
32
J. R. Dittmann
6 S. Donati
27 J. Done
34
T. Dorigo
25 A. Dunn
20 N. Eddy
20
K. Einsweiler
18 J. E. Elias
7 R. Ely
18
E. Engels
Jr
28 D. Errede
13 S. Errede
13
Q. Fan
30 G. Feild
40 Z. Feng
15 C. Ferretti
27
I. Fiori
2 B. Flaugher
7 G. W. Foster
7 M. Franklin
11
M. Frautschi
35 J. Freeman
7 J. Friedman
19 H. Frisch
5
Y. Fukui
17 S. Funaki
36 S. Galeotti
27 M. Gallinaro
26
O. Ganel
35 M. Garcia-Sciveres
18 A. F. Garfinkel
29
C. Gay
11
S. Geer
7 D. W. Gerdes
15 P. Giannetti
27 N. Giokaris
31
P. Giromini
9 G. Giusti
27 L. Gladney
26
M. Gold
22 J. Gonzalez
26 A. Gordon
11
A. T. Goshaw
6 Y. Gotra
25 K. Goulianos
31 H. Grassmann
27
L. Groer
32 C. Grosso-Pilcher
5 G. Guillian
20
J. Guimares
15 R. S. Guo
33 C. Haber
18
E. Hafen
19
S. R. Hahn
7 R. Hamilton
11 R. Handler
39 R. M. Hans
40
F. Happacher
9 K. Hara
36 A. D. Hardman
29 B. Harral
26
R. M. Harris
7 S. A. Hauger
6 J. Hauser
4 C. Hawk
32
E. Hayashi
36 J. Heinrich
26 B. Hinrichsen
14
K. D. Hoffman
29 M. Hohlmann
5 C. Holck
26 R. Hollebeek
26
L. Holloway
13 S. Hong
20 G. Houk
26
P. Hu
28 B. T. Huffman
28 R. Hughes
23
J. Huston
21 J. Huth
11
J. Hylen
7 H. Ikeda
36 M. Incagli
27 J. Incandela
7
G. Introzzi
27 J. Iwai
38 Y. Iwata
12 H. Jensen
7
U. Joshi
7 R. W. Kadel
18 E. Kajfasz
25 H. Kambara
10
T. Kamon
34 T. Kaneko
36 K. Karr
37 H. Kasha
40
Y. Kato
24 T. A. Keaffaber
29 K. Kelley
19
R. D. Kennedy
7 R. Kephart
7 P. Kesten
18 D. Kestenbaum
11
H. Keutelian
7 F. Keyvan
4 B. Kharadia
13
B. J. Kim
30 D. H. Kim
7a H. S. Kim
14 S. B. Kim
20
S. H. Kim
36 Y. K. Kim
18 L. Kirsch
3
P. Koehn
23 A. Köngeter
16
K. Kondo
36 J. Konigsberg
8 S. Kopp
5 K. Kordas
14
A. Korytov
8 W. Koska
7 E. Kovacs
7a W. Kowald
6
M. Krasberg
20 J. Kroll
7 M. Kruse
30 S. E. Kuhlmann
1
E. Kuns
32 T. Kuwabara
36 A. T. Laasanen
29 S. Lami
27
S. Lammel
7 J. I. Lamoureux
3 M. Lancaster
18 M. Lanzoni
27
G. Latino
27 T. LeCompte
1 S. Leone
27 J. D. Lewis
7
P. Limon
7 M. Lindgren
4 T. M. Liss
13 J. B. Liu
30
Y. C. Liu
33 N. Lockyer
26 O. Long
26
C. Loomis
32 M. Loreti
25 J. Lu
34 D. Lucchesi
27
P. Lukens
7 S. Lusin
39 J. Lys
18 K. Maeshima
7
A. Maghakian
31 P. Maksimovic
19
M. Mangano
27 M. Mariotti
25 J. P. Marriner
7
A. Martin
40 J. A. J. Matthews
22
R. Mattingly
19 P. Mazzanti
2
P. McIntyre
34 P. Melese
31 A. Menzione
27
E. Meschi
27 S. Metzler
26 C. Miao
20 T. Miao
7
G. Michail
11 R. Miller
21 H. Minato
36
S. Miscetti
9 M. Mishina
17 H. Mitsushio
36
T. Miyamoto
36 S. Miyashita
36 N. Moggi
27 Y. Morita
17
A. Mukherjee
7 T. Muller
16 P. Murat
27 S. Murgia
21
H. Nakada
36 I. Nakano
36 C. Nelson
7 D. Neuberger
16
C. Newman-Holmes
7 C.-Y. P. Ngan
19 M. Ninomiya
36
L. Nodulman
1 S. H. Oh
6 K. E. Ohl
40 T. Ohmoto
12
T. Ohsugi
12 R. Oishi
36 M. Okabe
36
T. Okusawa
24 R. Oliveira
26 J. Olsen
39 C. Pagliarone
27
R. Paoletti
27 V. Papadimitriou
35 S. P. Pappas
40
N. Parashar
27 S. Park
7 A. Parri
9 J. Patrick
7
G. Pauletta
27
M. Paulini
18 A. Perazzo
27 L. Pescara
25 M. D. Peters
18
T. J. Phillips
6 G. Piacentino
27 M. Pillai
30 K. T. Pitts
7
R. Plunkett
7 L. Pondrom
39 J. Proudfoot
1
F. Ptohos
11 G. Punzi
27 K. Ragan
14 D. Reher
18
A. Ribon
25 F. Rimondi
2 L. Ristori
27
W. J. Robertson
6 T. Rodrigo
27 S. Rolli
37 J. Romano
5
L. Rosenson
19 R. Roser
13 T. Saab
14 W. K. Sakumoto
30
D. Saltzberg
4 A. Sansoni
9 L. Santi
27 H. Sato
36
P. Schlabach
7 E. E. Schmidt
7 M. P. Schmidt
40 A. Scott
4
A. Scribano
27 S. Segler
7 S. Seidel
22 Y. Seiya
36
F. Semeria
2 G. Sganos
14 T. Shah
19 M. D. Shapiro
18
N. M. Shaw
29 Q. Shen
29 P. F. Shepard
28 M. Shimojima
36
M. Shochet
5 J. Siegrist
18 A. Sill
35 P. Sinervo
14
P. Singh
13 K. Sliwa
37 C. Smith
15 F. D. Snider
15
T. Song
20 J. Spalding
7 T. Speer
10 P. Sphicas
19
F. Spinella
27 M. Spiropulu
11 L. Spiegel
7 L. Stanco
25
J. Steele
39 A. Stefanini
27 J. Strait
7
R. Ströhmer
7a D. Stuart
7 G. Sullivan
5
K. Sumorok
19 J. Suzuki
36 T. Takada
36 T. Takahashi
24
T. Takano
36 K. Takikawa
36 N. Tamura
12
B. Tannenbaum
22 F. Tartarelli
27
W. Taylor
14 P. K. Teng
33 Y. Teramoto
24 S. Tether
19
D. Theriot
7 T. L. Thomas
22 R. Thun
20 R. Thurman-Keup
1
M. Timko
37 P. Tipton
30 A. Titov
31 S. Tkaczyk
7
D. Toback
5 K. Tollefson
30 A. Tollestrup
7 H. Toyoda
24
W. Trischuk
14 J. F. de Troconiz
11 S. Truitt
20
J. Tseng
19 N. Turini
27 T. Uchida
36 N. Uemura
36
F. Ukegawa
26
G. Unal
26 J. Valls
7a S. C. van den Brink
28
S. Vejcik
III
20 G. Velev
27 R. Vidal
7 R. Vilar
7a
M. Vondracek
13
D. Vucinic
19 R. G. Wagner
1 R. L. Wagner
7 J. Wahl
5
N. B. Wallace
27 A. M. Walsh
32 C. Wang
6 C. H. Wang
33
J. Wang
5 M. J. Wang
33
Q. F. Wang
31 A. Warburton
14 T. Watts
32 R. Webb
34
C. Wei
6 H. Wei
35 H. Wenzel
16 W. C. Wester
III
7
A. B. Wicklund
1 E. Wicklund
7
R. Wilkinson
26 H. H. Williams
26 P. Wilson
5
B. L. Winer
23 D. Winn
20 D. Wolinski
20 J. Wolinski
21
S. Worm
22 X. Wu
10 J. Wyss
25 A. Yagil
7 W. Yao
18
K. Yasuoka
36 Y. Ye
14 G. P. Yeh
7 P. Yeh
33
M. Yin
6 J. Yoh
7 C. Yosef
21 T. Yoshida
24
D. Yovanovitch
7 I. Yu
7 L. Yu
22 J. C. Yun
7
A. Zanetti
27 F. Zetti
27 L. Zhang
39 W. Zhang
26 and
S. Zucchelli2(CDF Collaboration)1Argonne National Laboratory, Argonne, Illinois 604392Istituto Nazionale di Fisica Nucleare, University of Bologna,
I-40127 Bologna, Italy3Brandeis University, Waltham, Massachusetts 022544University of California at Los Angeles, Los
Angeles, California 900245University of Chicago, Chicago, Illinois 606376Duke University, Durham, North Carolina 277087Fermi National Accelerator Laboratory, Batavia, Illinois
605108University of Florida, Gainesville, FL 326119Laboratori Nazionali di Frascati, Istituto Nazionale di Fisica
Nucleare, I-00044 Frascati, Italy10University of Geneva, CH-1211 Geneva 4, Switzerland11Harvard University, Cambridge, Massachusetts 0213812Hiroshima University, Higashi-Hiroshima 724, Japan13University of Illinois, Urbana, Illinois 6180114Institute of Particle Physics, McGill University, Montreal
H3A 2T8, and University of Toronto,
Toronto M5S 1A7, Canada15The Johns Hopkins University, Baltimore, Maryland 2121816Institut für Experimentelle Kernphysik,
Universität Karlsruhe, 76128 Karlsruhe, Germany17National Laboratory for High Energy Physics (KEK), Tsukuba,
Ibaraki 315, Japan18Ernest Orlando Lawrence Berkeley National Laboratory,
Berkeley, California 9472019Massachusetts Institute of Technology, Cambridge,
Massachusetts 0213920University of Michigan, Ann Arbor, Michigan 4810921Michigan State University, East Lansing, Michigan 4882422University of New Mexico, Albuquerque, New Mexico 8713123The Ohio State University, Columbus, OH 4321024Osaka City University, Osaka 588, Japan25Universita di Padova, Istituto Nazionale di Fisica
Nucleare, Sezione di Padova, I-36132 Padova, Italy26University of Pennsylvania, Philadelphia,
Pennsylvania 1910427Istituto Nazionale di Fisica Nucleare, University and Scuola
Normale Superiore of Pisa, I-56100 Pisa, Italy28University of Pittsburgh, Pittsburgh, Pennsylvania 1526029Purdue University, West Lafayette, Indiana 4790730University of Rochester, Rochester, New York 1462731Rockefeller University, New York, New York 1002132Rutgers University, Piscataway, New Jersey 0885533Academia Sinica, Taipei, Taiwan 11530, Republic of China34Texas A&M University, College Station, Texas 7784335Texas Tech University, Lubbock, Texas 7940936University of Tsukuba, Tsukuba, Ibaraki 315, Japan37Tufts University, Medford, Massachusetts 0215538Waseda University, Tokyo 169, Japan39University of Wisconsin, Madison, Wisconsin 5370640Yale University, New Haven, Connecticut 06520
Abstract
We present a study of events with bosons and hadronic jets produced
in collisions at a center of mass energy of 1.8 TeV. The data
consist of 51400 decay candidates from 108 pb-1 of integrated
luminosity collected with the CDF detector at the Tevatron Collider. The
cross sections and jet production properties have been measured for
+ 1 to 4 jet events. The data are compared to predictions
of leading order QCD matrix element calculations with added gluon
radiation and simulated parton fragmentation.
pacs:
14.70.Fm, 12.38.Qk, 13.85.Qk
The production of bosons in collisions at the Fermilab Tevatron
Collider provides the opportunity to test perturbative QCD predictions at
large momentum transfers. Previous analyses have used these data to study
production and decay properties
[1, 2, 3], diboson (, , )
production [4, 5], and the pair production of top quarks
[6, 7]. In this Letter, we present cross section measurements
and kinematic properties of direct single boson production with jets.
After events from top decay are removed, the data are compared to quantum
chromodynamics (QCD)
predictions of single + jet production. These comparisons test how well
the standard model predicts hadronic production properties of bosons
at the highest center of mass energies studied to date.
This analysis uses 108 pb-1 of integrated luminosity collected with
the CDF detector [8] from 1992–95. The principal
detector elements used for this measurement are the vertex tracking
chamber (VTX), the central tracking chamber (CTC), and the calorimeters.
The VTX, a wire time-projection chamber, locates interactions along the
beam direction. The CTC, a cylindrical drift
chamber, measures the momenta of charged particles in the
region [9]. Both tracking detectors are immersed
in a 1.4 T magnetic field. The electromagnetic
and hadronic calorimeters cover the range and are used to
measure the energies of electrons and jets.
decay candidates are identified in events that pass a high
transverse energy ( ) electron trigger. The event selection
requires an isolated [10] electron in the central calorimeter
() that has 20 GeV and satisfies tight
selection criteria [11]. The reconstructed neutrino transverse
energy (), measured from the imbalance of in the calorimeter,
must exceed 30 GeV.
Jets in the events are clustered using a cone algorithm
[12] with radius .
We account for parton energy deposited outside the cone, and
correct for energy contaminating the cone from both the underlying event
and additional interactions.
We count jets with 15 GeV and , and reject any events that have a jet within = 0.52
of an electron. Of 51431 candidate events, 11144 events have
1 jet, 2596 have 2 jets, 580 have 3 jets, 126 have
4 jets, and 21 have 5 jets. These jet multiplicities are
subsequently corrected for jets produced in additional interactions
that occur in the same bunch crossing as the event. There is a 1%
probability that an event will have a single extra jet; the probability
drops by about a factor of 6 for each additional extra jet.
The systematic uncertainties on jet counting are determined by varying
the jet energy by
5%, the jet by 0.2, the probability of jets from
additional interactions by , and the correction
for energy contamination in the jet cone by 50% (0.5 GeV on average).
The combined uncertainty ranges from 10% for the 1
jet sample to 30% for the 4 jet sample and dominates the uncertainties in
the + jet cross section measurements.
We measure the cross section for production as a
function of jet multiplicity from the number of observed
candidates with jets using the equation
(1)
where is the detection efficiency, is the
estimated background, and BR is the branching ratio for decay.
For the inclusive cross section times branching ratio (BR) we use a previous CDF measurement of 2490 120 pb
[13]. This method takes advantage of the cancellation of some
systematic uncertainties in the ratios, and gives the most
accurate relative + jet cross sections.
The estimate of in Eq. (1) includes
, , and
direct QCD multijet production. The and
contributions are small (3%) and have a negligible effect on the ratios.
Multijet contamination is measured with
a sample obtained by removing the
electron isolation
and requirements of the selection and then
extrapolating from the multijet-dominated region
into the signal region. This background ranges from (2.9 0.9)% for
the 0 jet sample to (27 11)% for the 4 jet sample.
In order to isolate direct single production
(), also includes standard model
predictions of diboson and top quark production. The contribution from and
production is negligible; however, we include a correction to the jet
multiplicity to account for events in which the photon is
reconstructed as a jet. This is predicted to occur in (0.4 0.1)% of
events. The rate of events from standard model ranges
from ()% for 0 jet events to ()% for 4 jet
events. The cross sections and kinematic distributions are corrected for these
contributions.
The final correction to the number of + jet candidates
accounts for the efficiency ( in Eq. (1))
of identifying decays.
The acceptance due to restrictions on the electron , , and
detector fiducial volume was determined using a leading-order QCD
calculation [14] for + 1 to 4 jets.
The electron-jet overlap rate is calculated directly from the
data by taking events and replacing the decay with
a simulated decay, preserving the boson transverse momentum ().
The overall efficiency also includes the
efficiency of the online trigger and the efficiency of the
electron identification. The combined efficiency is
(19.6 0.3)% for 0 jets and remains
nearly constant as a function of the number of jets.
FIG. 1.:
Cross sections for + jets (top) and + jets
(bottom) versus inclusive jet multiplicity. The lines are fits of an
exponential to the data. The theory is shown as a
shaded band which represents the uncertainty due to the renormalization scale.
The 0 jet prediction is a Born-level calculation for production.
The measured cross sections for single + jet events are
listed in Table I and plotted in Fig. 1.
Also included in Table I are the ratios , which
show that the cross sections fall by about a factor
of five with each additional jet.
The measured cross sections and kinematic distributions are compared to
predictions of leading order (LO) pertubative QCD using the VECBOS
[14] Monte Carlo program. We use a two-loop evolution
evaluated at renormalization scales of either of the partons or of the boson, representing reasonable extremes. The CTEQ3M [15]
parton density functions are used with the factorization scale set to the
renormalization scale. The QCD predictions are at least five times more
sensitive to the renormalization scale than to the factorization scale or the
choice of parton density functions (e.g. MRSA’ [16]). Initial state
gluon radiation, final state parton fragmentation, and hadronization are
simulated using the HERWIG [17] Monte Carlo program. This procedure
represents a partial higher-order correction to the tree-level diagrams and we
refer to it as enhanced leading order (ELO). The generated hadronic showers are
processed with the full CDF detector simulation. The same reconstruction and
selection criteria applied to experimental data are used on the simulated data.
FIG. 2.:
Transverse energy distribution of the
(a) highest jet in 1 jet events, (b)
second highest jet in 2 jet events, (c)
third highest jet in 3 jet events, and
(d) fourth highest jet in 4 jet events.
The curves represent the ELO QCD
predictions. The renormalization scale is for the solid curves
and for the dashed curves (a–c only). The theory is normalized to the
data for each distribution and the errors are the sum of statistical and
systematic uncertainties.
The QCD predictions are listed in Table I and plotted
with the measured cross sections in Fig. 1. The
sensitivity of the calculated cross sections to the renormalization
scale is indicated by the shaded band. The harder scale ()
predicts relative cross sections that are consistent with the measured
cross sections but are low in magnitude by about a factor 1.6, while the softer
scale () predicts cross sections generally closer in
magnitude but with a ratio ranging from 1.28 for 1 jets
to 0.53 for 4 jets.
Thus, within the inherent uncertainty of the LO
calculation, the predicted and measured + jet cross
sections are in agreement for = 2 to 4. For comparison,
Fig. 1 also shows the cross sections and QCD predictions
for + jets from a previous CDF measurement [18].
These have the same general features as production, but are lower in
cross section by about a factor of 10.
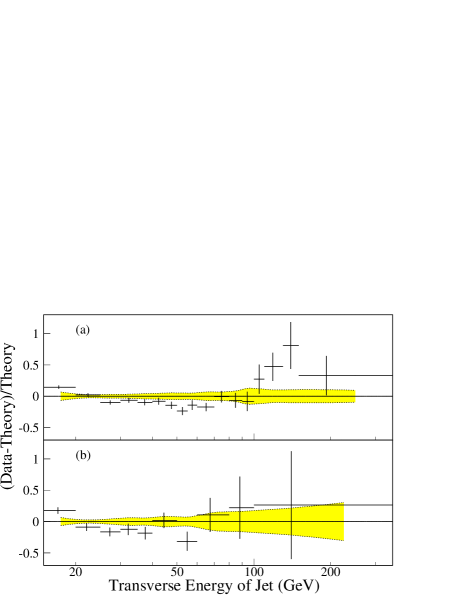
FIG. 3.:
(Data–theory)/theory () for the jet transverse energy distribution
of the first
and second highest jets in (a) 1 and (b) 2 jet
events, respectively. The error bars are statistical uncertainties and
the band represents the systematic uncertainty on the shape.
The theory is normalized to the data.
Details of the QCD predictions are studied using kinematic distributions
of jets in events. We select events from the ELO simulated sample
with the same selection criteria used for the data. Shape comparisons
are made by normalizing the theory to data.
We first compare
the measured spectra (Fig. 2) of jets 1–4, ordered by
decreasing , to the ELO QCD prediction [19]. The
sensitivity of the prediction to the renormalization scale is
illustrated by varying it from (solid curve) to (dotted
curve). The correspondence
between data and theory for these
distributions is more clearly seen in Fig. 3, which shows
(data–theory)/theory for the same spectra. Correlations between jets
are studied by measuring the separation () and invariant mass
() of pairs of jets. The distributions of and for the
two highest jets in 2 jet and 3 jet events are shown in
Fig. 4. The systematic uncertainties
are determined by the change in the distributions when the jet energy
and subtracted backgrounds are varied independently within their limits. The error
bars in Figs. 2 and 4 include statistical
and systematic uncertainties.
FIG. 4.:
Distributions of dijet mass and separation in space between the two
highest- jets for + 2 jet events (top) and + 3
jet events (bottom). The curves represent the ELO QCD
predictions: (solid) and (dashed).
The shape comparisons in Figs. 2–4
demonstrate that the ELO QCD predictions reproduce the main
features of both the jet and jet-jet correlation distributions. In
particular,
the measured and predicted jet spectra for the four
highest jets generally remain within 15% over three orders of
magnitude. The correlation between jets, as measured by , is well
predicted by the QCD calculation (Fig. 4c and d), and
the measured invariant mass distributions (Fig. 4a and
b) are in fair agreement with the QCD predictions. However, the high
statistics of our + 1 jet sample show the limitation of this
QCD prediction. Fig. 3a shows that the theory calculation
underestimates the cross section for the lowest ( GeV) and highest
( GeV) jets. These regions rely heavily upon the partial
higher-order corrections generated by HERWIG. At low , initial state gluon
radiation is sometimes hard enough to become the
highest jet and supersede
the parton generated in the LO matrix element. For events with the highest jet
GeV, over 50% of the + 1 jet events have at least 2 jets
which explicitly indicates the need for higher-order corrections to the + 1
parton calculation. As expected, the ELO QCD calculation only partly corrects
for the higher-order QCD terms.
In summary, this Letter contains an analysis of jet production
associated with events selected from 108 pb-1 of
collisions at a center of mass energy of 1.8 TeV. Data are
compared to enhanced LO QCD predictions (LO parton matrix elements with
HERWIG-simulated fragmentation) to determine the reliability of QCD
calculations. The ratio of the measured to predicted cross section is
1.28 0.16 () and 1.65 0.20 () for
+ 1 jet events.
For higher jet
multiplicities, the two predictions bracket the measurement, with
the prediction at a approximately constant fraction
below the measured cross section. The shapes of the QCD-predicted jet
production properties are in general agreement with the data, but the
statistics of the data are large enough to show some limitations
of the enhanced LO QCD predictions.
Jets
(pb)
(Data)
1
471 5 57
367 5
1.28 0.16
285 4
1.65 0.20
0.189 0.021
2
101 2 19
112 5
0.90 0.17
58.1 1.5
1.74 0.33
0.214 0.015
3
18.4 1.1 5.2
27.2 2.1
0.67 0.20
12.3 0.6
1.49 0.44
0.182 0.020
4
3.1 0.6 1.3
5.8 0.7
0.53 0.25
2.3 0.2
1.33 0.62
0.166 0.042
5
0.24 0.24 0.28
0.080 0.109
TABLE I.:
+ jet cross sections. The first error on the data cross
sections is the statistical error; the second includes the systematic
error on the acceptance, the background systematic, and the
jet-counting uncertainty, as described in the text. The QCD Monte Carlo
cross sections () are generated using
VECBOS for scales of and
. The uncertainties for the theory are statistical.
We thank the Fermilab staff and the technical staffs of the
participating institutions for their vital contributions. We also thank
Walter Giele and Nigel Glover for many useful discussions. This
work was supported by the U.S. Department of Energy and National Science
Foundation; the Italian Istituto Nazionale di Fisica Nucleare; the Ministry of
Education, Science and Culture of Japan; the Natural Sciences and Engineering
Research Council of Canada; the National Science Council of the Republic of
China; and the A. P. Sloan Foundation.
REFERENCES
[1]
F. Abe et al., Phys. Rev. Lett. 76, 3070 (1996).
[2]
F. Abe et al., Phys. Rev. Lett. 70, 4042 (1993).
[3]
S. Abachi et al., Phys. Rev. Lett. 75, 3226 (1995).
[4]
F. Abe et al., Phys. Rev. Lett. 75, 1017 (1995).
[5]
F. Abe et al., Phys. Rev. Lett. 74, 1936 (1995).
[6]
F. Abe et al., Phys. Rev. D 51, 4623 (1995).
[7]
F. Abe et al., Phys. Rev. Lett. 74, 2626 (1995).
[8]
F. Abe et al., Nucl. Instrum. Methods A 271,
387 (1988).
[9]
We use a coordinate system in which is along the proton
direction, is the azimuthal angle, is the polar
angle and is
the pseudorapidity. We take =0 at the center of the detector for fiducial
cuts and at the interaction point for event variables.
[10]
An isolated electron is one for which the calorimeter in a cone of
radius 0.4 in – around the electron cluster is less than
10% of the electron .
[11]
F. Abe et al., Phys. Rev. D 44, 29 (1991), our selection is
the same as in this reference except for (i) and
(ii) .
[12]
F. Abe et al., Phys. Rev. D 45, 1448 (1992).
[13]
F. Abe et al., Phys. Rev. Lett. 76, 3070 (1996).
[14]
F.A. Berends, W.T. Giele, H. Kuijf, and B. Tausk, Nucl. Phys. B357,
32 (1991).
[15]
H.L. Lai et al., Phys. Rev. D 51, 4763 (1995).
[16]
A.D. Martin, R.G. Roberts, W.J. Stirling, Phys. Rev. D 51,
4756 (1995).
[17]
G. Marchesini and B. Webber, Nucl. Phys. B310, 461 (1988).
[18]
F. Abe et al., Phys. Rev. Lett. 77, 448 (1996).
[19]
The curves are fits of analytic functions to the QCD Monte Carlo prediction
which accurately reproduce the spectra.