![]() RHEINISCH-
WESTFÄLISCHE-
TECHNISCHE-
HOCHSCHULE-
AACHEN
PITHA 97/33
August 1997
RHEINISCH-
WESTFÄLISCHE-
TECHNISCHE-
HOCHSCHULE-
AACHEN
PITHA 97/33
August 1997
Determinations of
using
JADE data of e+e- Annihilations
at to GeV
Pedro A. Movilla Fernández
III. Physikalisches Institut, Technische Hochschule Aachen
D-52056 Aachen, Germany
PHYSIKALISCHE INSTITUTE RWTH AACHEN Physikzentrum D-52056 AACHEN, GERMANY
Abstract
Talk presented at the QCD’97, Montpellier, France, July 3-9, 1997. Data recorded by the JADE experiment at the PETRA e+e- collider were used to measure distributions of new event shape observables. The distributions were compared with resummed QCD calulations (+NLLA), and the strong coupling constant was determined at 22, 35 and 44 GeV. The results are in agreement with previous combined results of PETRA but have smaller uncertainties. Together with corresponding data from LEP, the energy dependence of is significantly tested and is found to be in good agreement with the QCD expectation.
1 INTRODUCTION
Summaries of measurements of from various processes and at different energy scales demonstrate [1] that the energy dependence of is in good agreement with the prediction of Quantum Chromodynamics (QCD). High precision tests are provided by e+e- annihilation data which were collected between some GeV and nearly 200 GeV. Unfortunately, in the interesting intermediate energy region where runs very quickly, the “best” value of , 0.14 0.2 [1], is a combined result at 35 GeV based on measurements at PETRA that are affected by large theoretical uncertainties because only QCD predictions up to were available for event shape observables.
Significant progress has been made in perturbative QCD calculations since 1992. Observables have been proposed for which perturbative predictions are extended beyond the next-to-leading-order through the inclusion of leading and next-to-leading logarithms [8] which are summed to all orders of (NLLA). Further, the precise measurements of the hadronisation process have improved the modelling of hadronic final states with Monte Carlo programs.
It is desirable to apply these LEP-established developments consistently to lower energy data in order to improve quantitative studies of the running of over large ranges of the energy scale , using identical experimental techniques and theoretical calculations in order to minimise point-to-point systematic uncertainties. In the following, +NLLA determinations of using data from the JADE experiment at PETRA at , , and GeV are presented [2].
2 JADE DATA
The JADE detector [3] was one of the five experiments at the PETRA electron-positron accelerator. It has operated from 1979 until 1986 at centre-of-mass energies of to GeV. The main components of the detector were the central jet chamber to measure charged particle tracks and the lead glass calorimeter to measure electromagnetic showers.
Multihadronic events were selected by the standard JADE selection cuts [3] which reduce the background from and -pair events to less than and , respectively [4]. The final numbers of events which were retained for this analysis are listed in Table 1, together with the corresponding integrated luminosities.
| year | data | luminosity | |
|---|---|---|---|
| 1981 | 2.4 | ||
| 1984/85 | - | 80 | |
| 1986 | 40 |
The physical results of previous publications by JADE can be very well reproduced [2].
Monte Carlo detector simulation corresponding to the JADE data were retrieved for and GeV. They were generated using the JETSET QCD shower event generator version 6.3 [6]. In general, there is good agreement of the detector simulation with data for all event shape distributions studied here. The simulated data can thus be used to correct for detector effects in the measured data.
3 DETERMINATION OF
3.1 Event shapes and jetrates
From the data samples, the event shape distributions of thrust , the heavy jet mass , the total and wide jet broadening and and the differential 2-jet event rate using the Durham jet finder were determined(c.f. [2]). For the latter three observables, no experimental results have previously been presented at these energies.


3.2 Correction procedure
The event shape data were corrected for the limited acceptance and resolution of the detector and for initial state photon radiation effects by applying a bin-by-bin correction procedure. It turns out that there is an excellent agreement between the data and the model prediction at hadron level over the whole kinematic range of the observables even for those ones which were never tested at such low energies [2].
No detector simulation were available for the GeV data. Therefore only the differential 2-jet rate was considered because it is known to depend to a lesser extend on detector effects. The 35 GeV correction was applied to the 22 GeV data since the correction factors for this observable were found to show no significant energy dependence [2].
In a second step, the data distributions were corrected for hadronisation effects by applying bin-by-bin correction factors derived from the ratio of the JETSET generated distributions before and after hadronisation. The data distributions, thus corrected to the parton level, can be compared directly to analytic QCD calculations.
3.3 +NLLA predictions


The event shape observables used in the analysis are predicted in perturbative QCD by a combination of the [7] and the NLLA [8] calculations. The calculation yields an expression of the form
where is the cumulative cross-section of an event shape observable normalised to the lowest order Born cross-section . The NLLA calculations give an expression for in the form:
where . The functions and are given by the NLLA calculations. The coefficients and are known from the matrix elements.
The strong coupling was determined by fits to the event shape distributions corrected to the parton level. For the sake of direct comparison with other published results this analysis closely followed the procedures described in [5]. The so-called ln()-matching scheme was chosed to merge the () with the NLLA calculations. The renormalisation scale factor, , was set to for the main result.
The fit ranges are determined by the requirements of moderate hadronisation uncertainties within the fit ranges, good and reasonably stable fits under changes of the range.
3.4 Systematics
To study systematic uncertainties [2] details of the event selection and of the correction procedure were modified. The impact of the hadronisation model of the JETSET generator was studied by varying several significant model parameters. Mass effects are estimated conservatively by excluding the b-quark from the correction procedure. Uncertainties due to contributions of unknown higher order corrections are estimated by the changes of when varying the renormalisation scale factor in the range of 0.5 to 2.0. Any resulting deviation from the main result was considered as systematic error.
3.5 Results
As an example, the theoretical predictions for the observables , , and at and at and 35 GeV are presented in Figures 1 - 3 and superimposed on the corresponding measured distributions corrected to parton level. In general, resummed calculations (solid lines) give a good description of the observables over their entire range of values even at the low PETRA energies, while the calculations (dashed lines) which are shown for comparison fail in describing the 2-jet region.
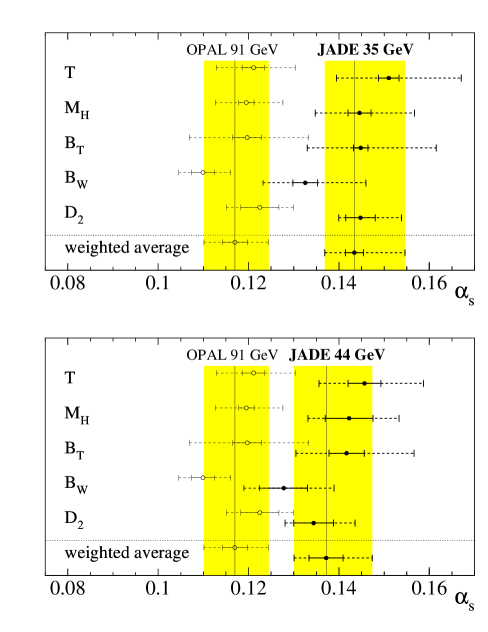
The values of and the errors obtained at and GeV are shown in Figure 4 in comparison with the values measured by OPAL at [5]. The values of exhibit a similar scattering pattern at all energies. This demonstrates the strong correlation of the systematic uncertainties at JADE and OPAL.
The individual results of the five observables at each energy were combined [2] into a single value. The final results for are
where the result at GeV is based on only. The main contributions to the systematic errors come from renormalisation scale uncertainties and mass effects which causes systematically higher values for .
4 SUMMARY AND CONCLUSIONS
JADE data at , and GeV were used to measure simultaneously with old (, ) and new (, , ) event shape observables. The corresponding +NLLA predictions are in good agreement with the measured distributions corrected to parton level even at PETRA energies.

It can be pointed out that the present measurements of are the most precise in this energy region of the e+e- continuum. The individual results are consistent with each other. The errors are dominated by effects of missing higher orders in the QCD calculations.
Evolving the measurements to the results obtained at , and GeV transform to a combined value of which is consistent with the direct measurement at by OPAL of [5], for the same subset of observables.
Similarities between the main detector components of JADE [3] and OPAL [9], as well as between this analysis and studies performed by OPAL [5, 10] at , , and GeV, allow for a precision test of the energy dependence of between - GeV. The values from OPAL and from this analysis are shown in Figure 5. The result of a fit of the QCD prediction to the data is shown by the solid line corresponding to and = 4.9/5 , taking into account only statistical and experimental uncertainties.
A fit for the hypothesis const. gives a which has a vanishing probability. The energy dependence of is therefore significantly demonstrated by the results from the combined JADE and OPAL data.
References
- [1] S. Bethke: these proceedings and Nucl. Phys. Proc. Suppl. 54A (1997), 314.
- [2] P.A. Movilla Fernández et al.: PITHA 97/27 (August 1997) and hep-ex/9708034, submitted to Z. Phys. C
- [3] W. Bartel et al.: Phys. Lett. 88B (1979) 171; Phys. Lett. 129B (1983) 145.
- [4] S. Bethke et al.: Phys. Lett. B213 (1988) 235.
- [5] P.D. Acton et al.: Z. Phys. C59 (1993) 1.
- [6] T. Sjöstrand, M. Bengtsson: Comput. Phys. Commun. 43 (1987) 367.
- [7] R.K. Ellis, D.A. Ross, A.E. Terrano: Nucl. Phys. B178 (1981) 421.
- [8] S. Catani, G. Turnock, B.R. Webber: Phys. Lett. B295 (1992) 269; S. Catani, L. Trentadue, G. Turnock and B.R. Webber: Nucl. Phys. B407 (1993) 3; G. Dissertori, M. Schmelling: Phys. Lett. B361 (1995) 167.
- [9] K. Ahmet et al.: Nucl. Inst. Meth. A305 (1991) 275.
- [10] K. Ackerstaff et al.: Z. Phys. C75 (1997) 193; G. Alexander et al.: Z. Phys. C72 (1996) 191.
QUESTIONS
D. Dissertori, CERN:
Why did you use only the ln()-matching scheme? Typically
a set of different matching schemes is used, and this
in the end could increase your systematic error.
P.A.M. Fernández:
In order to compare the present measurements consistently with the
results given by OPAL, I applied only the ln()-matching scheme
because it is commonly used in OPAL analyses. It has turned out that
this matching scheme gives the best description of
data [5], and that the results from other matching
schemes with comparable quality do not significantly differ from the
standard results.
L. Trentadue, Parma:
Is the quality of the data sufficiently good that the hadronisation
effects are small enough at low energies?
P.A.M Fernández:
Of course, the hadronisation effects and its uncertainties get larger
at lower energies, but they remain small enough to perform reasonable
measurements within the fit ranges chosen in this analysis, even at
GeV.
L. Trentadue, Parma:
It would be useful to consider the variable
‘energy-energy-correlation’ for which the analysis of PETRA data has
been done at NLLA level in the early eighties.
P.A.M Fernández:
I agree, but I focussed only on the standard set of observables which
OPAL uses for measurements at high energies, in order to
provide comparable results over a large range of the e+e-
continuum.