DESY 97-113
June 1997
High energy photoproduction
G. Abbiendi
Deutsches Elektronen-Synchrotron DESY,
Notkestrasse 85, 22607 Hamburg, Germany
The study of photoproduction reactions has gained a unique opportunity with the HERA data. The high center of mass energy allows to carry out quantitative tests of QCD, to explore the substructure of both the photon and the proton and to shed new light on soft and diffractive processes. In this report we review the HERA results, comparing them with the reach of fixed target photoproduction experiments and complementary measurements from and hadron colliders.
1 Introduction
High energy photoproduction processes occur with high cross sections at the HERA collider ( GeV), due to the large flux of quasi real photons from the electron beam. The obtained center of mass energies are up to ten times the values reached by fixed target experiments. The integrated luminosity achieved in the first years of HERA running has produced a great yield of physics output. With increasing luminosity the improvement of some of these measurements relies on a quite precise knowledge of the responses of the various detectors. The HERA results have also triggered a huge amount of theoretical activity.
The field covered by photoproduction at HERA has several connections with physics at and hadron colliders. The photon structure is probed in a complementary way with respect to the deep inelastic scattering at colliders. Moreover most of the photoproduction processes are seen to resemble hadron-hadron processes and can be described in a similar framework. It is non-trivial to say that we are testing our understanding of the high energy scattering with different beam particles and the universality of the underlying picture.
We review here the photoproduction results from HERA. In section 2 an introduction is given on the concept of the photon as a hadron, the measurements of its hadronic structure in the deep inelastic scattering, the definition of parton distributions for the photon and the most used sets of parametrizations. The basic characteristics of HERA, its kinematics and the experimental procedure to select photoproduction events are described in section 3 and a brief description of the ZEUS and H1 detectors is given in section 4. The physics topics are then grouped in the following way: soft physics is dealt with in section 5, where the measurement of the total cross section and its decomposition in the different diffractive and non diffractive processes are described and in section 6, where the elastic vector meson production is described; hard photoproduction is then the subject of section 7, where the emphasis is on both tests of the QCD dynamics and on the determination of the photon and the proton structure from measurements of inclusive particle, jets, open charm and inelastic production; section 8 is devoted to hard diffraction, where both photon dissociation with the appearance of jets or heavy flavours and colour singlet exchange are described. Section 9 concludes with some remarks about the future prospects.
2 Resolved photon and photon structure functions
In the Standard Model the photon is the gauge particle exchanged in electromagnetic interactions. It is elementary and its fundamental interactions occur with the charged leptons and quarks. On the other hand hadrons are composite objects, bound states of quarks and gluons, and have a size of the order of fm ( cm). Despite this classification the photon can also behave like a hadron. The dual nature of the photon was first observed in fixed target photoproduction experiments using real photon beams [1]. These experiments have covered center of mass energies from to about GeV. The hadronic behaviour of the photon has been interpreted in the Vector Dominance Model (VDM) [2]. It describes the photon-nucleon interaction as a two stage phenomenon: firstly the photon fluctuates into a vector meson state with the same quantum numbers (), then a normal hadronic interaction takes place between the nucleon and the vector meson. The total cross section is written as:
| (1) |
where is the photon-meson coupling, which can be measured from electromagnetic decay rates like . Photoproduction cross sections are suppressed by the QED coupling in comparison to purely hadronic ones, but the characteristics of the final state are found to be the same as e.g. interactions.
The bulk of hadronic interactions are soft processes involving low momentum transfers. However at high enough energies hard interactions can occur, their signature being the production of high particles or jets. In Leading Order of QCD (LO) the strong coupling constant has the expression:
| (2) |
with the number of active flavours. Whenever the characteristic energy scale of the interaction, like the of the produced jet, is much higher than the QCD scale ( GeV), is small enough to apply perturbation theory.
In hard interactions the photon can behave as a pointlike particle in the so-called direct photon processes or it can act as a source of partons, which then scatter against partons in the nucleon, in the resolved photon processes. Resolved interactions stem from the photon fluctuation to a state (or a more complex partonic state). Depending on the relative transverse momentum between and , this may be a bound state like in the VDM (hadronic component) or a perturbative calculable state (anomalous component). Both are embedded in the definition of the photon structure functions.
The apparent hadronic structure of the photon can be studied in deep inelastic scattering at colliders. This proceeds through the exchange of two photons, one highly virtual (probe) and the other almost real (target), as in Fig. 1. Experimentally one electron is detected at a large angle with respect to its initial direction, and its energy and polar angle are measured; the other electron is required to scatter at small angle, generally by an antitagging condition, and it is thus lost into the beam pipe (single tag). Without tagging the electron scattered at low angle, the energy and small virtuality of the target photon are undetermined. It is then necessary to measure the hadronic invariant mass . The following kinematic variables are defined, with reference to Fig. 1 ( is the four-momentum of the incoming electron):
| (3) | |||||
The reaction can be regarded as factorizing the flux of quasi-real photons, i.e. the lower vertex in Fig. 1. This is achieved in the Weiszäcker-Williams approximation [3] or better in the Equivalent Photon Approximation [4]. Naming the energy fraction carried by the quasi-real photon, the differential cross section versus , integrated over the photon virtuality between the limits and , is:
| (4) |
with the photon flux given by:
| (5) |
Here is the kinematic limit:
| (6) |
while corresponds to the maximum scattering angle for the electron not to be detected (typically mrad):
| (7) |
The level of accuracy of the Equivalent Photon Approximation goes from few per cent to about , depending on the range of integration.
The cross section for the deep inelastic scattering is written in complete analogy to the electron-nucleon DIS, introducing the two photon structure functions and :
| (8) |
In the usual experimental conditions is rather small and can be neglected. The cross section measurements thus correspond to determinations of the structure function.
The most striking feature of is that in the region of asymptotically high it is completely calculable by perturbative QCD (at large ). This has to be contrasted with the nucleon structure functions, for which QCD predicts for example the evolution but not the absolute normalization at any value.
The lowest order contribution to is given by the Quark-Parton Model diagram shown in Fig. 2 (plus its crossed one), which is purely electromagnetic. It gives [5]:
| (9) |
where the sum runs over all quark and antiquark flavours . The charge (in units of the proton charge) and mass are given by and . This expression depends on the quark masses and roughly describes experimental data using constituent masses of few hundred MeV. However it shows some important qualitative features. Comparing it to the known behaviour of the nucleon structure function two major differences appear:
-
•
There is no scale invariance holding for even in the Parton Model. For nucleons the scaling violations result from gluon radiation and have opposite signs in different ranges: with increasing increases at low while it decreases at high . Instead grows at all the values with increasing .
-
•
is large at high , while counting rules predict for the nucleon a vanishing for .
The different behaviour of photon and nucleon structure functions originates from the pointlike coupling of the photon to quark-antiquark pairs : this coupling is what endows the photon with a hadronic structure. Perturbative QCD can be applied on top of the Parton Model and resummations have been performed for both in leading [6] and next-to-leading (NLO) order [7] of QCD for large and asymptotically high . The result reads as:
| (10) |
with and calculable functions of but diverging for . The first term is the LO result, the second its NLO correction. The absolute normalization of would then be a direct measurement of , or equivalently of the QCD scale . This result accounts for only pointlike couplings and is valid at high where the incalculable hadronic component of the photon is not important. Unfortunately this regime is not experimentally reachable at present and foreseeable future accelerators. Non-perturbative contributions due to the formation of bound states after the splitting cannot be neglected.
The successful approach to , firstly suggested by Glück and Reya [8], requires the introduction of boundary conditions, which have to take inputs from experimental data at some arbitrary scale already in the domain of perturbative QCD. At the scale both perturbative and non-perturbative contributions are buried together. From the boundary conditions the evolution with is then described by perturbative QCD, most practically with generalized DGLAP equations [9]. At the starting scale parton densities are defined with a quark-antiquark component and a gluon component . The evolution equations for the photon parton densities differ from those of the nucleon due to the anomalous coupling . Its splitting function is given by the coefficient of the leading logarithmic term in (9):
| (11) |
The anomalous coupling introduces an inhomogeneity in the evolution equations,
which are written in the form:
| (12) |
Here , and are the quark (antiquark) and gluon density in the photon and the ordinary splitting functions. Equations (12) hold in this form at both LO [6, 10] and NLO [11, 12, 13], provided the right one or two loop splitting functions and coupling constant are used. Recently a full NLO calculation of the heavy quark contribution to the photon structure functions has been carried out [14].
A peculiar characteristic of the photon structure is that there is no momentum sum rule constraining the photon parton distributions. In contrast in the nucleon case the early DIS data showed that gluons should carry about half of the nucleon momentum, thus fixing the size of . The reason is that in the quantum decomposition of the real photon the hadronic states and thus the parton densities are of order , while the bare photon state is of zeroth order. Thus any variation, even large, in the parton densities can be reabsorbed in a renormalization of the bare photon wavefunction [15, 16].
Quark and antiquark distributions are however constrained by the measurements of , since in LO:
| (13) |
The first data on came from experiments at the colliders PETRA and PEP (for a review see [17]). Most of the available photon parton distributions have been parametrized from those data. Later results have come from the TOPAZ [18] and AMY [19] experiments at TRISTAN and from the OPAL [20, 21] and DELPHI [22] experiments at LEP. They are shown in Fig. 3 compared to LO parametrizations obtained from previous data. Most of the data points suffer from quite large errors. One of the limitations are the low statistics in comparison with similar measurements of the nucleon structure functions. The reason is that the two-photon exchange implies a cross-section of order instead of as for lepton-nucleon DIS. Another important contribution to the experimental errors is of a systematic nature. As we said, the measurement of requires that of . Due to the limited acceptance of the detectors, particularly around the beam pipe, one is not sensitive to the whole hadronic final state. To correct for detector effects a model of the hadronic final state is necessary and this is usually done with the help of Monte Carlo generators. Unfortunately the unfolding of the true from the measured one is strongly dependent on the different models, especially at low . The expected accuracy of the measurements which can be done at LEP2 in an enlarged kinematic domain is certainly very desirable [23]. The knowledge of the photon structure is of utmost importance at LEP2 for the research of new physics, given that the processes are an important source of background.
The logarithmic increase of with , predicted by (9), is clearly established from experimental data in Fig. 4, where is averaged in the large- region . This behaviour is a proof of the anomalous component of the photon. To account for the normalization a non-perturbative VDM component is also needed, like in the FKP model [24] shown by the curves in the figure.
Most of the current sets of parton distributions of the photon follow the approach of evolution equations. A deeper description can be found in [25]. The Drees and Grassie parametrization (DG) [26] was obtained by LO evolution equations starting from input parton distributions at 1 GeV2, to fit only one data point at that time available at 5.9 GeV2. Its input consists of three quark flavours with densities assumed proportional to the squared quark charges and flavour thresholds for charm and beauty crossed through the evolution. The input gluon is generated radiatively and does not enter in the fit.
A similar strategy was used in the parametrizations by Levy, Abramowicz and Charchula (LAC) [27], which were based on the world data set available in 1991. However they included in the fit the gluon distribution at the starting scale, demonstrating that data on do not constrain it significantly. This is connected with the lack of a momentum sum rule for the parton distributions in the photon. Among the LAC sets, LAC1 and LAC2 have a very soft gluon distribution, rising steeply at low , while LAC3 has a very hard distribution, with a maximum at . The LAC parametrizations are LO and use four massless quark flavours. LAC3 has already been excluded by data on jet production in and scattering.
The WHIT parametrizations [28] (after Watanabe, Hagiwara, Izubuchi and Tanaka) follow a similar approach as LAC, but treating correctly the charm threshold. This is more important than in the nucleon case, because the photon can easily develop a charm content through the anomalous splitting . Six sets have been provided, each one with a different assumption on the shape of the gluon distribution. The total momentum carried by gluons is however fixed at about half the momentum carried by quarks (at GeV2) in WHIT 1,2,3, while gluons and quarks carry about the same momentum fraction in WHIT 4,5,6.
The Gordon-Storrow parametrizations (GS) [29] exist at both LO and NLO. Their first version starts from a scale GeV2 with a VDM ansatz modified by the addition of a pointlike term:
| (14) |
Here the structure of the vector meson is assumed equal to the pion structure. The free parameters are the momentum fractions carried by gluons and sea quarks in the pion, the constant and the light quark masses from the QPM term. In the GS2 distribution comes entirely from the first term, while in GS1 the second term also contributes through radiation from the pointlike quark component. Recently these distributions have been updated [30] by lowering their starting scale to 3 GeV2, including all available data on and constraining the gluon from jet production data at TRISTAN.
The GRV parametrizations (after Glück, Reya and Vogt) [31] exist both in LO and NLO and are built at a very low starting scale: 0.25 GeV2 (LO), 0.3 GeV2 (NLO). Such a low value is considered the minimum for the applicability of perturbative QCD. The authors apply the idea of dynamically generated parton distributions, which they had previously used to describe the nucleon and pion structure [32]. The ansatz for the nucleon was originally to have only valence quarks at the initial scale. It was then modified introducing valence-like distributions of gluons and sea quarks. For the pion no sea quarks are needed at the starting scale but a valence-like gluon density, proportional to the valence quark density. The GRV approach has attained considerable success with HERA data on the proton structure function [33, 34], although it is not obvious that perturbative QCD implemented in DGLAP equations works already at 1 GeV2. The GRV parametrizations for the photon start from a VDM input:
| (15) |
where only a normalization factor () remains free, accounting for mixing. In this way the gluon distribution at the scale is constrained to be equal to that of the pion.
The AFG parametrization (after Aurenche, Fontannaz and Guillet) [35] is built in NLO and, like GRV, starts from a low scale 0.25 GeV2 assuming a VDM ansatz. However a coherent sum of is supposed. Pion distributions are taken from [36]. The authors choose the regularization scheme pointing out that the scheme adopted by GRV is more stable but includes process dependent terms in the parton distributions.
Schuler-Sjöstrand parametrizations [37] are quite recent and follow a similar approach as GRV and AFG. They exist only in LO. Different sets are provided, including parton distributions for the virtual photon.
Summarizing, the VDM ansatz allows one to constrain the gluon distribution in the photon, otherwise free due to the lack of a momentum sum rule. Unfortunately with typical starting scales 1 GeV2 a pure VDM input is not able to reproduce data at higher . The various parametrizations solve the problem by adopting one of these two approaches:
-
•
starting from a very low scale with a pure VDM input, in a region where perturbative QCD may be doubted;
-
•
keeping the scale at 1 GeV2 and using a more complex input with the addition of a pointlike component given by the Quark-Parton Model or simply guessed.
A comparison between the quark distributions from different sets is shown in Fig. 5. There is reasonable agreement between them in the region , where data exist. Instead large differences appear at high , for example comparing GS and GRV. The striking difference between the quark distribution in LO and NLO is characteristic of the scheme, and this has been discussed in [15]. It does not affect the final predictions on observable quantities like . It can however be avoided using the scheme which is adopted by the GRV parametrizations [13].
Large differences between the parametrizations also occur at low . This is clearly visible in Fig. 6, where different LO gluon distributions are compared. The LAC sets are much steeper at low than the others, demonstrating that the DIS data do not constrain the gluonic component of the photon. At NLO the similarity of the curves is due to the similarity of the models, it is not borne out by data.
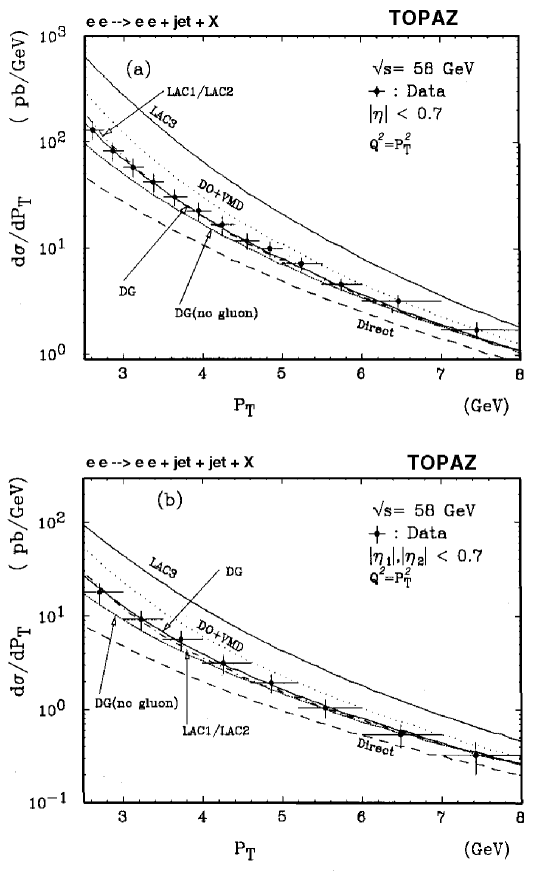
The first experimental constraints on the gluon density in the photon have come from experiments at TRISTAN ( GeV) from the study of interactions, with both photons almost real. Here jet production occurs in LO through the Quark-Parton Model process as in Fig. 7/a, or through single- or double-resolved processes as in Fig. 7/b-c. The three kinds of processes are all of the same order in the coupling constants since the photon parton distributions are O. The first experimental evidence for a non zero gluon content came from AMY [38]. Single jet and dijet inclusive cross sections have then been measured by both TOPAZ [39] and AMY [40]. The results of TOPAZ compared to theoretical predictions are shown in Fig. 8. The need for the hadronic component of the photon is evident when comparing data to the expected cross section for direct photon only. Moreover it is clear that there is a need for a gluon component in the photon. These data also rule out the LAC3 parametrization which would predict a far too high cross section.
3 HERA as a collider
The HERA storage ring at DESY (Hamburg, Germany) is the first electron-proton collider ever built. Two different magnetic systems, respectively superconducting for protons and conventional for electrons, drive the beams in separate rings along a circumference of 6.3 Km. The design energies are GeV, GeV, giving a center of mass energy GeV (currently GeV, so that GeV). This corresponds to an electron beam energy of 52 TeV against a fixed target. The beams cross each other at zero angle in two interaction regions, occupied by the experiments H1 and ZEUS. The bunch crossing occurs every 96 ns. The designed number of bunches in each beam is 210. To check beam related backgrounds about 10 bunches are left unpaired in each beam.
The HERA kinematics is represented in Fig. 9. The invariant kinematic variables of the semi-inclusive reaction are:
| (16) | |||||
| (17) | |||||
| (18) | |||||
| (19) |
Two of them can be chosen as independent variables. is the virtuality of the exchanged photon. The photoproduction regime is defined by low , such that the photon is almost real. In this case we may regard HERA as a photon-proton collider, where the photons are emitted almost collinearly with the electron beam. The photon spectrum can be again evaluated with the Equivalent Photon Approximation, factorizing the vertex in the flux factor of formula (5) with the kinematic limits given by (6) and (7), in which the variable is substituted by . Due to the asymmetric energies of the HERA beams the center of mass is boosted typically by two units of pseudorapidity , defined as:
| (20) |
This means that a particle going at in the center of mass appears at about 15o in the HERA laboratory frame. In the following sections we will refer to forward or backward (rear) directions intending respectively the proton and the photon directions.
The photoproduction regime is experimentally defined in two ways:
-
•
tagged photoproduction, when the scattered electron is detected at a very small angle. This can be done in both ZEUS and H1 by dedicated calorimeters placed near the beam line at several meters from the interaction point. The acceptance extends in this case from GeV2 to 0.02 GeV2;
-
•
untagged photoproduction, defined by the antitagging condition that the scattered electron is not detected in the main calorimeter. This definition has been used by both the experiments. It corresponds to 4 GeV2, with median about 10-4 GeV2.
In contrast the region of 4 GeV2 is the traditional Deep Inelastic Scattering (DIS) region, where the process in Fig. 9 is understood as a pointlike interaction between the electron and a quark constituent of the proton. In this regime the structure of the proton can be studied by exploiting the almost pointlike nature of the exchanged virtual photon. This region is experimentally defined by tagging the scattered electron in the main calorimeter. The variable represents in this context the momentum fraction of the struck quark relative to its parent proton.
The meaning of is that of scaled photon energy: in the proton rest frame and is the photon-proton center of mass energy or equivalently the invariant mass of the hadronic final state. In the photoproduction regime these are related by . In comparison with previous photoproduction experiments, carried out with fixed targets, HERA enlarges by one order of magnitude the range of center of mass energies. Depending on the specific process the HERA experiments can span the whole range of between GeV and GeV running at the nominal beam energies. Lower values of could be accessed by reducing the energy of the proton beam.
In the tagged mode (and hence ) is easily determined by measuring the energy of the scattered electron in the low-angle electron tagger by:
| (21) |
In the untagged mode can be determined from the measurement of the hadronic final state by the Jacquet-Blondel variable [41], defined as:
| (22) |
where the sum runs over all the calorimeter cells, being the energy contained in the i-th cell at polar angle with respect to the proton direction. gives a systematically lower value than the true , mostly due to particles escaping detection inside the beam pipe in the photon direction or inactive material in front of the calorimeter, and is corrected by Monte Carlo detector simulation.
The final states produced in photoproduction events can be very diverse, from hadron-like minimum bias interactions to (quasi)elastic vector meson production, to the production of large jets and heavy flavours. Detection of all those processes demands multipurpose detectors such as ZEUS and H1 with many capabilities and good overall performances.
4 The experiments ZEUS and H1
Both ZEUS and H1 have multipurpose detectors. Here only a brief description is given, more details can be found in [42, 43].
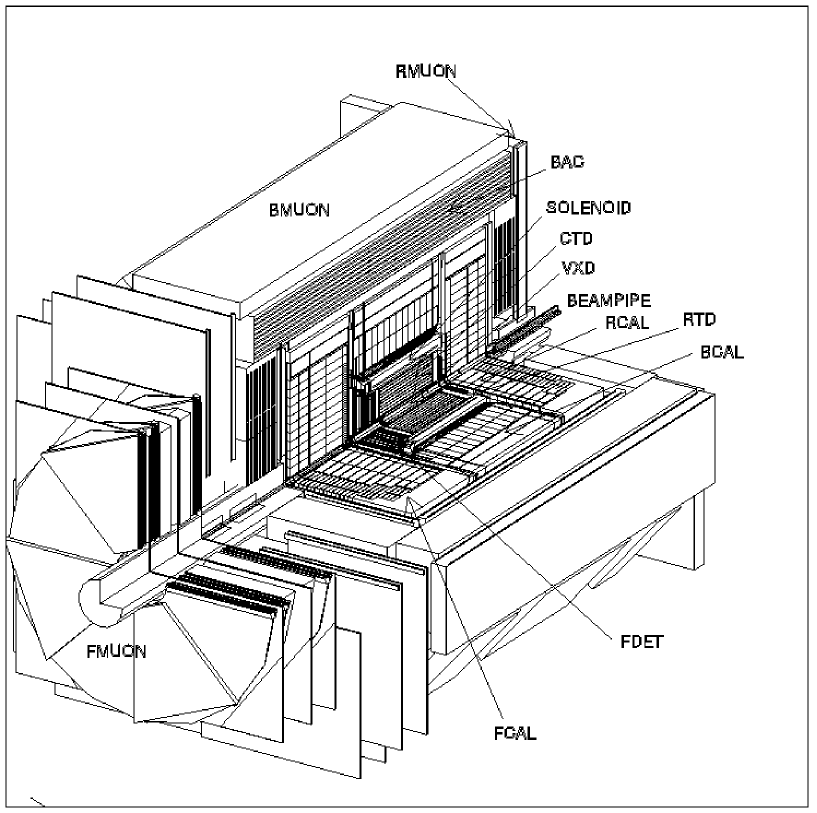
A longitudinal section of the central part of the ZEUS detector is shown in Fig. 10. Charged particles are measured by the inner tracking detectors: the vertex detector (VXD), the central tracking detector (CTD) and forward and rear tracking detectors (FDET, RTD). They operate in a magnetic field of T produced by a thin superconducting solenoid. The VXD and the CTD are concentric cylindrical drift chambers covering the angular region (where is the polar angle with respect to the proton direction). The measured resolution for tracks going through all the CTD layers is: (GeV).
Surrounding the coil is the high resolution uranium-scintillator calorimeter (CAL), mechanically divided into three parts, the forward (FCAL), barrel (BCAL) and rear (RCAL) calorimeter. The calorimeter is compensating, the thickness of the uranium and scintillator tiles were optimized to achieve the best possible energy resolution for hadrons. It covers the angular region: , corresponding to of the solid angle, with holes of cm2 in the center of the forward and rear calorimeters to accomodate the HERA beam pipe. Each part of the calorimeter is subdivided into towers of transverse size cm2 which are segmented longitudinally into one electromagnetic (EMC) and one or two hadronic (HAC) sections. In the electromagnetic section the readout cells have finer granularity of cm2 (in FCAL and BCAL) or cm2 (in RCAL). Each cell is read out by two photomultipliers. Under test beam conditions the energy resolution is for electrons and for hadrons, with in GeV. The time resolution is better than ns for energy deposits greater than GeV.
Outside the uranium calorimeter a moderate resolution calorimeter (BAC), made of iron layers interleaved with proportional tubes, measures the tails of high energy jets and acts as a filter for muons. The muon detectors are also divided into three sections, covering the forward, the barrel and the rear regions. In the barrel and rear regions large chambers made of limited streamer tubes measure the position and the direction of muons in front and behind the iron yoke (BMUON, RMUON). The yoke is magnetized to T to allow the momentum measurement for penetrating muons. In the forward direction a spectrometer (FMUON), made of two iron toroids, drift chambers and planes of limited streamer tubes, identifies muons and measures their momenta.
Charged particles scattered at very small forward angles and carrying a substantial fraction of the proton beam momentum are detected in the leading proton spectrometer (LPS). This is a set of six stations placed along the beam line at distances from to meters from the interaction point, using planes of silicon microstrip detectors very close to the proton beam. The track deflection induced by the magnets in the proton beam line is used to measure the momentum. The LPS measures a leading proton for fractional momentum and GeV.
The luminosity is measured from the rate of the Bethe-Heitler process , whose cross section is large and calculable to high precision. Two lead-scintillator calorimeters placed downstream the electron beam pipe detect respectively the outgoing electron and the photon. The electron calorimeter lies at m from the interaction point and accepts electrons with energy between and GeV scattered at angles up to about mrad. The photon calorimeter is placed at m from the interaction point and accepts photons produced at angles below mrad. Bremsstrahlung events are tagged by the coincidence of the two calorimeters where the energies add up to the energy of the electron beam. The luminosity is calculated from the photon tagger alone.
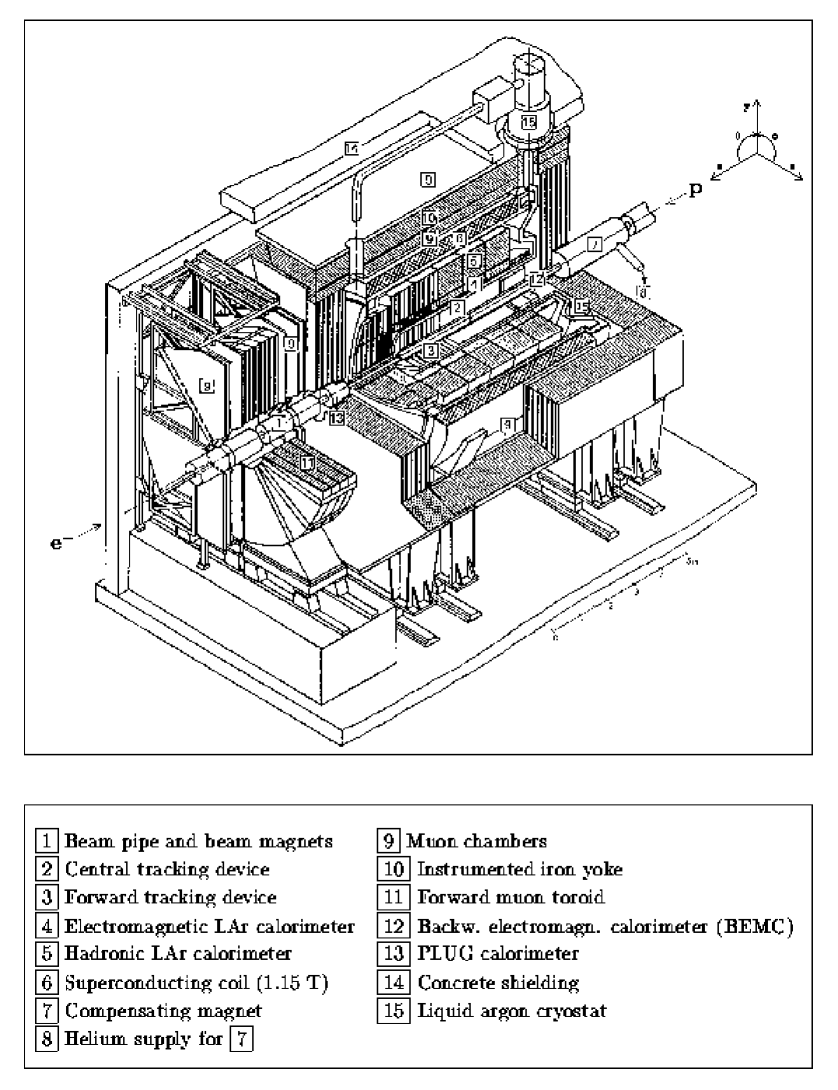
Figure 11 shows a schematic view of the H1 detector. Charged particles are tracked by the central and forward tracking systems, both consisting of drift and multiwire proportional chambers. The momentum resolution achieved is (GeV) and the angular coverage is the same as for the ZEUS detector.
The tracking region is surrounded by a fine grained liquid argon calorimeter (LAr) with an electromagnetic section made of lead absorber plates and an outer hadronic section with steel absorber plates. Its angular coverage is . The energy resolution under test beam conditions is for electrons and for hadrons, with in GeV. The calorimeter is not compensating and offline corrections are applied according to the shower shape and energy. Its segmentation varies as a function of the polar angle and is finer in the proton direction where, due to the asymmetry of the HERA beam energies, the particle density is higher. In this region the transverse cell size is as small as cm2. The backward region is covered by another calorimeter, which was primarily intended for the detection of the scattered electron in deep inelastic scattering. This consisted of a lead-scintillator sandwich with depth of and energy resolution . From the 1995 data taking it has been replaced by a scintillating fiber calorimeter with photomultiplier readout.
The calorimeters are contained inside a superconducting solenoid providing a uniform magnetic field of T for the inner tracking detectors. Outside the coil there is the iron yoke, which is instrumented with LST planes for the muon identification. Further muon chambers in front and behind the iron complete the muon detectors in the central region, while in the forward region muons are measured in a toroidal spectrometer similar to the one in ZEUS. The luminosity is measured in a similar way as in ZEUS, from the coincidence rate of two TlCl/TlBr crystal calorimeters.
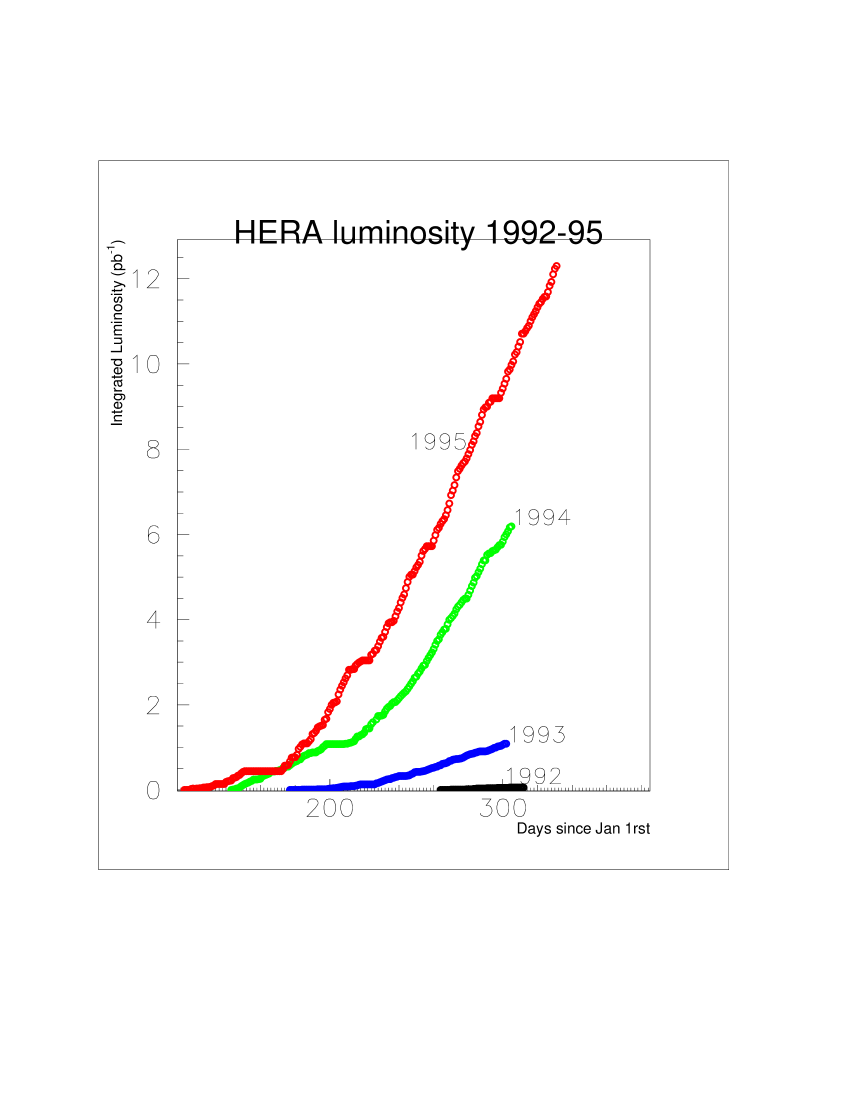
HERA operation began in summer 1992 with electron beam energy of GeV. Since 1994 positrons are run at energy of GeV. The luminosity has continuously increased from year to year. In Fig. 12 the integrated luminosity delivered by HERA is shown as a function of time for the period 1992-1995. We review here the final results available at present, which have been obtained analyzing data taken up to the 1994 run.
5 Total p cross section and its decomposition.
The high energy behaviour of total hadronic cross sections is related to fundamental properties of particle interactions. colliders have provided data up to a center of mass energy 1.8 TeV, demonstrating the logarithmic rise of the cross section [44, 45, 46]. Asymptotically this rise cannot violate the Froissart-Martin bound [47, 48], which states that total cross sections cannot grow faster than , as a consequence of unitarity. At HERA the cross section has been measured up to a center of mass energy of GeV, an order of magnitude higher than previous photoproduction measurements from fixed target experiments [49].
The most popular approach to hadronic cross sections employs Regge theory ideas [50]. In this framework the simplest description is due to Donnachie and Landshoff [51]. They have been able to fit all the available cross section data (for GeV) using a parametrization inspired by Regge theory, of the form:
| (23) |
The first term arises from pomeron exchange and the second from reggeon exchange (, , , ). The exponents and are effective powers, summing effects of multiple pomeron or reggeon exchanges. Such effects are supposed to be small, therefore and are related to the intercepts of the pomeron and reggeon trajectories:
| (24) |
| (25) |
that is:
| (26) |
| (27) |
The pomeron has the quantum numbers of the vacuum, so that its coupling to a particle and its antiparticle are equal. Thus the coefficient X is set equal for and . This is a way of enforcing the Pomeranchuk theorem [52] in the fit. The universal rise of the cross sections with energy is interpreted by Donnachie and Landshoff as sign of the universality of something that is exchanged, the pomeron, which is sometimes also referred to as the “soft” pomeron. This simple parametrization becomes inconsistent at very high energies, violating the Froissart-Martin bound. However this takes place only at GeV, very far from the presently conceivable energies.
On the other hand several models have been based on perturbative QCD, attributing the rise of the cross section to the onset of “minijets” [53, 25]. In this context the total inelastic p cross section is assumed to have a energy independent part, coming from soft non-perturbative interactions, and a QCD part rising with energy, due to the increase of gluons in the proton and in the photon at low partonic energy fractions. Predictions based on this approach depend on the parton distributions of the proton and the photon, the minimum transverse momentum down to which the perturbative calculation is assumed to be valid (), and the probability for a photon to go into a hadronic state. These models use the eikonal formalism to ensure unitarity [54] and in general have a large number of unknown parameters.
The total cross section is the sum of quite different processes, represented in Fig. 13. Let us first divide diffractive (13/a-d) from non-diffractive processes (13/e). In diffractive processes there is no colour exchange between the proton and the hadronic state of the photon. In the figure they are represented to proceed through pomeron exchange. Assuming the validity of the VDM [2] for the transition (, , ) the following four classes are identified:
-
•
elastic vector meson production (Fig. 13/a). The truly elastic Compton scattering has a cross section about two orders of magnitude smaller and can be neglected.
-
•
photon diffractive dissociation (Fig. 13/b). In this case the photon gives rise to a low mass hadronic system X with the same quantum numbers, while the proton stays almost untouched and is the leading particle in the final state.
-
•
proton diffractive dissociation (Fig. 13/c). The photon converts to a vector meson and the proton breaks up into a low mass hadronic system Y.
-
•
double diffractive dissociation (Fig. 13/d). Here both the photon and the proton dissociate to low mass hadronic systems.
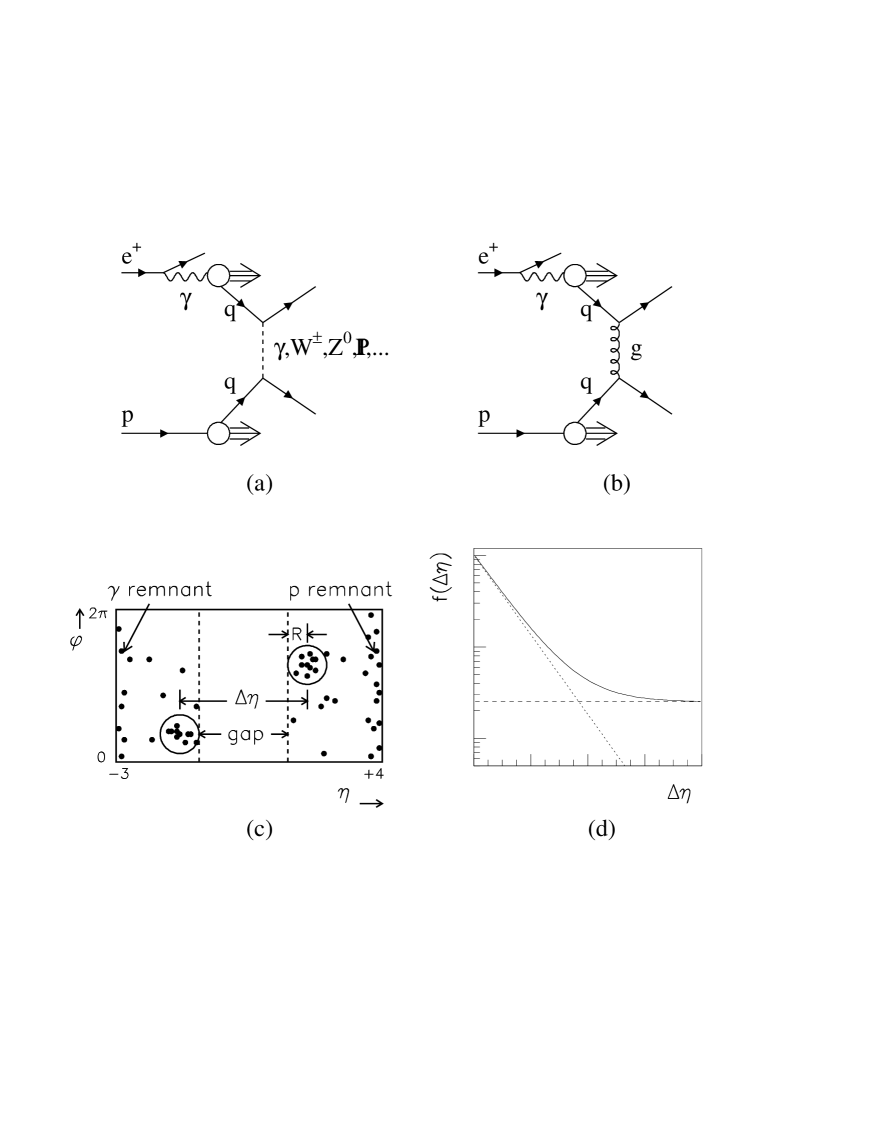
In all cases the transverse momentum exchanged is generally low and the topology of the final state is characterized by large rapidity intervals (or gaps) without particles. This is expected if there is no colour flow between the interacting particles and is exploited as an experimental signature.
Non-diffractive processes (Fig. 13/e) are mostly soft ones, similarly to minimum bias events at hadron colliders. In this case colour exchange occurs and thus final state particles are distributed throughout the available phase space without significant gaps.
It should be clear that the different processes listed above are qualitatively quite different from one another. Experimentally, to trigger and select inclusive photoproduction events at HERA one needs a coincidence between tagging of the scattered electron in the low-angle electron taggers and activity in the main apparatus, at least a charged track or a minimum energy deposition. The detection efficiency for each of the photoproduction processes is quite different, thus complicating the measurement of the total cross section. Introducing the partial cross sections (i=1,5) for the five considered classes of reactions, with , the observed number of events is given by:
| (28) |
with the integrated luminosity, the photon flux, the efficiency to tag the low angle electron and the efficiency of the main detector for the i-th process. The photon flux is obtained by integrating expression (5) in the kinematic region corresponding to the low-angle electron tagger. The are calculated by Monte Carlo simulations of each different process. To reduce the systematic error it is important to determine separately each of the , otherwise one would have to rely on model dependent assumptions in the Monte Carlo, such as the relative magnitude of each contribution and its characteristics.
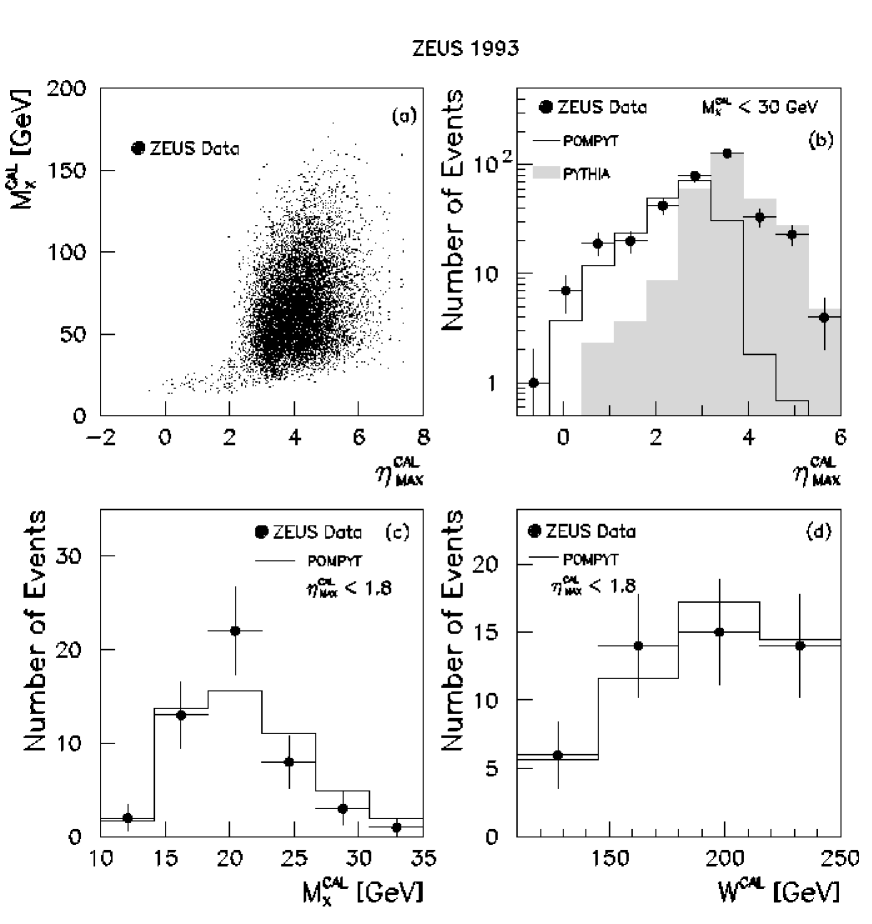
The H1 experiment has measured the total p cross section [55] by short dedicated runs with special triggers in 1994. They took data with nominal vertex position and the same amount of data with vertex displaced by about 70 cm towards the forward part of the detector. In fact the acceptance for all the diffractive processes increases if the position of the interaction vertex is shifted in this way. The modest integrated luminosity is already enough due to the large photoproduction cross sections. The partial cross sections for the diffractive reactions are determined from fits to selected distributions, related to the rapidity gaps in the pattern of the final state particles. This is done on the shifted vertex data. The double dissociation cross section () is assumed to be in the reasonable range b. The non-diffractive cross section is then determined from nominal vertex data, giving as input in (28) the diffractive partial cross sections previously determined. The measured cross sections are summarized in table 1. The elastic cross section is almost independent of the assumed value of . Instead the single photon dissociation () and the single proton dissociation () cross sections depend markedly on , but for any chosen value of the photon dissociation cross section is found to be larger than the proton dissociation one. The dominant systematic error () in the result is on the acceptance of the electron tagger. This depends strongly on the electron beam optics, particularly on the offset and the tilt of the beam in the horizontal plane.
The total cross section as measured by H1 at an average c.m.s. energy GeV is shown in Fig. 14, together with previous data at lower energies [49] and a measurement from ZEUS [56]. The curves are predictions of Donnachie-Landshoff (DL) [51] and Abramowicz-Levin-Levy-Maor (ALLM) [57] parametrizations, both of which did not include HERA data. The ALLM is based on both p and p data at fixed target experiments. It allows a unified representation of photon-proton interactions with from up to the DIS regime. A DL fit taking into account the CDF measurement [46] gives the exponent 0.11 in (23). The HERA data are well accomodated in the soft pomeron phenomenology expressed by these parametrizations, thus supporting the VDM and the universality of the rise in the cross sections at high energy.
Minijet models give predictions spread over a larger range due to uncertainties in the different parameters involved [58]. The present HERA results can be brought into accordance with calculations having a not too small ( GeV) and a moderately rising gluon density in the photon, but strong conclusions cannot be drawn.
In table 2 the diffractive partial cross sections measured by H1 are compared to predictions of several theoretical models, based on different assumptions about the structure and dissociation of the photon and the proton. CKMT [59] is a calculation using Regge theory plus absorptive corrections for all the different processes. The measured cross sections are derived fixing b, in agreement with the models. The elastic cross section is correctly predicted by all the models. The photon dissociation cross section is measured to be three times larger than the proton dissociation one, in agreement with predictions of CKMT. Instead SaS [60] and GLM [61] predict .
6 Elastic vector meson production
The elastic reaction (V = , , , , …) represented in Fig. 13/a is equivalent to a hadronic elastic interaction , assuming the validity of the VDM. The optical theorem relates the total cross section to the imaginary part of the forward elastic scattering amplitude:
| (29) |
where is the square of the momentum transfer. Soft pomeron phenomenology thus gives straightforward predictions on the elastic cross sections [62]. The elastic cross section is predicted to rise slowly with the c.m.s. energy and to be dominated by forward scattering, with a sharp peak at of roughly exponential behaviour:
| (30) |
The -slope is related to the radius of the hadronic interaction and it can be understood in the context of a simple geometrical model. In a fixed target configuration, for small angle of scattering , where is the incident beam momentum and:
| (31) |
In the classical optical diffraction of light from a circular aperture of radius R the intensity of light is given by:
| (32) |
where is the wave number of the light. Comparing these two expressions one has a relation between the slope parameter and the radius of the interaction:
| (33) |
For a typical radius of the strong interaction (with the pion mass) the last expression gives GeV-2. This is in the measured range of values for elastic scattering of hadrons at high energy. The spectrum is predicted to exhibit a dip followed by a secondary diffraction maximum, as for light diffraction. This is in fact observed in high energy and elastic scattering [63]. Regge theory predicts a weak dependence of the -slope on the center of mass energy, referred to as shrinkage, of the kind:
| (34) |
This effect actually allows the determination of the slope of the pomeron trajectory in (24): GeV-2.
Fixed target experiments have studied the elastic vector meson photoproduction up to GeV. Light (, , ) vector meson data [1, 64] have been found consistent with soft pomeron phenomenology and the VDM. Elastic production [65] cross sections were overestimated by VDM by more than an order of magnitude, but other predictions like the energy dependence agreed with data within the errors.
HERA experiments have measured the elastic reaction for V = [66, 67, 68], [69], [70], [71, 72, 73, 74]. These measurements are complemented by similar ones carried out in the DIS regime [75, 76]. The reconstruction of the vector meson decays:
has allowed the measurements at W from 40 to 100 GeV for light mesons, from 30 to 150 GeV for . One of the hardest experimental tasks is to trigger on such elastic events. In fact both the outgoing electron and the proton are generally not tagged. Then only the decay products of the meson decay can be observed in the detector. The typical topology of these events is of two charged tracks in the photon hemisphere (plus an electromagnetic calorimeter cluster due to the in decays). The acceptance in W is determined by the detector geometry and trigger.
In tagged photoproduction events the production has also been measured without reconstruction of the decay at GeV, from fits to distributions of the hadronic final state by comparison to Monte Carlo distributions for production [56, 67]. At these high W values the decay pions are boosted in the photon direction outside the acceptance of the tracking detectors and their reconstruction is carried out by the calorimeter. In this case the worse spatial and energy resolutions have prevented measurements of differential distributions.
The kinematic variables and can be easily determined from the vector meson, reconstructed from its decay products, in the limit of . In fact in this case and:
| (35) |
| (36) |
where the subscript indicates the vector meson. The main background to the elastic reactions comes from events where the proton dissociates (fig. 13/c). This can be reduced by requiring a very low energy deposit in the forward part of the calorimeter ( GeV). The residual background is estimated studying the effect of changing this cut in comparison to Monte Carlo simulations of the relevant diffractive process. In the final samples it is generally and is statistically subtracted.
Proton dissociation can be completely avoided by detecting the leading proton scattered at a very small angle. This has been done by ZEUS using the leading proton spectrometer (LPS), which directly measures the momentum of the leading proton with high accuracy (with the configuration the detector had in 1994 run: on the longitudinal component, MeV on ). For truly elastic events the momentum of the proton is reduced by less than and thus events are selected with , where is the ratio between outgoing and incoming proton momentum ( can be measured greater than unity due to the experimental resolution). One is thus guaranteed that the proton scatters elastically and is directly measured. Owing to the energy-momentum balance the can also be determined in this case. In fact in the elastic reaction the knowledge of the of the vector meson and of the scattered proton allows a determination of the of the untagged scattered electron, and from this the :
| (37) |
where . The measured for elastic production is shown in Fig. 15. A fit of the form (30) gives (stat.) (syst.) GeV-2, with dominant systematic uncertainties on the LPS acceptance and the beam spread in the transverse momentum.
HERA measurements of the slope for elastic photoproduction are shown in Fig. 16 in comparison with fixed target results. They agree with a slow shrinkage of the diffractive peak as predicted by the soft pomeron formula (34). This is also true for the measurements of the other light vector mesons, summarized in table 3. Recalling that is related to the radius of the interaction, the values in table 3 indicate a smaller radius for as compared to interaction.
The integrated elastic cross sections for , , , photoproduction measured at HERA as functions of are shown in Fig. 17 together with data from fixed target experiments. In the soft pomeron model [62] one expects:
| (38) |
where is given by (26) and is given by (34) with . This is in good agreement with data on light vector mesons. The same model predicts for the total photoproduction cross section a dependence , which also agrees with data, as shown.
Another characteristic of the elastic vector meson production at fixed target energies is the so-called s-channel helicity conservation (SCHC). For real or quasi-real photons it means that the transverse polarization of the photon is transferred to the vector meson. The polarization of the vector meson can be experimentally determined from the angular distributions of the decay products, which depend on the spin-density matrix elements [77]. The analyses reveal in all cases that SCHC continues to hold at the HERA energies.
This homogeneous situation changes dramatically when one turns to the elastic production of . Coming back to Fig. 17, the elastic cross section is steeply rising with and the Donnachie-Landshoff model fails, predicting a slow rise as for the light vector mesons. In Fig. 18/a only the ZEUS data are shown. The fit with a function gives . Thus even in this restricted range the soft pomeron model is excluded by data. Instead other two pomeron models are found to give a good description of the total cross section [78, 79] (Fig. 18/b). They involve either a scale dependent pomeron intercept or scale dependent pomeron couplings and mass threshold effects. The data can also be reproduced by models based on perturbative QCD [80, 81, 82], where the pomeron is considered as a system of two interacting gluons, or gluon ladder, as in Fig. 19. In these models the cross section is proportional to the square of the gluon density in the proton. For a singular gluon density at small , rising like:
| (39) |
as implied by HERA measurements [33, 34],
a steep rise is predicted with increasing .
HERA data are well described by the MRS(A’) parametrization [83],
which corresponds to a power in (39),
and by the GRV parametrization [84] corresponding to
.
In the Ryskin model [80]
the effective energy scale and momentum fraction at which
the gluon distribution is tested are given by:
| (40) |
| (41) |
For , the only hard scale is represented by the mass and the applicability of perturbative QCD relies on it. From (40,41) one has: GeV2 and . Due to the quadratic dependence on the gluon density the shape of the cross section as a function of is very sensitive to different proton parton density parametrizations. However the normalization of the theoretical result suffers presently from quite large uncertainties. In Fig. 18/b the elastic data are compared to the prediction of the Ryskin model with input gluon density given by MRS(A’). A good agreement is found, while the steeper behaviour of GRV has been reported to overshoot HERA data [73].
H1 has determined the slope of the distribution by fitting data with 1 GeV2 to an exponential in the range GeV, achieving GeV-2. The error in the slope due to using instead of is evaluated from Monte Carlo to be . No clear evidence for shrinkage is obtained dividing the sample in W bins, mainly due to the still limited statistics. A consistent result comes from the ZEUS analysis, which also corrects explicitly the differential cross section to obtain , shown in Fig. 20. Fitting over the range GeV2 with an exponential shape gives GeV-2, which is consistent with the slope values from fixed target experiments [65].
H1 also measured the cross section for production with proton dissociation, exploiting their forward detectors. This turns out to be of the same order of the elastic cross section, in a similar range of . The distribution gives a slope: GeV-2, a factor of smaller than for pure elastic scattering.
The study of the decay angular distributions of the (both elastic and with proton dissociation) shows consistency with s-channel helicity conservation, i.e. the , like lighter mesons, is mainly transversely polarized.
Diffractive production of has been observed by H1 [73] in the decay chain , . The rate of its production compared to is found to be , in agreement with previous measurements at fixed target experiments.
Elastic vector meson production has also been measured at high for , and [75, 76]. Preliminary results exist for low and high- photoproduction with proton dissociation [85]. These data, compared to fixed target data, suggested a hard production mechanism when a high energy scale is present in the interaction, be it a high mass (as the mass) or high or . However recent results from the E665 Collaboration [86] appear at variance with the previous fixed target data. The experimental situation for light vector mesons is still to be clarified. Thus vector meson production at HERA allows to study the transition from a non-perturbative description of the pomeron (the soft pomeron), to the hard perturbative pomeron.
7 Hard photoproduction and QCD
Hard photoproduction processes at HERA are of particular interest. The large cross sections and the range of high center of mass energies allow precise studies of the photon structure in a way complementary to the deep inelastic scattering. Moreover the QCD dynamics and the peculiar features of photon induced reactions can be tested. The hard scale is provided by the highest transverse momentum of the produced particles or jets in the final state. Application of perturbative QCD requires that this scale is at minimum a few GeV. As mentioned earlier, in leading order of QCD two classes of processes contribute to the production of high particles or jets. The photon may interact directly with a parton in the proton, as in Fig. 21/a, or it may first fluctuate into a hadronic state as in Fig. 21/b and then act as source of partons, which scatter off partons in the proton. In the first case, known as direct photon, the whole photon momentum enters in the hard subprocess and the final state consists of two jets balancing each other in plus the proton remnant and the scattered electron, emerging with small . In the second case, known as resolved photon, only a fraction of the photon momentum participates in the hard process and the final state has in addition a photon remnant, keeping approximately the original photon direction. The two diagrams represented in Fig. 21 are of the same order in the coupling constants, . In fact the resolved diagram involves the photon parton densities which are of order , as we discussed in section 2, bringing the power counting to the same result.
The kinematics of final state particles or jets are generally specified by their transverse momentum with respect to the beam axis (or equivalently the transverse energy ) and by the pseudorapidity . The definition of a jet requires a jet algorithm at both the experimental and the theoretical level. We will describe in some detail the relevant definitions. At the Born level the knowledge of (), and for the two final state partons, identified with the final jets, allows one to obtain the energy fractions and of the initial partons from the photon and the proton respectively. Let us write the four-momentum balance in the hard subprocess:
| (42) |
where , , , are respectively the four-momenta of the incoming electron and proton and of the two final partons. From this one obtains:
| (43) |
| (44) |
This holds only at LO. At this level direct photon events have and resolved ones .
The distinction between direct and resolved photon diagrams becomes theoretically ambiguous in NLO of QCD. Both components are related to each other through the factorization scale at the photon leg. The dependence of the NLO direct cross section cancels against the dependence in the resolved cross section via the photon structure function. In a consistent NLO calculation both the components have to be summed using the same scale. In general one defines observables and which are determined from the two highest jets in the event:
| (45) |
| (46) |
Direct and resolved photon events can be experimentally defined by a cut on when two or more jets are measured in the final state [87, 88].
The cross section for n-jet production is expressed formally as a convolution of the partonic cross section with the photon and proton parton densities:
| (47) | |||
where and are the parton types from and , and , the factorization scales for the photon and proton parton densities. For a direct photon and formally .
For the production of a particle the inclusive cross section is expressed by introducing the fragmentation function , which gives the probability to obtain from a final state parton , with momentum fraction . It can be written:
| (48) | |||
where is the factorization scale of the fragmentation function, which is usually set to the of the produced particle. The fragmentation functions need to be parametrized from experimental results [89].
The validity of equations (47) and (48) rests on the QCD factorization theorems (for a review see [90]), which state that universal parton distribution functions can be defined for a given hadron independently from the process. Thus comparing QCD calculations with experimental data may serve to constrain the parton distributions or, when the latter have negligible uncertainties, to test the parton dynamics.
7.1 Inclusive charged particle distributions
Inclusive distributions of charged particles in photoproduction have been measured by both H1 [91] and ZEUS [92]. In Fig. 22 the transverse momentum distributions are shown averaged over the pseudorapidity interval (corresponding to the region in the center of mass frame, in the photon hemisphere) as measured by ZEUS at GeV for tagged photoproduction events. The events have been separated in a non diffractive sample and two diffractive samples with different average values of the diffractive system mass of 5 and 10 GeV. The separation is done on an event by event basis, labelling as diffractive the events with a rapidity gap around the proton beam direction larger than a fixed cut. Soft interactions of hadrons can be described by thermodynamic models [93], which predict an approximately exponential spectrum of the kind:
| (49) |
where is the pion mass. This expression is fitted to the ZEUS data in the range GeV resulting in the solid lines. The fitted values of the slope are compared to results from and data as a function of the center of mass energy in Fig. 23. The slope of the ZEUS non-diffractive spectrum agrees with data from hadron-hadron scattering at similar energies. The diffractive slopes agree better with hadronic data taken at a lower energy: here they are plotted at 5 and 10 GeV, the values of the invariant mass of the dissociated photon, in agreement with data on proton diffractive dissociation at hadron colliders [63, 94].
The spectrum for non-diffractive events in Fig. 22 deviates from an exponential at high values. This is expected from QCD as a result of hard scattering between constituent partons. The high behaviour can be approximated by a power law:
| (50) |
with GeV and . In Fig. 24 HERA data are compared to data from the WA69 [95] fixed target photoproduction experiment at GeV. This shows that the spectrum becomes harder as the center of mass energy increases. The figure also shows fits of the form (50) to data from UA1 and CDF at several different energies [96, 97]. The spectrum for photoproduction at HERA is clearly harder than the one from interactions at a similar energy, and is in fact similar to at GeV.
High energy and interactions show a strong similarity for the production of particles at low , while the rate of high particles is quite different, revealing the two-fold nature of the photon. In fact the most appealing reason for the observed difference is that at high the pointlike coupling of the photon becomes important: thus interactions are not just like , instead direct and anomalous processes may occur. Other possible explanations could be the different pseudorapidity ranges used by the various experiments ( for UA1, for CDF, for ZEUS) or harder parton distributions in mesons (to which the photon converts according to the VDM) than in baryons.
HERA data have also been compared to a NLO QCD calculation [98] and are in good agreement in the region of high . The high inclusive particle cross section has recently been considered an important tool to extract precise parton distributions in the photon in the poorly known regions of and [99]. It has the advantage of being insensitive to possible multiple interactions or soft underlying event effects, discussed in section 7.3, as opposed to jet measurements.
7.2 Jets
Apart from the long tail in the distribution of particles, the observation of jets is a direct means to establish the occurence of hard scattering between constituent partons. A jet is a bunch of collimated particles coming from the fragmentation of a high energy quark or gluon. Jet measurements need a jet definition criterion or jet algorithm. Until now cone algorithms [100, 101] have been used more widely in photoproduction at HERA, given the framework similar to hadronic collisions.
Experimentally one starts from the calorimeter cells with energies above a threshold. For each cell the pseudorapidity and azimuth are determined from the segment joining the interaction vertex to the geometric center of the cell. Each cell with transverse energy above a few hundred MeV is considered as a possible seed for the jet finding. The seeds are combined if their distance in the space, , is less than some cut (usually or sometimes ). Then a cone of radius is drawn around each seed and the energy of all the included cells is summed up in a cluster. The cluster axis is defined along the Snowmass convention [101] from the -weighted mean of the cells inside the cone. A new cone of radius is then drawn around the calculated axis of the cluster and the axis is recalculated. The procedure is iterated until stability is reached. At the end it may happen that two clusters overlap. In this case if the shared transverse energy is more than of the total of one of the clusters they are merged, otherwise the common cells are assigned to the nearest one. In the end a cluster is called a jet if its transverse energy exceeds a minimum value. At HERA this is set typically in the range of GeV.
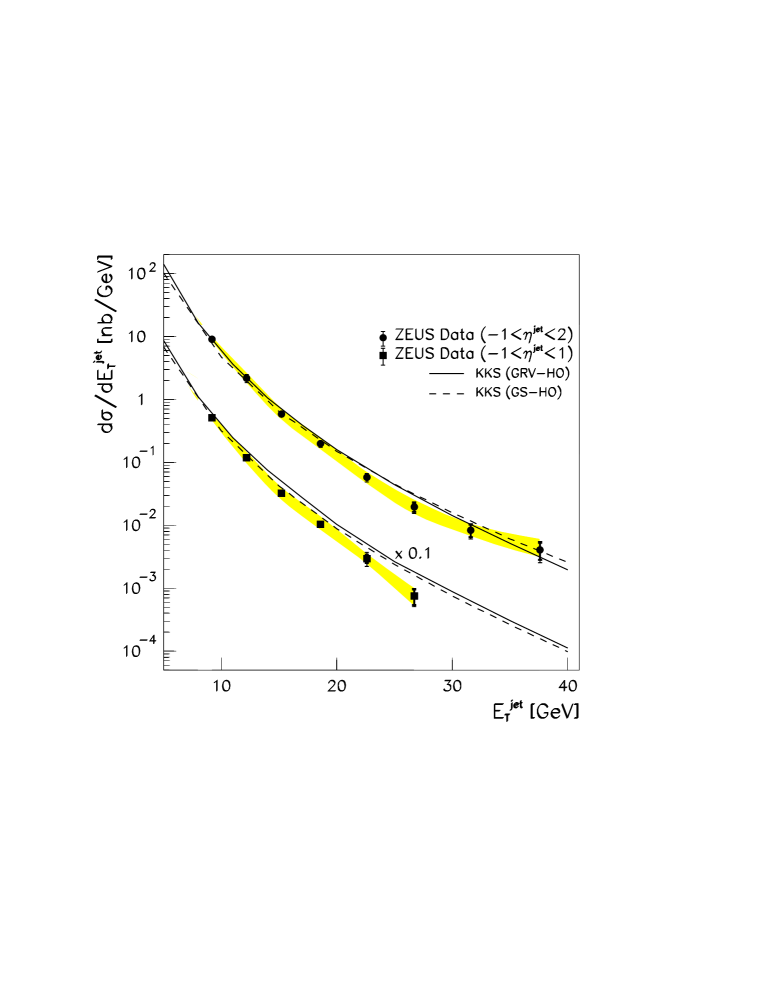
Inclusive jet production has been measured by ZEUS [102] for GeV in the laboratory pseudorapidity range , from pb-1 of untagged data ( GeV and ). Jets have been defined with a cone radius . Similar measurements have been reported by H1 [103] from a lower statistics of tagged data ( nb-1) with GeV2 and . Fig. 25 shows the differential cross section integrated over two ranges: and . Data are corrected to the hadron level for detector effects by a complete detector simulation.
NLO QCD calculations of inclusive jet cross sections have been carried out by several groups [104, 105, 106, 107, 108]. These calculations involve at most three partons in the final state, from which jets are defined by the same cone algorithm as used for data. NLO corrections can be very large, up to a factor of two. This is reflected in a strong dependence of the LO results upon variations in the energy scale at which the strong coupling constant is evaluated or in the factorization scales and . In LO these scales are often set at about the or of the hard jets. For those values the size of the NLO corrections is about its minimum. The stability of the NLO results against variations of the scales is much improved. The NLO curves plotted in Fig. 25 [106] are parton level results, not corrected for hadronization. They are consistent with the data.
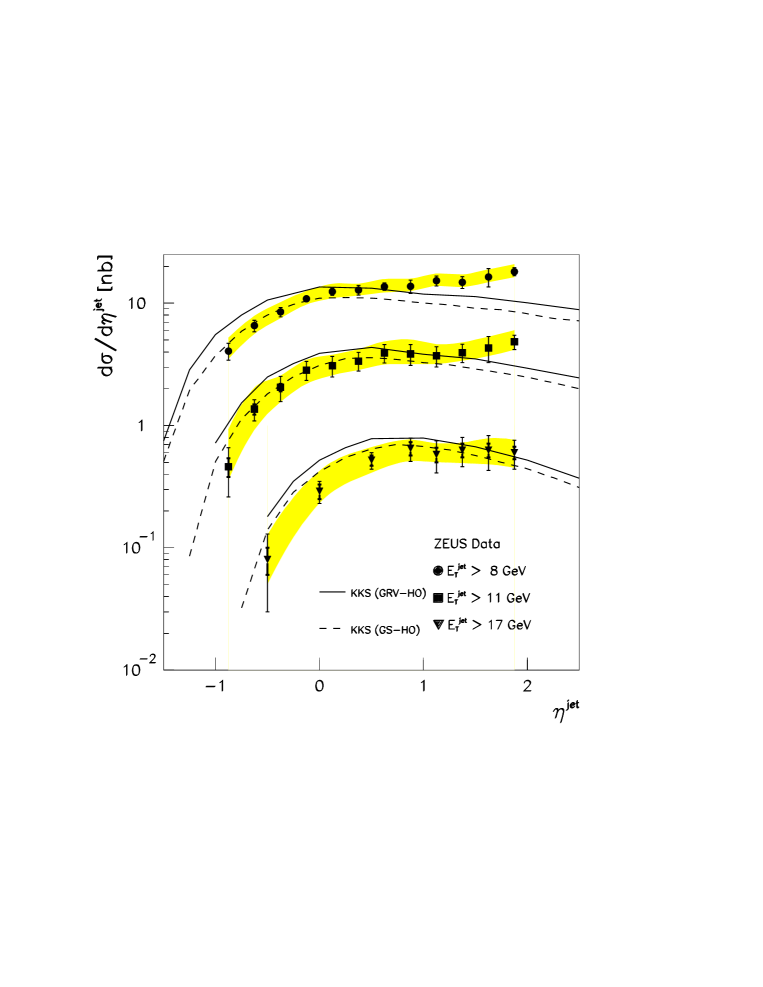
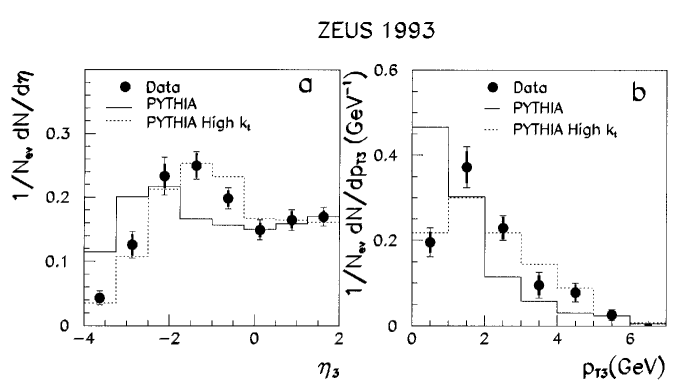
Fig. 26 presents for jets with greater than , or GeV. Comparison with the theoretical NLO results [106] shows a preference for the GS parametrization over GRV in the region , where the contribution from high partons is important. This is the photon fragmentation region, where the calculation is most reliable, thus giving a handle to test the photon structure. In the region the data, particularly at the lowest , are systematically above the predictions. Here the fragmentation corrections are sizeable and moreover the data are biased by a pedestal energy which has not been subtracted. This is thought to arise from a combination of soft and semi-hard interactions between the beam remnants in resolved photoproduction and it will be subject of a further discussion in the next section. A thorough understanding of this region is essential to carry out quantitative QCD tests in the low region accessible to HERA measurements ().
The largest experimental errors are due to the absolute energy scale of the calorimeters, whose uncertainty is within for the measurement of hadronic jets in both ZEUS and H1. This has been determined comparing real data and Monte Carlo simulated events. H1 studied the imbalance between the scattered electron and the hadronic jet in high events. ZEUS studied the ratio between (measured by the calorimeter) and the summed of the charged tracks associated with the jet (measured by the central tracking detector), for jets with ; for jets with the imbalance has been studied in dijet events with the second jet in the central region. Due to the exponential fall of the jet cross section with increasing , the energy scale error translates into a dominant systematic uncertainty of about on the normalization of the cross sections. This uncertainty is almost completely correlated from point to point in figures 25 and 26 and is indicated as a shaded band. It has to be interpreted as the maximum systematic shift that might be applied overall. The cross section measurements could then move all up or down of the indicated amount.
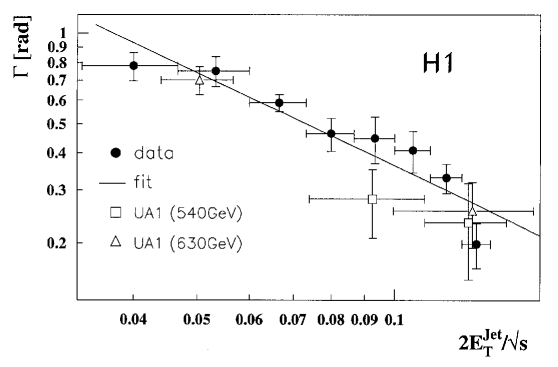
It is expected from QCD that jets become narrower with increasing energy. The jet shape, that is the transverse energy flow versus or , is approximately gaussian around the position of the jet axis. The full width at half maximum of a jet is expected to decrease as [109]. H1 has measured the dependence of on the scaled of the jet, shown in Fig. 27. The height of the gaussian is determined after subtraction of the pedestal energy. The jet transverse energy is normalized to the center of mass energy according to [109]. H1 data are compared to similar measurements from jet profiles in interactions [110]. The decrease of with increasing is apparent and, within the errors, and jets show the same behaviour.
Direct and resolved photon samples have been experimentally defined for the first time by a cut on the variable (45) in events with at least two reconstructed jets by ZEUS [87, 88]. The observed distribution after the selection cuts is shown in Fig. 28. It is compared to the predictions of two Monte Carlo programs, HERWIG [111] and PYTHIA [112], which include LO QCD matrix elements plus parton showers and hadronization models. Resolved and direct photon processes, as implemented in the Monte Carlos, populate different regions. The peak at high values of is clearly attributed to direct photon processes. Its shift from is due to higher order QCD corrections and fragmentation effects, which are simulated in the Monte Carlos. Given this clear separation direct and resolved photon processes can be operatively defined by a cut at . In the low region the Monte Carlo curves fall considerably below the data. The reason is the energy excess observed in the forward region in comparison with the Monte Carlo expectations, which is discussed in the next section.
Dijet cross sections have been measured by ZEUS separately for and from pb-1 of untagged data [88]. Jets have been required to have GeV. Moreover a cut on the pseudorapidity separation between the two jets has been applied: . The cross section has been measured in terms of , the average pseudorapidity of the jets. Assuming two jets with the same the kinematic variables and can be expressed as:
| (51) |
| (52) |
For the hyperbolic cosine takes its minimum value of unity and thus for given and the minimum values of and are probed [113]. Moreover there is a strong correlation between and in the direct cross section and between and in the resolved cross section. In Fig. 29 is shown for events defined as direct (), together with results of a LO QCD calculations using GS2 parton distributions for the photon and different parametrizations for the proton. The agreement is reasonable and improves when comparing with a QCD Monte Carlo allowing for transverse momentum of the incoming partons, parton showers and hadronization effects. NLO QCD calculations have become available only recently. The first results compared to ZEUS data had resolved diagrams calculated only at LO [114, 108]. These calculations improved the agreement with data. Moreover they revealed an interesting sensitivity of the dijet cross section at high on the quark content of the photon, with data preferring GS over GRV parametrizations.
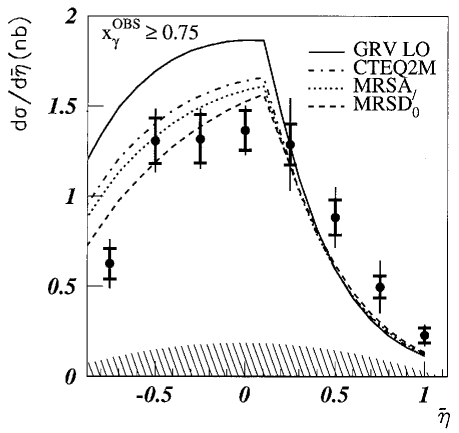
The resolved cross section () is shown in Fig. 30. Data are compared to a LO calculation using MRS(A) proton parton distributions and different parametrizations for the photon. Here only the shape can be reproduced by the theoretical curves, the normalization is below the data by a factor of to (except for LAC3 which is excluded by independent measurements from TRISTAN, as we showed at the end of section 2). This discrepancy can again be attributed to underlying soft or semi-hard interactions between the beam remnants.
Complete NLO calculations for dijet cross sections have been performed very recently [115] and compared to preliminary ZEUS data from a larger data sample. They obtain a good agreement for direct photon cross sections and even for resolved photon provided a minimum GeV. For jets with lower the comparison is still not good and the possibility of multiple interactions is thus confirmed on a more solid base.
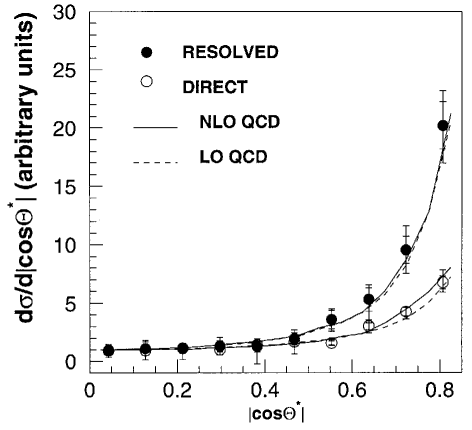
Besides the sensitivity to photon parton distributions, jet data can test the QCD dynamics of the hard parton scattering. In the dijet analysis described above, the cut constrained the angle between the jet-jet axis and the beam axis in the dijet center of mass system to be close to . In fact one gets:
| (53) |
Experimentally one can measure only the absolute value of because the two jets are indistinguishable. Different angular distributions are expected for direct and resolved processes. Direct processes, as the diagram in Fig. 21/a, have a quark propagator in the , or channel, with and channel processes dominating. The dominant resolved processes , , , as the diagram in Fig. 21/b, have or channel gluon exchange. Due to the different spin of the propagators, the angular dependence of the cross section is thus approximately for resolved processes and for direct processes. A steeper cross section is then expected at small scattering angle for resolved processes. This property is expected to be preserved even in NLO calculations [116]. The ZEUS experiment has measured the angular distribution in dijet events with GeV and [117]. The last cut keeps events with small boost of the dijet system in the HERA frame, which have the jets well inside the calorimeter acceptance:
| (54) |
A cut on the jet-jet invariant mass is applied at GeV, to avoid the bias due to the cut. The resulting is shown in Fig. 31 for direct and resolved events, defined as before by the cut on . There is good agreement between data and theory. The different shapes are not an artefact of the cut. Monte Carlo studies have confirmed that the shape is a characteristic of the spin of the propagator: even removing the cut resolved photon events generated with Monte Carlo maintain the same shape.
7.3 Underlying event energy
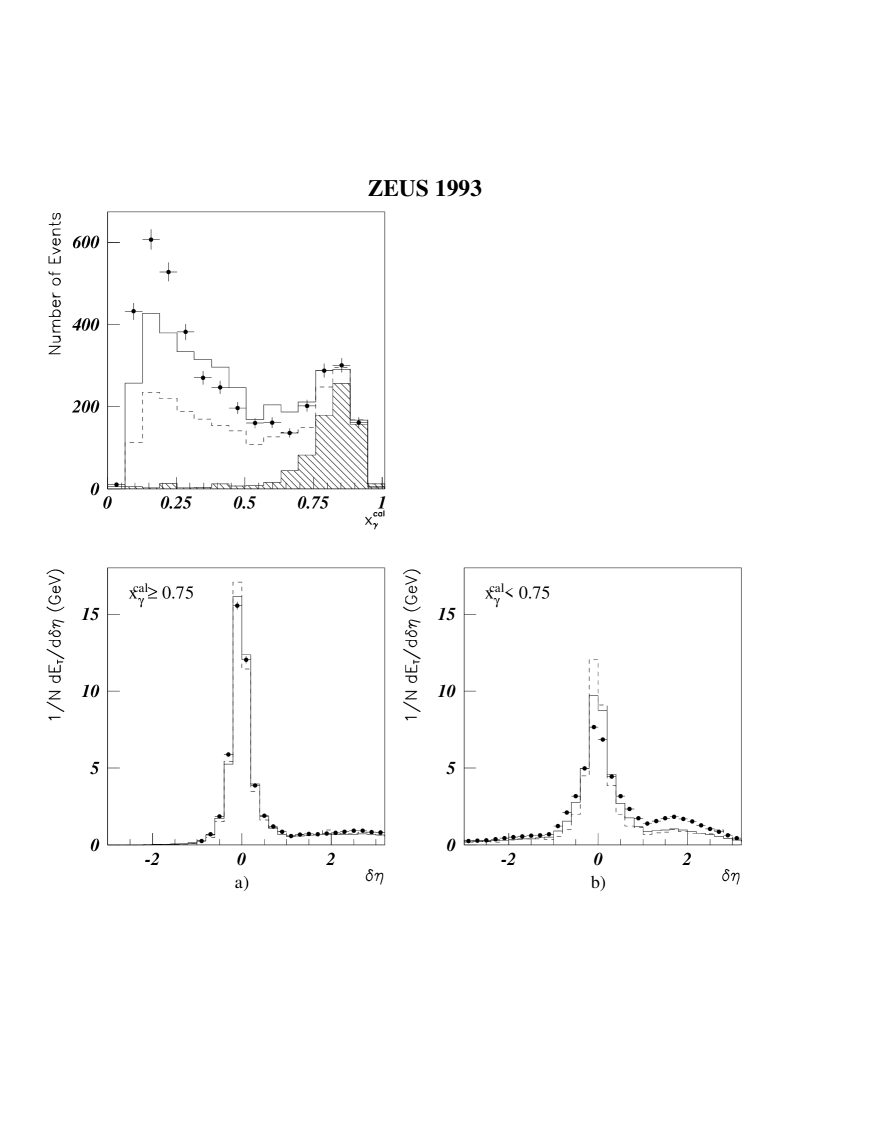
Let us come now to the problem of the observed pedestal energy. Jet shapes are shown in Fig. 32/a-b for direct and resolved event samples. Here the transverse energy flow is plotted as a function of the pseudorapidity distance from the jet axis. In the direct case () the jet shape is well reproduced by QCD Monte Carlos such as HERWIG or PYTHIA, including parton showers and hadronization. Instead in the resolved case () there is a large discrepancy on the forward side: data show a considerably larger amount of energy. The same effect was observed by both experiments without a cut on for jets in the forward hemisphere [102, 118]. The effect can be attributed consistently to resolved photon events, since they are largely dominant for this configuration. A possible explanation is the occurence of additional interactions between the proton and photon remnants, producing a soft underlying event or a superposition of soft and semi-hard multiple interactions. These phenomena should not happen in direct photon interactions where there is no photon remnant.
Multiple parton scattering has been studied in interactions in analyses of multi-jet events [119]. Recently a strong signal for it has been reported by the CDF Collaboration [120]. The jet shapes and the pedestal energy in interactions have also successfully been described by a multiple interaction model [121].
Multiple interaction models are currently implemented in many Monte Carlo programs like PYTHIA [121] and HERWIG [122], which cover both hadron-hadron and photon-hadron interactions and in PHOJET [123], which is specific to photoproduction. The simplest model in PYTHIA generates events starting from the LO QCD jet cross section, where the transverse momentum cutoff is set quite low, in the range of GeV. In this region the LO parton cross section diverges and becomes larger than the total non diffractive cross section . The so-called unitarization procedure consists schematically in allowing more than one interaction per event, with mean and fluctuations calculated from Poisson statistics. The resulting distributions are quite sensitive to , the cutoff and the chosen parton densities. A similar model has recently been implemented in HERWIG. The PHOJET generator is intended to simulate at once all the components contributing to the total photoproduction cross section. It is based on the two component Dual Parton Model [124] and includes multiple soft and hard interactions on the basis of a unitarization scheme [125]. Due to this scheme the dependence on the separating the soft and hard regions is rather weak. The soft part is described by soft pomeron phenomenology, with parameters tuned to and low energy interactions.
These models have been used by the H1 Collaboration in a detailed study of the properties of photoproduction events related to underlying multiple interactions [103]. The average level of outside jets has been studied in dijet events as a function of . In this study the pseudorapidity difference between the two jets was required to be , to avoid a possible mismatch of the photon remnant as a hard jet. In Fig. 33 the average transverse energy density is shown as a function of . It is determined from the summed in the central region of the collision (), excluding the energy contained in cones of radius around the jet axes. The long-dashed line is the energy density found in minimum bias events, where of course is undefined. The energy density increases significantly going from the direct photon (), where it is close to the level found in minimum bias events, to low events. The increase is much higher than what is expected from QCD Monte Carlos without multiple interactions like the PYTHIA dotted curve, and cannot be attributed to gluon radiation or fragmentation effects. Instead data can be described by models with interactions between the beam remnants as PHOJET or the PYTHIA dashed line.
This becomes more convincing when one looks at the energy-energy correlation with respect to the central region. The pseudorapidity correlation function is defined as:
| (55) |
H1 has measured this quantity with respect to , where the average transverse energy density is at the maximum, for a sample of high events. The result is shown in Fig. 34: data show short range correlations around and long range anticorrelations in the photon hemisphere, with a minimum at . From PYTHIA without multiple interactions one would expect stronger correlation and anticorrelation than data show. Adding multiple interactions the correlation is reduced in both signs and agreement with data greatly improves. The conclusion is that the addition of uncorrelated energy to the events results in the correct average level in the underlying event (Fig. 33) and also gives the correct correlation strength (Fig. 34).
7.4 Unfolding the gluon density in the photon
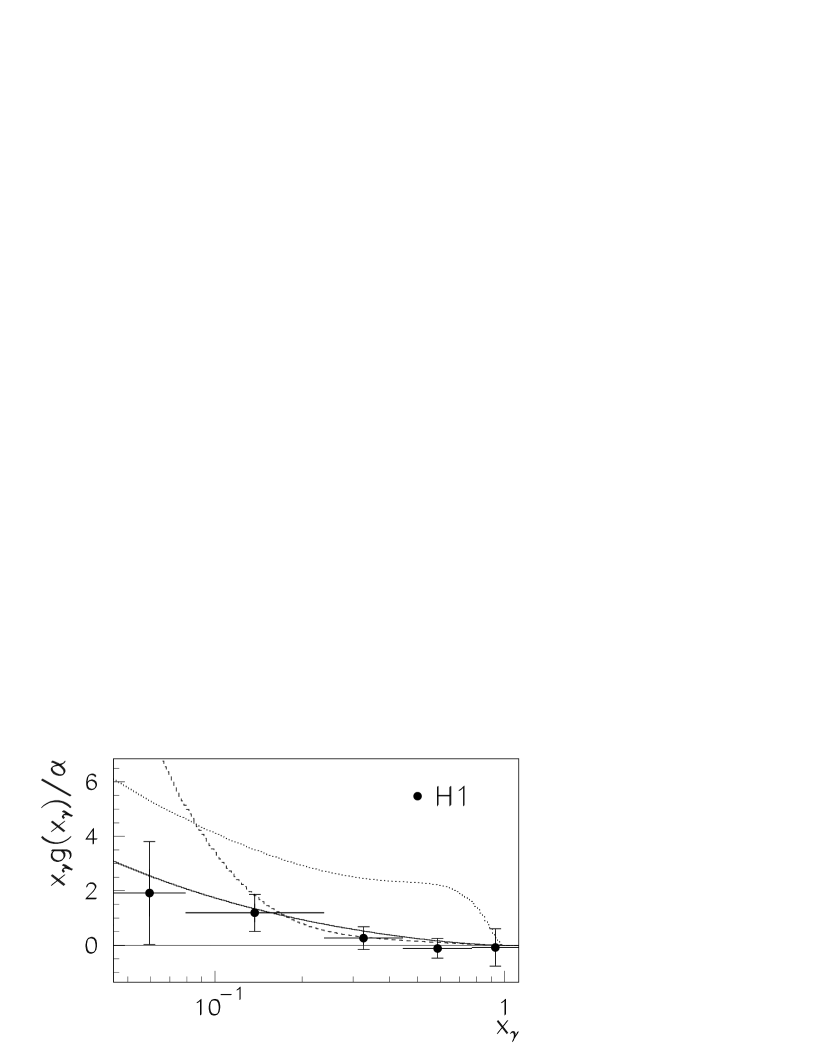
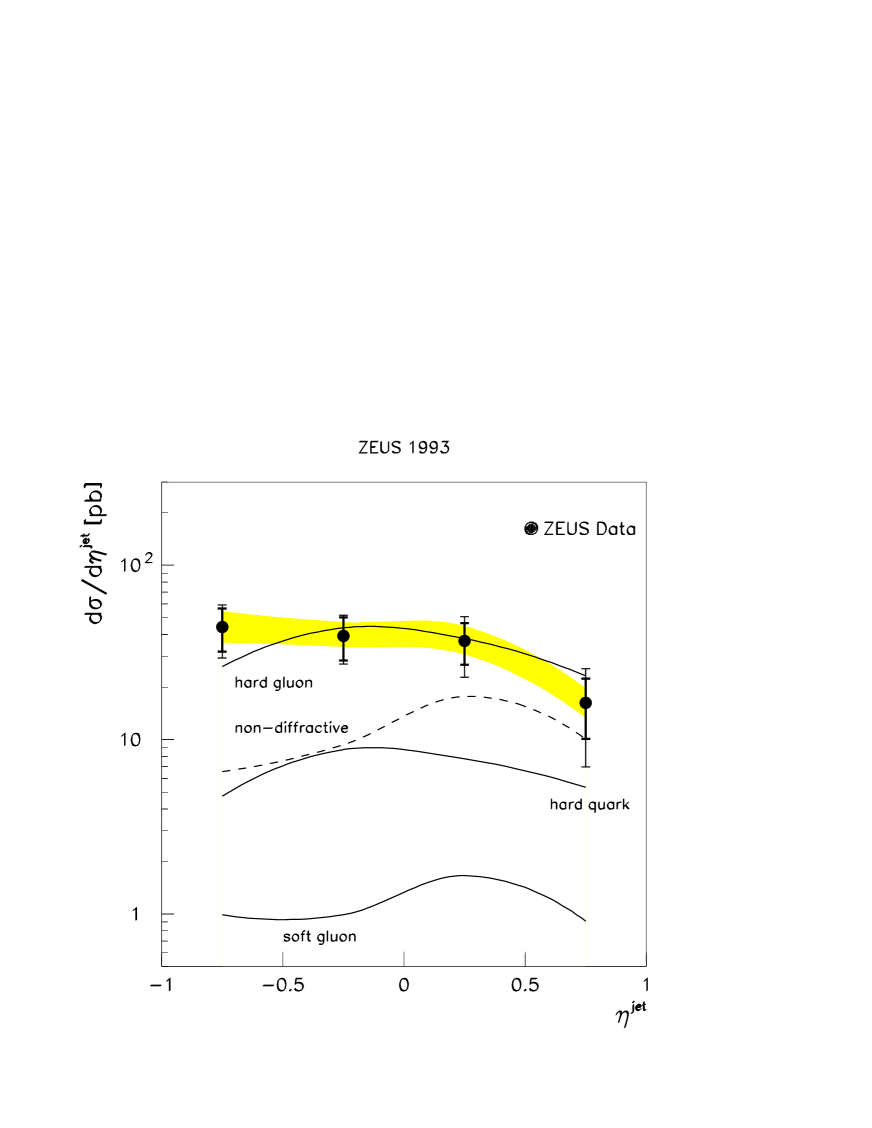
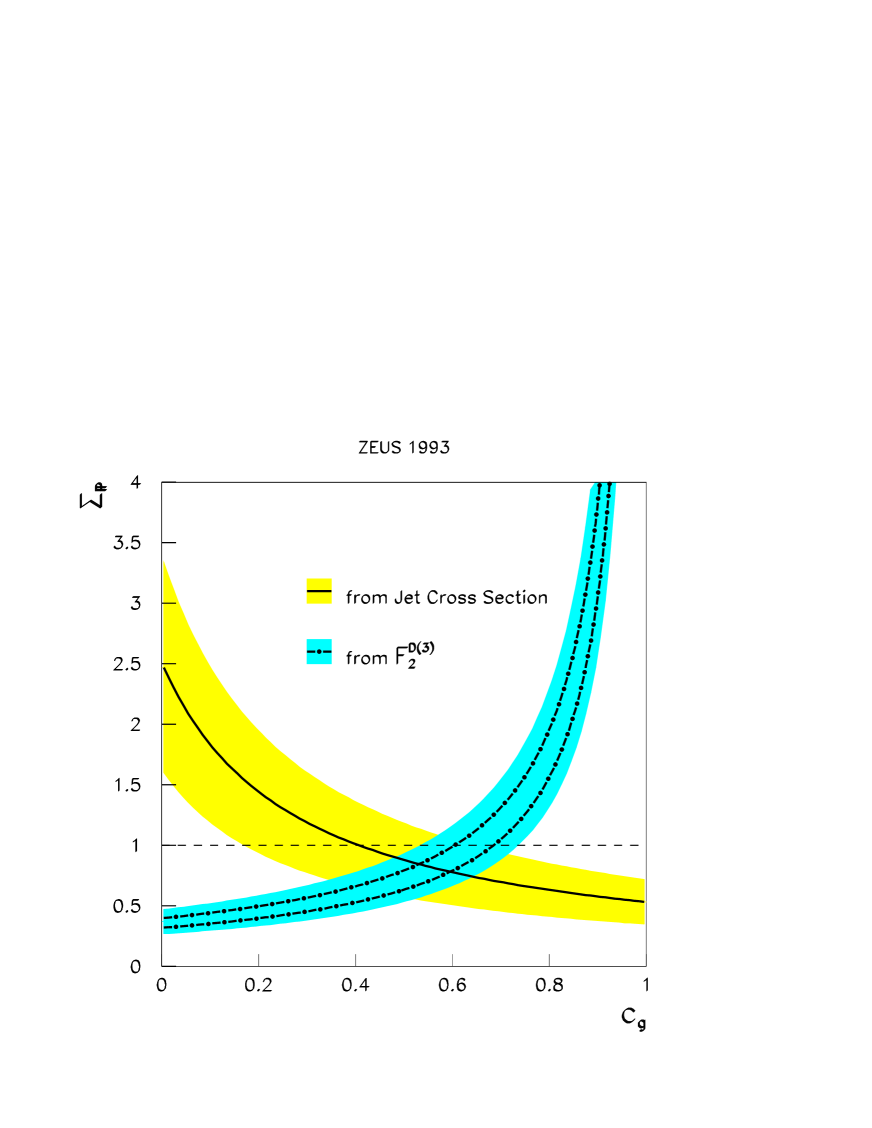
The study of the underlying energy carried out by H1 has also been used to correct their measured jet energies by subtracting the pedestal. The applied correction is parametrized as a function of and has size of GeV. From an analysis of dijet events with pedestal subtraction H1 [126] has unfolded LO parton variables, based on the PYTHIA Monte Carlo with multiple interactions included. This introduces some model dependence on the results. The data refer to nb-1 tagged photoproduction data from the 1993 run: the final sample is not large, 292 events with selected two jets with GeV and . First it is demonstrated the need of a gluon component in the photon and then the gluon momentum distribution is unfolded at LO. The distribution of the selected events in the unfolded is shown in Fig. 35. The full histogram represents the expected contribution of quarks and antiquarks in the photon, the dashed histogram the direct photon contribution, which is added on top of the other. These two are simply obtained from a LO QCD calculation at the parton level, using GRV LO parton distributions for the proton and the photon. The proton parton distributions at the relevant momentum fraction are well known and do not weaken the resolving power on the photon parton distributions. Data are well above the histogram at low , which is right the region where the contribution of gluons in the photon is expected to be important. The need for a gluon component has been checked with a test on this distribution, trying to fit data with LO QCD predictions without gluons in the photon. Only the sum of direct- and quark-antiquarks in has been considered and systematic corrections have been applied to both data and theoretical prediction in the sense to decrease the discrepancy. The resulting probability is found to be . The unfolded gluon momentum distribution is shown in Fig. 36 divided by . The average scale of the selected events is GeV2, where is used as factorization and renormalization scale for the QCD calculation. The resulting gluon distribution is compared to LO parametrizations of GRV-LO, LAC1 and LAC3. This latter is clearly excluded, in agreement with previous observations at HERA [118], TRISTAN [39, 40] and LEP [127]. The strong rise of LAC1 at low is disfavoured, while GRV-LO is consistent with data. This measurement constituted the first extraction of a LO gluon density down to .
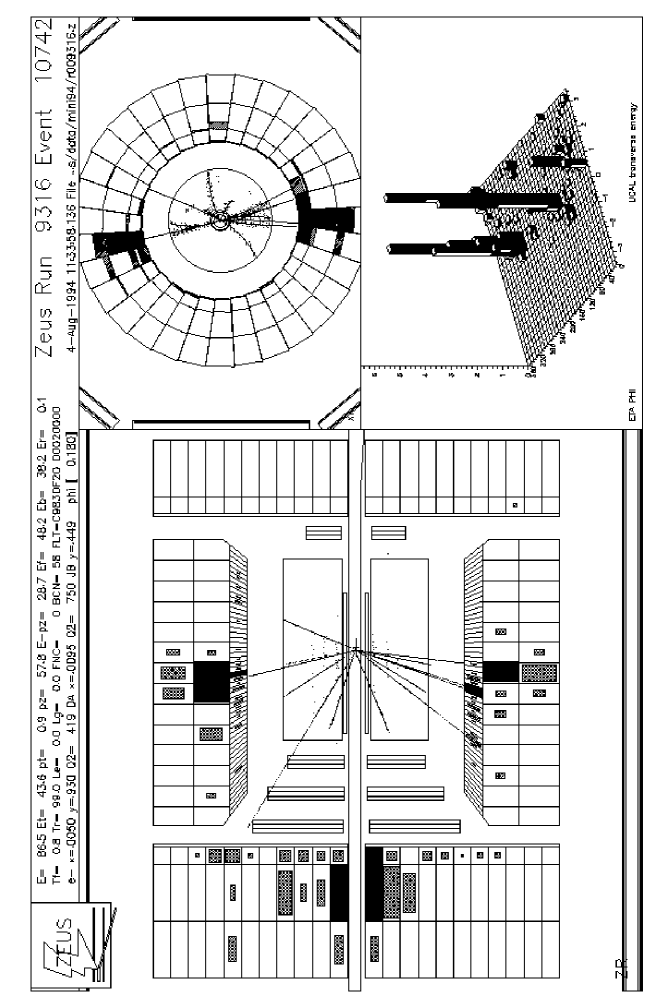
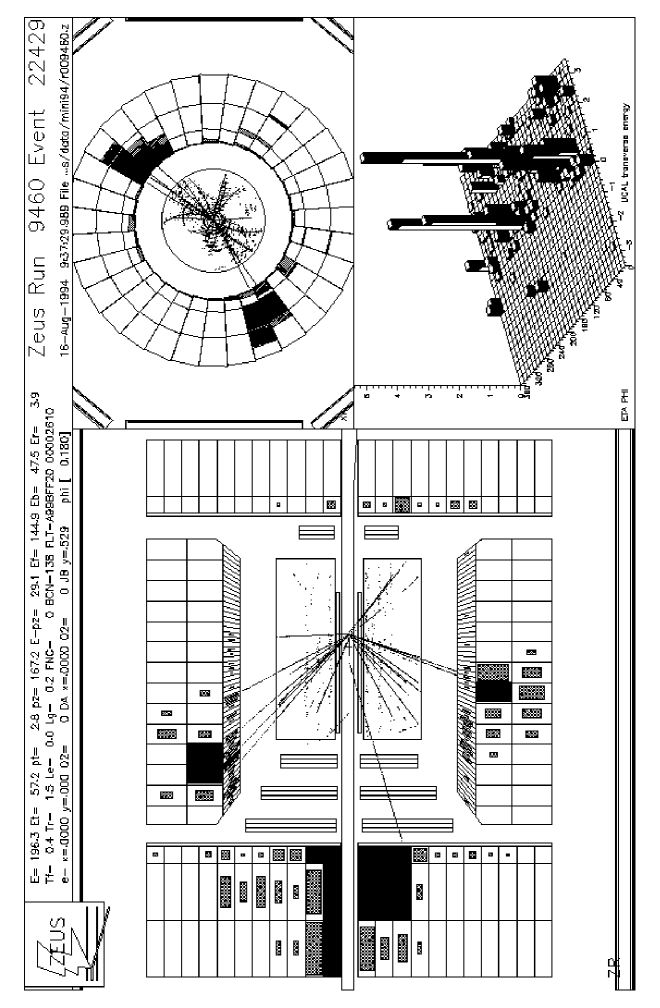
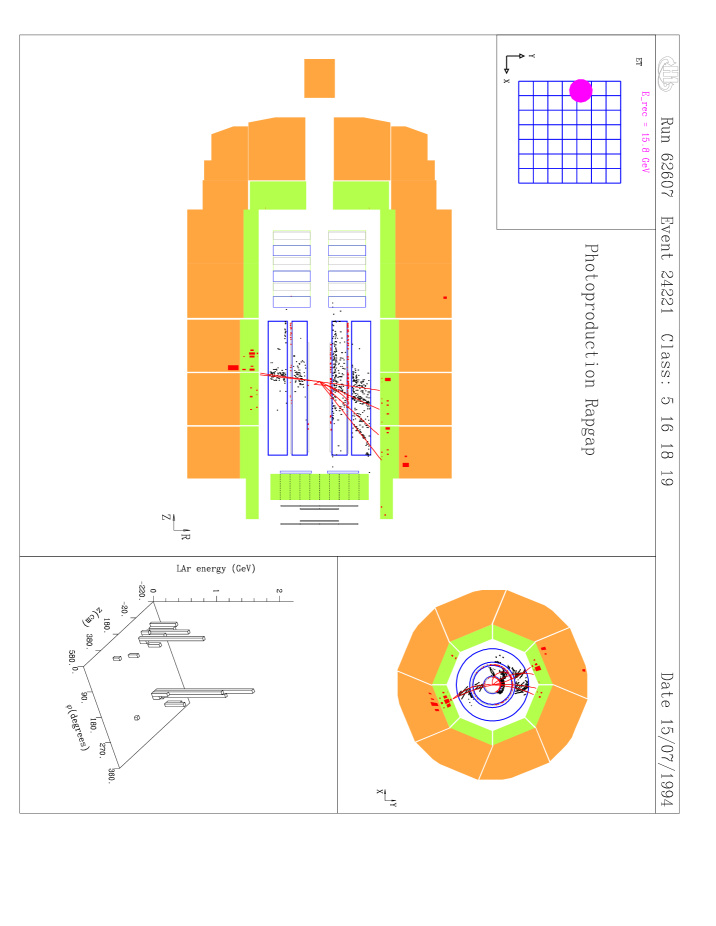
7.5 Photon remnant
As we have seen, direct and resolved processes are physically distinct as is apparent from the distribution in dijet events, and enriched samples can be obtained by cutting on this distribution. Another possible separation criterion relies on the different topology of the events. Figures 37 and 38 show respectively a direct and a resolved event candidate as reconstructed in the ZEUS detector. In these pictures the -axis (proton beam direction) points to the left. The direct candidate has no activity in the rear calorimeter, i.e. in the photon direction. Instead in the resolved candidate several particles are found to go in the photon direction. Both the events have in addition two high jets. The activity in the rear direction is interpreted as coming from the fragmentation of the photon remnant, which is present only for a resolved photon.
The ZEUS Collaboration has studied the properties of the photon remnant in events with two hard jets with GeV and [128]. To look for a photon remnant jet, emerging with small at small angles in the photon direction, the cone algorithm is not well suited. The jet finding was instead carried out with the -algorithm [129]. It is applied starting from single calorimeter cells, as if they were particles. The prescription of the algorithm is to evaluate for each pair of clusters (initially single cells) the quantity:
| (56) |
This is the transverse momentum of the lower energy cluster with respect to the higher energy cluster, for small angular separation . The proton remnant (escaping detection in the forward direction) is considered as a pseudoparticle with infinite momentum along . After all the values have been calculated, the two clusters with minimum are merged and their four-momenta added to give the four-momentum of the new cluster. The procedure is iterated until for all pairs the resolution variable becomes larger than some threshold . Here is defined as: , where is the total transverse energy in the event. In the ZEUS analysis this value has been chosen to vary from event to event in order to find always three clusters (apart from the proton remnant), ordered according to their . After comparison between data and Monte Carlo events the photon remnant has been identified in most cases as the source of the third cluster, which appears typically in the photon fragmentation region. The final selection required for it a minimum energy GeV and pseudorapidity . After these cuts the distribution is found to peak at low values as expected from resolved photon events. In Fig. 39/a-b the pseudorapidity and transverse momentum distributions are shown for the third cluster, identified as the photon remnant. A comparison with the standard QCD simulation by PYTHIA shows that data are shifted towards higher and more central values. The transverse momentum for the photon remnant is generated in PYTHIA with gaussian distribution with default GeV. This parameter determines the hardness of the spectrum. A fit to the data requires a higher of GeV. This observation agrees with studies suggesting that NLO contributions or fluctuations of the photon into pairs with high virtuality may lead to a photon remnant with sizeable transverse momentum with respect to the photon direction [130]. The properties of the jet from the photon remnant have been compared to those of the hard jets, assumed to originate from the hard parton scattering. Fig. 40/d shows the mean value of the particle transverse energy with respect to the cluster axis as a function of the cluster energy; Fig. 40/e shows the average values of the scalar sums of transverse and longitudinal particle energies with respect to the cluster axis as a function of the cluster energy. Particle quantities are measured from calorimetric islands, i.e. groups of adjacent calorimeter cells, and corrected to the hadron level by a complete detector simulation. Figure 40/f shows the energy flow as a function of the distance from the cluster axis, expressed as . In all the plots the photon remnant and the hard jets exhibit the same hadronization properties. The average particle transverse energy with respect to the jet axis is of the order of few hundred MeV and increases only weakly with the jet energy. The longitudinal component of the jet energy increases much faster than the transverse energy w.r.t the jet axis. Fig. 40/a-b-c compares the photon remnant distributions with expectations from PYTHIA; they are in good agreement after the tuning of the intrinsic distribution of the photon remnant.
7.6 Open charm production
Heavy quark photoproduction has been the subject of many theoretical studies [131]. Recent NLO QCD calculations for the HERA energies have been published for both total and differential cross sections [132]. A large amount of data exist from fixed target experiments with center of mass energies below GeV [133].
In leading order the dominant production mechanism is expected to be the direct photon-gluon fusion process , with , which is represented by the diagram in Fig. 21/a, where the fermion line is a heavy quark. This is mostly a photoproduction process, with a tail at high which is not dominant. Charm production is much more abundant than beauty production; the predicted cross sections at HERA are about b for charm and about nb for beauty. Monte Carlo studies show that the dominance of charm production still holds after the application of experimental tagging and selection criteria, that is why for the present analyses, with the achieved HERA luminosity, beauty production has not yet been considered. In LO QCD charm production can occur also in resolved photon interactions, mainly through the process . The relative fraction of direct and resolved photon is very sensitive to the photon parton densities. For parametrizations not steeply rising at low , like GRV, the resolved contribution is of the order of , while for LAC1 it is more than of the total cross section. Another strong source of variations in the theoretical predictions is the value of the charm mass , which is generally taken in the range GeV. Variation of the mass in this range changes the total cross section by more than a factor of 2. Charm production is somewhat at the boundary of applicability of perturbative QCD, due to the relative smallness of the charm mass, which is here the relevant scale for the perturbative expansion. The renormalization scale is set to and the factorization scales for proton and photon parton distributions are set to , according to [132]. Large variations occur by changing the scales. The large spread in the predictions justifies the interest in measuring the charm production at HERA, aiming to fix the input parameters of the calculation. The most interesting topic may be the determination of the gluon density in the proton, due to the predicted dominance of the direct photon production in the experimentally accessible region. In contrast to the measurements carried out from the scaling violations in DIS [33, 134], the gluon density enters directly at the leading order of QCD in charm production. Several possibilities to extract it have been investigated [135, 136].
HERA experiments have measured the charm production mainly through the reconstruction of the meson decays. The golden channel is , due to the very small mass difference between and , MeV; the slow pion has only MeV momentum in the rest frame. This special kinematic constraint allows to be measured more accurately than the mass itself [137]. The has been reconstructed in the channels or . The charge conjugate decay chain from the is implicitly considered.
Results on the total cross section have been published by both ZEUS [138] and H1 [139]. H1 results come from 1994 data, amounting to pb-1 tagged photoproduction data ( GeV2, GeV) and pb-1 untagged data ( GeV2, GeV). The accepted kinematic region is GeV and , where indicates the rapidity. The cut depends on the minimum needed to measure the tracks from the decay. The rapidity cuts select a well understood region of the tracking detectors. No particle identification has been used yet; well measured tracks are simply combined to form invariant masses. These measurements are shown in Fig. 41 as a function of the average center of mass energy , together with lower energy measurements from fixed target experiments [133]. The cross section rises by almost one order of magnitude compared to the energy range of fixed target experiments. The curves are NLO QCD calculations [132] with parton density sets MRS(G) [140] for the proton and GRV-HO for the photon. They limit the variation produced by a change of the renormalization scale in the range . The limited acceptance of the HERA experiments makes the measurement of the total charm cross section rather model dependent, because of the need to extrapolate from the accepted kinematic region. The extrapolated increases by if LAC1 photon parton densities are used instead of GRV-HO; it decreases by if the MRS(A’) proton parton densities are used instead of MRS(G). These uncertainties are included in the error bars. Data are not able to discriminate between different available gluon density parametrizations, even though they favour rising distributions at low . The visible cross section is instead almost insensitive to the choice of the parton distributions and to the mixture of direct and resolved processes assumed in the Monte Carlo to calculate the efficiency. Then cross sections within the experimental cuts can be safely compared with theory in a model independent way.
Differential cross sections versus the transverse momentum or the (pseudo)rapidity of the have been measured by both the experiments [139, 141]. ZEUS data come from pb-1 of the 1994 run. Fig. 42 shows the differential cross section for the observed . The theoretical curves are two very different NLO QCD calculations: the dotted and the dashed-dotted curve stem from an exact fixed-order NLO calculation including the charm mass [132]; the full curve is instead a NLO resummed calculation, where the charm mass is neglected in comparison to the -quark transverse momentum [143, 144] (limit of large ). The latter approach has been pursued also by another group [145, 148] and is sometimes referred to as the massless approach. Within the limits of applicability of this approach the charm is considered an active flavour in both the proton and the photon structure. On the contrary in the massive approach charm is generated from light partons and is excluded from the initial state. Both the calculations take into account the probability for a charm quark to fragment to : [142]. The spectrum is obtained from the calculated -quark spectrum convoluting it with the Peterson fragmentation function [146], which apart from the normalization is:
| (57) |
Here is the fraction of the charm quark momentum taken by the , and is a free parameter which is fitted from experimental data [147]. The massive calculation with default parameters gives the dash-dotted curve. It has the correct shape but the normalization is about half that of data. With an extreme choice of GeV and renormalization scale equal to half the transverse mass the dotted curve is obtained. The effect of changing the charm mass in the range GeV gives only a variation inside the accepted region. Instead the resummed calculation with equal parameters gives the correct normalization. This agreement is somewhat unexpected at least in the lowest region covered by the data, where the massive calculation should be definitely better. A possible explanation to this situation is suggested in [148]. Here it is argued that the parameter in the Peterson fragmentation function (57) varies sensibly depending on whether the fit to data is done using a LO or a NLO QCD calculation for the partonic piece of the cross section. Using their NLO resummed calculation the authors find the best fit for to be compared to the commonly used value , which is found with a LO calculation. This change would increase sizeably the cross section within the experimental cuts, and would bring also the massive calculation closer to data. In Fig. 43 the differential cross section as a function of the rapidity is shown, from the H1 analysis of untagged photoproduction data. Data are above the theoretical prediction of the massive calculation [132] in the forward region. Different curves show that the effect of changing the proton and photon structure functions is small. In particular using the LAC1 instead of the GRV(HO) set for the photon makes only a small variation.
7.7 Inelastic production
Another relevant process to access the gluon density in the proton is inelastic production. Here again the leading mechanism is thought to be a photon-gluon fusion, , in the so-called Colour-Singlet Model [149], represented by the diagram in Fig. 44. The name is due to the assumption that the pair giving the lies in a colour-singlet state. Extraction of the gluon density from this process has been the aim of analyses at fixed target experiments [150]. There, a discrepancy was found in the absolute normalization, with the data being higher than the predictions by a factor from 2 to 5. This was ascribed to missing higher order contributions (K-factor). Recently NLO QCD calculations have been performed [151, 152] and agreement with those data was obtained. HERA data have been published by H1 from an integrated luminosity of pb-1 [73]. The selected decay mode was . The direct photon-gluon fusion process has to be separated by other processes with quite different characteristics, like diffractive production with proton dissociation and production via resolved photon [153]. They are best discriminated by measuring the inelasticity variable , defined as:
| (58) |
where , , are respectively the four-momenta of the , the initial proton and the photon. This expression is evaluated from measured energy and momentum variables as:
| (59) |
with the sum extended to all the final state particles except the scattered electron. In the proton rest frame would be simply the ratio of the to the photon energy. in the elastic process , since in that case almost all the photon energy is transferred to the . also for events where the proton diffractively dissociates. Experimentally if particles are detected from the proton breakup they are at very forward angles, with , thus contributing only a little to expression (59). On the other hand resolved photon production contributes at low , due to the reduced energy that the photon brings into the hard subprocess. A clean sample of photon-gluon fusion events is selected in the range after detailed studies and Monte Carlo simulation of all the relevant processes. The cross section has been measured extrapolating to the low range and is shown in Fig. 45/a. Data are compared to a NLO calculation in the colour singlet model [152] with different gluon density parametrizations. All the curves assume GeV, MeV and renormalization and factorization scales set to . The agreement seems better for the distributions rising more steeply at low , like MRS(G). Actually the NLO calculation is not reliable at high and low of the . This is apparent from the differential cross section in Fig. 46/a, where the theoretical curve bends over at GeV2. A safe kinematic region to avoid theoretical problems is , GeV2: this corresponds to the requirement that the emitted gluon is hard. The cross section in this restricted region is shown in Fig. 45/b. Unfortunately the sensitivity to the input gluon distribution is decreased and all the curves agree with data. An exponential fit to with an exponential shape gives a slope GeV-2, in agreement with the theoretical calculation which gives GeV-2 for GeV2.
Data on inelastic and production at the Tevatron [154] have shown a huge discrepancy with the predictions of the Colour Singlet Model. They can however be fitted assuming additional colour octet terms in the general formalism of Bodwin, Braaten and Lepage [155]. This is not a new model: the basic idea is that the pair may be either in a colour singlet or in a colour octet state before producing the . In fact a colour octet state becomes a singlet simply by the emission of soft gluons. This non-perturbative step cannot in principle be neglected. The calculation needs phenomenological inputs which have to be fitted from data. To verify if HERA data are consistent with those observations, calculations have recently been performed to assess the effect of possible colour octet contributions at HERA [156, 157]. The prediction would be of a very steep increase of the production cross section for inelastic at high . In Fig. 46/b as measured by H1 is compared to the prediction of NLO colour singlet alone and to LO colour octet fixing its parameters to the CDF data [154]. It is clear that HERA data exclude any large colour octet contribution.
8 Hard diffraction in photoproduction
Both ZEUS and H1 have reported the measurement of a large diffractive component in photoproduction, about of the total cross section [55, 56], as discussed in section 5. This is expected in view of the analogy of to hadron-hadron interactions. Diffractive processes are not limited to soft interactions. The first observations of diffraction in hard collisions at HERA have come from DIS measurements [158]. The experimental signature for diffractive events was the observation of a large rapidity gap around the proton beam direction. This is customarily specified by the variable , defined as the pseudorapidity of the most forward energy deposit in the calorimeter with energy above MeV. Diffractive event samples have been defined having , which means that no particles are seen in the detectors within a cone of degrees around the proton beam direction. This cut selects mainly single photon dissociation events, where the initial proton is not broken up. Minor components are events where the proton dissociates to a low mass system which is not detected or non-diffractive events with unusual energy flow. About of the DIS events were found to have the large rapidity gap signature. The dependence of the event rate on as well as the approximate scaling observed in the DIS data indicated a diffractive process of leading twist. The diffractive structure function [159, 160] and the cross section as a function of the mass of the diffractive system [161] have then been measured. Hard diffractive events have also been observed in photoproduction [162]. Here events with high jets and the large rapidity gap signature were found.
8.1 Jets and heavy flavours from photon diffractive dissociation
The picture of a hard diffractive event in photoproduction is shown in Fig. 47. No activity is seen in the forward calorimeter, although two hard jets are visible in the central region.
The interest in hard diffractive processes is motivated by the possibility of perturbative QCD calculations. This can help to understand the nature of the pomeron, considering it as a partonic system [163]. Ingelman and Schlein [164] gave a particle-like description of the pomeron taking inspiration from ISR data [165]. Their model was confirmed by the UA8 experiment [166], which observed jet production in diffractive interactions with a tagged leading proton.
Let us describe in some detail how the Ingelman-Schlein model is implemented. It assumes that the proton emits a pomeron: a colourless object with vacuum quantum numbers. The variable is the fraction of the proton momentum taken by the pomeron. The square of the photon-pomeron center of mass energy is given by: . The flux of pomerons from the proton is factorized in the cross section and its expression is derived from hadron-hadron data. It is a function of and , the momentum transfer from the proton. Different forms for the pomeron flux factor are currently used. The Donnachie-Landshoff form [167] is calculated in Regge theory with parameters fitted to hadronic data:
| (60) |
where is the elastic form factor of the proton, GeV-1 is the pomeron-quark coupling and (GeV2) is the pomeron trajectory. The systematic uncertainty related to this choice is about , from the comparison of different procedures to extract the flux factor.
In the Ingelman-Schlein model the pomeron is then assumed to be a source of partons which may interact with the photon in both direct and resolved processes, according to the pointlike or hadron-like behaviour of the photon. Parton densities of the pomeron are introduced in perfect analogy to the proton case, where is the scaling variable, i.e. the fraction of the pomeron momentum carried by parton , and is the energy scale at which the pomeron is probed. The partonic cross section is then calculated in LO QCD and factorization of these parton densities is assumed. If this would be the case they could be extracted independently of the experiment. Several forms for the pomeron structure have been suggested, the most extreme ones are the following:
-
•
entirely made of gluons, with a hard distribution:
; -
•
entirely made of gluons, with a soft distribution:
; -
•
entirely made of pairs (only two light flavours), with a hard distribution:
.
The momentum sum for the pomeron is written as:
| (61) |
and in the Ingelman-Schlein model it is assumed . This is however only a guess. Since the pomeron is not a real particle, the flux factor and the momentum sum may be not independent. In the following the dependence on is neglected.
Jet cross sections in diffractive photoproduction have been measured by ZEUS [168] from pb-1 of untagged data. Data are corrected at the hadron level by detector simulation. Preselected events have a jet with GeV (at the calorimeter level) in the central region . This corresponds to GeV at the hadron level. The invariant mass of the hadronic system is reconstructed as: , where the sum is extended to all the calorimeter cells. Fig. 48/a shows the correlation between and : it is apparent that there is a distinct class of events with low that have low , that is a large rapidity gap. The distribution of for events with GeV is shown in Fig. 48/b. The simulation of non-diffractive processes by the PYTHIA Monte Carlo is not able to describe the tail at low . Instead the POMPYT Monte Carlo [169], based on the Ingelman-Schlein model [164], describes well the shape in this region. Fig. 48/c shows the distribution after the cut and Fig. 48/d the distribution for the selected events. The flat behaviour is in agreement with the expectations of POMPYT.
Figure 49 shows the differential jet cross section versus for the large rapidity gap events. Data include a contribution from double dissociation, where the proton diffractively dissociate to a hadronic system of mass GeV which is not detected. The dominant errors are statistical, while the largest systematic error () is due to the uncertainty on the absolute energy scale of the calorimeter. LO QCD predictions obtained by Monte Carlo are superimposed. Large rapidity gaps may occur in normal non-diffractive events as fluctuations in the pseudorapidity distribution of the final state hadrons. They are however exponentially suppressed with increasing gap width. The size of the non-diffractive contribution has been estimated with PYTHIA using MRS(D-) parton distributions for the proton [184] and GRV(HO) for the photon. The result is considerably lower than data and differs in shape. Data are instead in good agreement with the expectations of POMPYT assuming a hard gluon density inside the pomeron, while a pomeron made of hard quarks gives the correct shape but too low a normalization. A soft gluon density gives inconsistent results on both shape and normalization. These data are however insensitive to an additional soft component in the pomeron, present together with the hard component.
The diffractive jet data are sensitive to both the quark and the gluon content in the pomeron. The recent HERA measurements of the diffractive structure function in DIS [159, 160] have provided information on the quark content. This appears to have both a hard and a soft component. Moreover these measurements do not favour a pomeron made only of quarks and antiquarks. If factorization of the pomeron parton densities holds, the pomeron structure would appear the same whether it is probed in DIS or in photoproduction. Therefore, assuming factorization, the gluon content of the pomeron can be studied combining DIS and jet data. For that purpose a pomeron composed of both hard gluon and quark distributions has been assumed, naming and the relative gluon and quark fractions. Contributions from a possible soft parton component have been neglected, since the jet data are sensitive only to . The distribution of was corrected subtracting the non-diffractive and the double dissociation contributions. The first one was estimated with PYTHIA, which gives a good description of non-diffractive jet production in the central rapidity region. The latter was estimated from data to be and it has been assumed independent from according to the theoretical expectations. Then a fit to the measured was carried out varying the gluon fraction and leaving free the momentum sum (61) in POMPYT. The results are shown in Fig. 50 by the solid line. The shaded band gives the contour.
From the measurement of in DIS we can find the quark contribution to the momentum sum, , integrating over and :
| (62) |
where is the integral of the pomeron flux factor over and over the same region in and is a number depending on the assumed number of flavours ( for two flavours, for three flavours). The integral on the left hand side is performed using ZEUS data in the range . The flux factor is calculated using expression (60). The result is: () for two (three) flavours. The diffractive structure function has been parametrized from ZEUS data in the region . Here the same form is assumed to hold in the whole range . is approximately independent of in the range of the DIS measurements: GeV GeV2. Hence the dependence of on is neglected. Moreover the values are comparable to the values of of the selected jet events. Thus the DIS results are expressed as a constraint in the plane of figure 50 (dot-dashed lines):
| (63) |
Combining the two results and considering all the systematic uncertainties one obtains: and . From this nothing can be safely concluded on the validity of a momentum sum rule for the pomeron. However, assuming the same pomeron flux factor in DIS and photoproduction, this determination of the gluon content of the pomeron is independent on the normalization and even on the validity of a momentum sum rule. From this analysis one concludes that between and of the momentum of the pomeron carried by partons is due to hard gluons.
Further information on the partonic structure of the pomeron can be obtained from the diffractive production of heavy flavours. The diffractive production of has been discussed in section 6 because of the similarity with the light vector meson analyses. It illuminates the realm of hard diffraction, exhibiting a strong difference from light vector mesons, particularly in the steep dependence of the cross section on the center of mass energy. Clean data samples [73, 74] with good statistics have already been studied at HERA and succesfully compared to calculations based on perturbative QCD [80]. However for elastic production the theory retains some weakness related to long distance contributions in the cross section. Instead the diffractive production of open charm is in principle free from these uncertainties and recently has attracted much theoretical interest [170]. This process has been searched for by H1 [139]. They observed evidence of diffractive charm production by inspecting the distribution, shown in Fig. 51 for selected events. Here statistical subtraction of the background under the mass peak has been applied. The QCD Monte Carlo representing non-diffractive production is unable to reproduce the distribution, while the hard diffraction model implemented in the RAPGAP generator [171] reproduces well the shape when added to PYTHIA. H1 sets a lower limit on the diffractive cross section for GeV, and in untagged events ( GeV2 and ) to: pb at confidence level. Comparing this limit to predictions of RAPGAP, a quark dominated pomeron is disfavoured. In fact, the predicted cross section for a pomeron made of hard gluons is pb, while for a quark dominated pomeron it is only pb.
8.2 Hard colour singlet exchange
Another kind of hard diffractive process leads to the appearance of large rapidity gaps between two high jets. These events would result from the exchange of a colour singlet propagator in the -channel, as in the diagram of Fig. 52/a. The propagator could be an electroweak gauge boson or a strongly interacting object. The normal QCD jet production is instead described as a strong process with the exchange of a quark or a gluon propagator, as in Fig. 52/b. The colour charge of the propagator generates the colour connections between the hard jets. For this reason the pattern of soft gluon radiation is distributed over all the phase space, particularly in the central rapidity region between the two jets. Instead, for colour singlet exchange, the hard jets would be colour connected only to the beam remnants. In this case the central region would be depleted from particle production and could present the rapidity gap signature. This was first suggested by Bjorken [172], who also calculated the expected rate for this kind of events in interactions at the Tevatron ( TeV). He estimated the contribution from the exchange of two gluons in a colour singlet state to be of the cross section for single gluon exchange. Other calculations valid for high have been published based on perturbative QCD [173, 174].
The topology of the relevant events is shown in Fig. 52/c. Two jets are shown in the - plane, back-to-back in azimuth and separated by an interval in pseudorapidity. This is the pseudorapidity difference between the axes of the two jets. No particles are found between the jets in rapidity gap events.
The gap-fraction is defined as the ratio of the number of dijet events having a gap to the total number of dijet events with jet-jet separation equal to . It is expected to fall exponentially with increasing for non-diffractive processes. This follows assuming a constant pseudorapidity distribution of particles between the jets and is supported by analytic QCD calculations [174] and Monte Carlo results. Instead for colour singlet exchange the gap fraction is expected to be almost flat with [172, 174]. At large enough the colour-singlet exchange would then be dominating, as is shown in Fig. 52/d.
Allowing secondary interactions between the photon and proton remnants, the gap could be sometimes filled. A survival probability has been defined in [172], such that the observed gap-fraction is the product of and the gap probability at the parton level, which is a calculable quantity. Estimates of the survival probability for collisions at the Tevatron are in the range [172, 175]. The same quantity at HERA could be higher due to the substitution of the with the and the lower center of mass energy.
Both the Tevatron experiments D0 [176] and CDF [177] reported the observation of an excess of events with two hard jets separated by a rapidity gap, with respect to the expectations from normal QCD processes with colour exchange. The measured excess is about for D0, for CDF.
ZEUS published results based on pb-1 of 1994 data [178], requiring two jets with GeV, and small boost . A cone algorithm with was used and the distance between the two jets was required to be to have non-overlapping cones in . Gap events were found by inspecting the calorimeter pattern of energy, identifying particles by “islands” of neighbouring calorimeter cells with summed above a threshold of MeV. A gap event was defined as an event having no particles between the two jets with MeV (after correction of the calorimeter energies). The result is shown in Fig. 53, where the excess of gap events is evident in the last bin. The largest systematic uncertainty in data comes from the cut on the of the island and is included in the error bars. Data have been fitted with a function , with and free parameters and a normalization fixed by the obvious condition at . The result is shown as the solid curve, and for two degrees of freedom. The fitted parameters are: , . The size of the excess has been also checked comparing data with the expectations from PYTHIA, simulating non-diffractive jet production. From this comparison the excess is found to be , in agreement with the result of the fit. The actual number of events due to colour singlet exchange could be even higher than , accounting for a survival probability for the gaps. The larger excess of gap events found at HERA in comparison to the Tevatron results could come from the same underlying dynamics, given different survival probabilities for gaps in the two environments. At HERA the contribution to the gap events from or exchange cannot account for the observed excess, since in this kinematic range. Instead data can be explained by a hard diffractive process based on the exchange of a colour singlet combination of gluons.
9 Outlook
In this paper we have reviewed the published HERA results on photoproduction. The understanding of the hadronic structure of the photon as well as the understanding of photon induced reactions has greatly improved in the last few years. HERA data have played a central role. This progress will continue in the next years. We will not summarize here the covered contents, but rather prefer to have a glimpse on the future prospects for selected topics.
Most of the HERA measurements will have significant improvements in the next years with the expected luminosity increase. The final HERA results presented here include data up to the 1994 run, with integrated luminosity of about pb-1. The achieved luminosity during 1995-96 runs is about pb-1 and almost the same should be achieved during 1997. Future upgrade plans aim at an integrated luminosity exceeding pb-1 per year usable by the experiments.
Hard photoproduction processes at HERA are complementary to the deep inelastic scattering, being directly sensitive to both the quark and the gluon component of the photon. Data on jet photoproduction are presently consistent with the expectations of perturbative QCD. Ongoing analyses are studying extended domains in and , with different jet algorithms. The most severe experimental limitation on jet measurements is the energy scale uncertainty of the calorimeters, which can however be improved to about from the quoted in the results shown here. With such improvement large statistic samples with high jets will allow more precise QCD tests. The measurement of high inclusive charged particle spectra has been recently proposed as a valid alternative to have access to the parton distributions in the photon [99]. It has the advantage of being insensitive to the energy scale of the calorimeter, at the price of an uncertainty due to the fragmentation functions, needed to describe the transition from partons to hadrons. The estimated accuracy on the extraction of a NLO gluon density by this method is about . In parallel to HERA, the knowledge of the parton distributions in the photon (particularly the quark component) will be improved by high luminosity data from LEP2. From it high precision measurements of are expected up to of few hundred GeV2 and minimum about .
The heavy flavour studies at HERA are presently all limited by statistics. The comparison of open charm () data with the existing NLO QCD calculations has proved to be an interesting and intriguing benchmark. In particular the discrepancy of the exact massive NLO calculation with HERA data has to be clarified. It could be due to uncertainties of the charm fragmentation function or, if nothing else, it might reveal the importance of higher order contributions (NNLO), which are far from being calculated. Apart from the normalization of the cross section, it will be interesting to see if the reported excess of data in the forward pseudorapidity region will be confirmed. At reasonably high values a safe comparison of the NLO massive calculation with the calculation resumming the large logarithms of (the “massless” approach) should also help to understand the situation. Open charm data could also be used for a direct extraction of a NLO gluon density in the proton when a large data sample ( pb-1) will be available, as it has been proposed in [136]. Charm tagging capabilities will benefit from detector upgrades of the interaction region with the introduction of a silicon microvertex detector. This has already been installed in H1 and is currently being developed in ZEUS.
Elastic vector meson production at HERA is being studied with larger statistics while varying the involved energy scales (, ). The early results suggested the picture of a hard production mechanism, when a hard scale is present in the interaction, be it a high mass (as the mass) or high or . Recent fixed target data on production at high make difficult to draw safely this conclusion for light vector mesons. Detailed studies varying the scales will possibly shed some light on the transition from a non-perturbative description of the pomeron (the soft pomeron), to the hard perturbative pomeron. Hard diffraction data from HERA (in which the final state has jets or heavy flavour particles) are presently indicating that the gluon content of the diffractive exchange is substantial. Many different models are appearing on the market and are being tested, trying to unveil the nature of the hard pomeron.
In conclusion, the study of interactions at HERA has yielded a lot of results. Several detector upgrades have already been performed (or are being done), which will result in improved purities of the selected samples as well as a wider kinematic coverage. Adding to this the expected much larger statistics, there is a bright future for photoproduction physics at HERA.
Acknowledgements
This work has been supported by an European Community fellowship.
It is a pleasure to thank M. Arneodo, R. Brugnera, J. Dainton and Y. Yamazaki
for useful discussions. I am specially grateful to M. Cacciari, A. Caldwell
and S. Bhadra for a critical reading of the manuscript and many useful comments.
References
- [1] Bauer T.H. et al., Rev. Mod. Phys., 50 (1978) 261; 51 (1979) 407.
- [2] Sakurai J.J., Ann. Phys., 11 (1960) 1.
-
[3]
Weizsäcker C.F., Z. Phys., 88 (1934) 612;
Williams E.J., Phys. Rev., 45 (1934) 729. - [4] Budnev V.M. et al., Phys. Rep., 15C (1975) 181.
-
[5]
Walsh T.F., Phys. Lett., 36B (1971) 121;
Berman S.M., Bjorken J.D. and Kogut J.B., Phys. Rev., D 4 (1971) 3388;
Zerwas P.M. and Walsh T.F., Phys. Lett., 44B (1973) 195. - [6] Witten E., Nucl. Phys., B 120 (1977) 189.
- [7] Bardeen W.A. and Buras A.J., Phys. Rev., D 20 (1979) 166; (erratum) D 21 (1980) 2041.
- [8] Glück M. and Reya E., Phys. Rev., D 28 (1983) 2749.
-
[9]
Gribov V.N. and Lipatov L.N., Sov. J. Nucl. Phys., 15 (1972)
438, 675;
Lipatov L.N., Sov. J. Nucl. Phys., 20 (1975) 95;
Dokshitzer Yu.L., Sov. Phys. JETP, 46 (1977) 641;
Altarelli G. and Parisi G., Nucl. Phys., B 126 (1977) 298. - [10] De Witt R.J., Jones L.M., Sullivan J.D., Willen D.E. and Wyld H.W., Phys. Rev., D 19 (1979) 2046.
-
[11]
Rossi G., Phys. Rev., D 29 (1984) 852;
Glück M., Grassie K. and Reya E., Phys. Rev., D 30 (1984) 1447;
Drees M., Z. Phys., C 27 (1985) 123. - [12] Fontannaz M. and Pilon E., Phys. Rev., D 45 (1992) 382; (erratum) D 46 (1992) 484.
- [13] Glück M., Reya E. and Vogt A., Phys. Rev., D 45 (1992) 3986.
- [14] Laenen E., Riemersma S., Smith J. and Van Neerven W.L., Phys. Rev., D 49 (1994) 5753.
- [15] Vogt A., in Two-Photon Physics at LEP and HERA (Lund, 1994) edited by G. Jarlskog and L. Jönsson (Lund University) 1994, pp. 141-148.
- [16] Storrow J.K., Two-Photon Physics at LEP and HERA (Lund, 1994) edited by G. Jarlskog and L. Jönsson (Lund University) 1994, pp. 149-160.
- [17] Morgan D., Pennington M.R. and Whalley M.R., J. Phys. G: Nucl. Part. Phys., 20 (1994) suppl. 8A.
- [18] TOPAZ collaboration: Muramatsu K. et al., Phys. Lett., B 332 (1994) 477.
- [19] AMY Collaboration: Sahu S.K. et al., Phys. Lett., B 346 (1995) 208.
- [20] OPAL Collaboration: Akers R. et al., Z. Phys., C 61 (1994) 199.
- [21] OPAL Collaboration: Ackerstaff K. et al., CERN-PPE-96-155 (1996).
- [22] DELPHI Collaboration: Abreu P. et al., Z. Phys., C 69 (1996) 223.
- [23] Aurenche P., Schuler G.A. et al., in Physics at LEP2 (Geneva, 1995), edited by G. Altarelli, T. Sjöstrand, F. Zwirner (CERN) 1996, p. 291.
-
[24]
Field J.H., Kapusta F. and Poggioli L., Phys. Lett., B 181
(1986) 362;
Field J.H., Kapusta F. and Poggioli L., Z. Phys., C 36 (1987) 121;
Kapusta F., Z. Phys., C 42 (1989) 225. - [25] Drees M. and Godbole R.M., J. Phys. G.: Nucl. Part. Phys., 21 (1995) 1559.
- [26] Drees M. and Grassie K., Z. Phys., C 28 (1985) 451.
- [27] Abramowicz H., Charchula K. and Levy A., Phys. Lett., B 269 (1991) 458.
- [28] Hagiwara K., Tanaka M., Watanabe I. and Izubuchi T., Phys. Rev., D 51 (1995) 3197.
- [29] Gordon L.E. and Storrow J.K., Z. Phys., C 56 (1992) 307.
- [30] Gordon L.E. and Storrow J.K., ANL-HEP-PR-96-33 (1996).
- [31] Glück M., Reya E. and Vogt A., Phys. Rev., D 46 (1992) 1973.
- [32] Glück M., Reya E. and Vogt A., Z. Phys., C 53 (1992) 127; Z. Phys., C 53 (1992) 651.
- [33] H1 Collaboration: Aid S. et al., Nucl. Phys., B 470 (1996) 3.
- [34] ZEUS Collaboration: Derrick M. et al., Z. Phys., C 72 (1996) 399.
- [35] Aurenche P., Fontannaz M. and Guillet J.P., Z. Phys., C 64 (1994) 621.
- [36] Aurenche P., Baier R., Fontannaz M., Kienzle-Focatti M.H. and Werlen M., Phys. Lett., B 233 (1989) 517.
- [37] Schuler G.A. and Sjöstrand T., Z. Phys., C 68 (1995) 607; Phys. Lett., B 376 (1996) 193.
- [38] AMY Collaboration: Tanaka R. et al., Phys. Lett., B 277 (1992) 215.
- [39] TOPAZ Collaboration: Hayashii H. et al., Phys. Lett., B 314 (1993) 149.
- [40] AMY Collaboration: Kim B.J. et al., Phys. Lett., B 325 (1994) 248.
- [41] Blondel A. and Jacquet F., in Study of an facility for Europe, edited by U. Amaldi, DESY report 79-48 (1979) p. 391.
- [42] ZEUS Collaboration: Derrick M. et al., in The ZEUS detector, Status Report, DESY (1993).
- [43] H1 Collaboration: Abt I. et al., Nucl. Instr. Meth., A 386 (1997) 310-347 and 348-396.
- [44] UA1 Collaboration: Arnison G. et al., Phys .Lett. B 128 (1983) 336.
- [45] E710 Collaboration: Amos N.A. et al., Phys. Rev. Lett., 63 (1989) 2784; Phys. Lett., B 243 (1990) 158.
- [46] CDF Collaboration: Abe F. et al., Phys. Rev., D 50 (1994) 5550.
- [47] Froissart M., Phys. Rev., 123 (1961) 1053.
- [48] Martin A., Phys. Rev., 124 (1963) 1432.
- [49] Baldini A. et al., Landolt-Börnstein’s New Series I/12B (1988) 345.
- [50] Collins P.D.B., An introduction to Regge theory and high energy physics, Cambridge University Press, Cambridge (1977).
- [51] Donnachie A. and Landshoff P.V., Phys. Lett., B 296 (1992) 227.
- [52] Pomeranchuk I.Y., Sov. Phys. JETP, 7 (1958) 499.
- [53] Cline D., Halzen F. and Luthe J., Phys. Rev. Lett., 31 (1973) 491.
- [54] Forshaw J.R. and Storrow J.K., Phys. Lett., B 268 (1991) 116.
- [55] H1 Collaboration: Aid S. et al., Z. Phys., C 69 (1995) 27.
- [56] ZEUS Collaboration: Derrick M. et al., Z. Phys., C 63 (1994) 391.
- [57] Abramowicz H., Levin E.M., Levy A. and Maor U., Phys. Lett., B 269 (1991) 465.
- [58] Schuler G. and Terron J., in Physics at HERA (Hamburg, 1991), Vol. 1, edited by W.Buchmüller and G.Ingelman (DESY, Hamburg) 1992, pp. 599-611.
- [59] Capella A., Kaidalov A., Merino C. and Tran Thanh Van J., Phys. Lett., B 343 (1995) 403.
- [60] Schuler G.A. and Sjöstrand, Nucl. Phys., B 407 (1993) 539.
- [61] Gotsman E., Levin E.M. and Maor U., Phys. Lett. B 347 (1995) 424.
- [62] Donnachie A. and Landshoff P.V., Phys. Lett., B 348 (1995) 213.
- [63] Goulianos K., Phys. Rep., 101 (1983) 170.
-
[64]
Egloff R.M. et al., Phys. Rev. Lett. 43 (1979) 657 ;
Aston D. et al., Nucl. Phys., B 209 (1982) 56;
Busenitz J. et al., Phys. Rev., D 40 (1989) 1. -
[65]
E401 Collaboration: Binkley M. et al., Phys. Rev. Lett., 48
(1982) 73;
FTPS Collaboration: Denby B.H. et al., Phys. Rev. Lett., 52 (1984) 795;
E687 Collaboration: Frabetti P.L. et al., Phys. Lett., B 316 (1993) 197. - [66] ZEUS Collaboration: Derrick M. et al., Z. Phys., C 69 (1995) 39.
- [67] H1 Collaboration: Aid S. et al., Nucl. Phys., B 463 (1996) 3.
- [68] ZEUS Collaboration: Derrick M. et al., Z. Phys., C 73 (1997) 253.
- [69] ZEUS Collaboration: Derrick M. et al., Z. Phys., C 73 (1996) 73.
- [70] ZEUS Collaboration: Derrick M. et al., Phys. Lett., B 377 (1996) 259.
- [71] H1 Collaboration: Ahmed T. et al., Phys. Lett. B 338 (1994) 507.
- [72] ZEUS Collaboration: Derrick M. et al., Phys. Lett., B 350 (1995) 120.
- [73] H1 Collaboration: Aid S. et al., Nucl. Phys., B 472 (1996) 3.
- [74] ZEUS Collaboration: Breitweg J. et al., DESY 97-060 (1997).
- [75] ZEUS Collaboration: Derrick M. et al., Phys. Lett., B 356 (1995) 601; Phys. Lett., B 380 (1996) 220.
- [76] H1 Collaboration: Aid S. et al., Nucl. Phys., B 468 (1996) 3; Adloff C. et al., DESY 97-082 (1997).
-
[77]
Schilling K. et al., Nucl. Phys., B 15 (1970) 397;
Schilling K. and Wolf G., Nucl. Phys., B 61 (1973) 381. - [78] Haakman L.P.A., Kaidalov A. and Koch J.H., Phys. Lett., B 365 (1996) 411.
- [79] Jenkovszky L.L., Martynov E.S. and Paccanoni F., in Hadrons 96: confinement (Novy Svet, Ukraine, 1996), edited by G. Bugrij, L.L. Jenkovszky, E.S. Martynov., 1996, pp. 170-178.
-
[80]
Ryskin M.G., Z. Phys., C 57 (1993) 89;
Ryskin M.G., Roberts R.G., Martin A.D., Levin E.M., RAL-TR-95-065 (1995). - [81] Brodsky S.J., Frankfurt L., Gunion J.F., Mueller A.H. and Strikman M., Phys. Rev., D 50 (1994) 3134.
- [82] Nemchik J., Nikolaev N.N. and Zakharov B.G., Phys. Lett., B 341 (1994) 228.
- [83] Martin A.D., Roberts R.G. and Stirling W.J., Phys. Lett., B 354 (1995) 155.
- [84] Glück M., Reya E. and Vogt A., Z. Phys., C 67 (1995) 433.
- [85] Del Duca V., Gallo E., Marage P., DESY 96-179 (1996), presented at the International Workshop on Deep Inelastic Scattering and Related Phenomena (DIS 96), Rome, Italy, 15-19 April 1996.
- [86] E665 Collaboration: Adams M.R. et al., FERMILAB-PUB-97-103-E (1997).
- [87] ZEUS Collaboration: Derrick M. et al., Phys. Lett., B 322 (1994) 287.
- [88] ZEUS Collaboration: Derrick M. et al., Phys. Lett., B 348 (1995) 665.
- [89] Binnewies J., Kniehl B.A. and Kramer G., Phys Rev., D 52 (1995) 4947.
- [90] Sterman G. et al., Rev. Mod. Phys., 67 (1995) 157.
- [91] H1 Collaboration: Abt I. et al., Phys. Lett., B 328 (1994) 176.
- [92] ZEUS Collaboration: Derrick M. et al., Z. Phys., C 67 (1995) 227.
- [93] Hagedorn R., Riv. Nuo. Cim., 6 (1983) 1.
-
[94]
Geich-Gimbel C., Int. Jour. Mod. Phys., A 4 (1989) 1527;
Giacomelli G., Int. Jour. Mod. Phys., A 5 (1990) 223. - [95] OMEGA Photon Collaboration: Apsimon R.J. et al., Z. Phys., C 43 (1989) 63.
- [96] UA1 Collaboration: Albajar C. et al., Nucl. Phys. B 335 (1990) 261.
- [97] CDF Collaboration: Abe F. et al., Phys. Rev. Lett., 61 (1988) 1819.
-
[98]
Borzumati F.M., Kniehl B.A. and Kramer G., Z. Phys., C 59
(1993) 341;
Kniehl B.A. and Kramer G., Z. Phys., C 62 (1994) 53. - [99] Binnewies J., Erdmann M., Kniehl B.A. and Kramer G., in Future Physics at HERA (Hamburg, 1995/96), Vol. 1, edited by G.Ingelman, A.De Roeck and R.Klanner (DESY, Hamburg) 1996, pp. 549-552.
- [100] UA1 Collaboration: Arnison G. et al., Phys. Lett., B 123 (1983) 115.
- [101] Huth J. et al., in 1990 DPF Summer Study on High Energy Physics (Snowmass, Colorado), edited by Berger E.L. (World Scientific, Singapore) 1992, pp. 134-136.
- [102] ZEUS Collaboration: Derrick M. et al., Phys. Lett., B 342 (1995) 417.
- [103] H1 Collaboration: Aid S. et al., Z. Phys., C 70 (1996) 17.
- [104] Gordon L.E. and Storrow J.K., Phys. Lett., B 291 (1992) 320.
- [105] Greco M. and Vicini A., Nucl. Phys., B 415 (1994) 386.
-
[106]
Bödeker D., Kramer G. and Salesch S.G., Z. Phys., C 63 (1994) 471;
Klasen M., Kramer G. and Salesch S.G., Z. Phys., C 68 (1995) 113. - [107] Aurenche P., Guillet J.P., Fontannaz M., Phys. Lett., B 338 (1994) 98.
- [108] Harris B.W. and Owens J.F., presented at DPF 1996, Minneapolis (hep-ph/9608378).
- [109] Kramer G. and Salesch S.G., Phys. Lett., B 317 (1993) 218; Phys. Lett., B 333 (1994) 519.
-
[110]
UA1 Collaboration: Albajar C. et al., Nucl. Phys., B 309
(1988) 405;
UA1 Collaboration: Arnison G. et al., Phys. Lett., B 132 (1983) 214. - [111] Marchesini G., Webber B.R., Abbiendi G., Knowles I.G., Seymour M.H. and Stanco L., Comp. Phys. Comm., 67 (1992) 465.
- [112] Sjöstrand T., Comp. Phys. Comm., 82 (1994) 74.
- [113] Forshaw J.R. and Roberts R.G., Phys. Lett., B 319 (1993) 539.
- [114] Klasen M. and Kramer G., Phys. Lett., B 366 (1996) 385.
-
[115]
Klasen M. and Kramer G., DESY 96-246 (November 1996);
Klasen M., Ph.D. thesis, University of Hamburg and DESY 96-204 (1996). - [116] Baer H., Ohnemus J. and Owens J.F., Phys. Rev., D 40 (1989) 2844.
- [117] ZEUS Collab., Derrick M. et al., Phys. Lett., B 384 (1996) 401.
- [118] H1 Collaboration: Abt I. et al., Phys. Lett., B 314 (1993) 436.
-
[119]
AFS Collaboration: Åkesson T. et al., Z. Phys., C 34 (1987)
163;
UA2 Collaboration: Alitti J. et al., Phys. Lett., B 268 (1991) 145;
CDF Collaboration: Abe F. et al., Phys. Rev., D 47 (1993) 4857. - [120] CDF Collaboration: Abe F. et al., FERMILAB-PUB-97-083-E and FERMILAB-PUB-97-094-E (1997).
- [121] Sjöstrand T. and Van Zijl M., Phys. Rev., D 36 (1987) 2019.
- [122] Butterworth J.M., Forshaw J.R. and Seymour M.H., Z. Phys., C 72 (1996) 637; Butterworth J.M. and Forshaw J.R., J. Phys., G 19 (1993) 1657.
- [123] Engel R., Z. Phys., C 66 (1995) 203.
- [124] Capella A., Sukhatme U., Tan C.I., Tran Thanh Van J., Phys. Rep., 236 (1994) 227.
- [125] Capella A., Tran Thanh Van J., Kwiecinski J., Phys. Rev. Lett., 58 (1987) 2015.
- [126] H1 Collaboration: Ahmed T. et al., Nucl. Phys., B 445 (1995) 195.
-
[127]
ALEPH Collaboration: Buskulic D. et al., Phys. Lett., B 313
(1993) 509;
DELPHI Collaboration: Abreu P. et al., Phys. Lett., B 342 (1995) 402. - [128] ZEUS Collaboration: Derrick M. et al., Phys. Lett., B 354 (1995) 163.
-
[129]
Catani S., Dokshitzer Y.L., Seymour M.H. and Webber B.R.,
Nucl. Phys., B 406 (1993) 187;
Catani S., Dokshitzer Y.L. and Webber B.R., Phys. Lett., B 285 (1992) 291. -
[130]
Chyla J., Phys. Lett., B 320 (1994) 186;
Schuler G.A. and Sjöstrand T., in Two-Photon Physics from DAPHNE to LEP200 and Beyond, (Paris 1994), edited by F. Kapusta and J.J. Parisi (World Scientific) 1994, pp. 163-183;
Drees M., in Multiparticle dynamics (Aspen, Colorado, 1993), edited by Martin M. Block and Alan R. White (World Scientific) 1994, pp. 110-116. -
[131]
Ellis R.K. and Nason P., Nucl. Phys., B 312 (1989) 551;
Smith J. and Van Neerven W.L., Nucl. Phys., B 374 (1992) 36;
Frixione S., Mangano M.L., Nason P. and Ridolfi G., Nucl. Phys., B 412 (1994) 225. -
[132]
Frixione S., Mangano M.L., Nason P. and Ridolfi G., Phys. Lett.,
B 348 (1995) 633;
Frixione S., Nason P. and Ridolfi G., Nucl. Phys., B 454 (1995) 3 -
[133]
CIF Collaboration: Atiya M.S. et al., Phys. Rev. Lett., 43
(1979) 414;
BFP Collaboration: Clark A.R. et al., Phys. Rev. Lett., 45 (1980) 682;
WA4 Collaboration: Aston D. et al., Phys. Lett., B 94 (1980) 113;
SLAC HFP Collaboration: Abe K. et al., Phys. Rev., D 30 (1984) 1;
EMC Collaboration: Arneodo M. et al., Z. Phys., C 35 (1987) 1;
PEC Collaboration: Adamovich M. et al., Phys. Lett., B 187 (1987) 437;
E691 Collaboration: Anjos J.C. et al., Phys. Rev. Lett., 65 (1990) 2503;
NA14/2 Collaboration: Alvarez M.P. et al., Z. Phys., C 60 (1993) 53. - [134] ZEUS Collaboration: Derrick M. et al., Phys. Lett., B 345 (1995) 576.
- [135] van Woudenberg R. et al., in Physics at HERA (Hamburg, 1991), Vol. 2, edited by W.Buchmüller and G.Ingelman (DESY, Hamburg) 1992, pp. 739-769.
-
[136]
Frixione S., Mangano M., Nason P. and Ridolfi G., Phys.
Lett., B 308 (1993) 137;
Frixione S., in Future physics at HERA (Hamburg, 1995-96), Vol. 1, edited by G. Ingelman, A. De Roeck and R. Klanner (DESY, Hamburg) 1996, pp. 408-415. -
[137]
Nussinov S., Phys. Rev. Lett., 35 (1975) 1672;
Feldmann G. et al., Phys. Rev. Lett., 38 (1977) 1313. - [138] ZEUS Collaboration: Derrick M. et al., Phys. Lett., B 349 (1995) 225.
- [139] H1 Collaboration: Aid S. et al., Nucl. Phys., B 472 (1996) 32.
- [140] Martin A.D., Roberts R.G. and Stirling W.J., Phys. Rev., D 50 (1994) 6734.
- [141] ZEUS Collaboration: Breitweg J. et al., DESY 97-026 (1997).
-
[142]
OPAL Collaboration: Akers R. et al., Z. Phys., C 67 (1995) 27;
ALEPH, DELPHI, L3 and OPAL Collaborations, Nucl. Instr. Meth., A 378 (1996) 101. - [143] Kniehl B.A., Kramer M., Kramer G. and Spira M., Phys. Lett., B 356 (1995) 539.
- [144] Kniehl B.A., Kramer G. and Spira M., DESY 96-210 (1996).
- [145] Cacciari M. and Greco M., Z. Phys., C 69 (1996) 459.
- [146] Peterson C., Schlatter D., Schmitt I. and Zerwas P.M., Phys. Rev., D 27 (1983) 105.
- [147] Chrin J., Z. Phys., C 36 (1987) 163.
- [148] Cacciari M. and Greco M., Phys. Rev., D 55 (1997) 7134.
-
[149]
Berger E.L. and Jones D., Phys. Rev, D 23 (1981) 1521;
Baier R. and Rückl R., Nucl. Phys., B 201 (1982) 1. -
[150]
EMC Collaboration: Aubert J.J. et al., Nucl. Phys., B 213
(1983) 1;
EMC Collaboration: Ashman J. et al., Z. Phys., C 56 (1992) 21;
NMC Collaboration: Allasia D. et al., Phys. Lett., B 258 (1991) 493. - [151] Krämer M., Zunft J., Steegborn J. and Zerwas P.M., Phys. Lett., B 348 (1995) 657.
- [152] Krämer M., Nucl. Phys., B 459 (1996) 3.
- [153] Jung H., Schuler G.A. and Terron J., Int. Journ. Mod. Phys., A 32 (1992) 7955.
-
[154]
CDF Collaboration, in High energy physics (Glasgow, Scotland,
1994), edited by P.J. Bussey and I.G. Knowles, 1995 (and
FERMILAB-CONF-94-136-E);
CDF Collaboration, in procs. of the 17th International Symposium on Lepton-Photon interactions (Beijing, P.R. China, 1995), edited by Zhi-Peng Zheng and He-Sheng Chen (World Scientific) 1996 (and FERMILAB-CONF-95-226-E);
D0 Collaboration: Abachi S. et al., Phys. Lett., B 370 (1996) 239. - [155] Bodwin G.T., Braaten E. and Lepage G.P., Phys. Rev., D 51 (1995) 1125.
- [156] Cacciari M. and Krämer M., Phys. Rev. Lett., 76 (1996) 4128.
- [157] Amundson J., Fleming S., Maksymyk I., UTTG-10-95, MADPH-95-914 (1996).
-
[158]
ZEUS Collaboration: Derrick M. et al., Phys. Lett., B 315
(1993) 481; Phys. Lett., B 332 (1994) 228;
H1 Collaboration: Ahmed T. et al., Nucl. Phys., B 429 (1994) 477. - [159] ZEUS Collaboration: Derrick M. et al., Z. Phys., C 68 (1995) 569.
- [160] H1 Collaboration: H1 Collaboration: Ahmed T., Phys. Lett., B 348 (1995) 681.
- [161] ZEUS Collaboration: Derrick M. et al., Z. Phys., C 70 (1996) 391.
-
[162]
H1 Collaboration: Ahmed T. et al., Nucl. Phys., B 435 (1995)
3;
ZEUS Collaboration: Derrick M. et al., Phys. Lett., B 346 (1995) 399. -
[163]
Low F.E., Phys. Rev., D 12 (1975) 163;
Nussinov S., Phys. Rev. Lett., 34 (1975) 1286. - [164] Ingelman G. and Schlein P.E., Phys. Lett., B 152 (1985) 256.
- [165] R608 Collaboration: Smith A.M. et al., Phys. Lett., B 163 (1985) 267; B 167 (1986) 248; Henkes T. et al., Phys. Lett., B 283 (1992) 155.
- [166] UA8 Collaboration: Bonino R. et al., Phys. Lett., B 211 (1988) 239; Brandt A. et al., Phys. Lett., B297 (1992) 417.
- [167] Donnachie A. and Landshoff P.V., Nucl. Phys., B 303 (1988) 634; Phys. Lett., B 285 (1992) 172.
- [168] ZEUS Collaboration: Derrick M. et al., Phys. Lett., B 356 (1995) 129.
- [169] Bruni P. and Ingelman G., Proc. of the International Europhysics Conference, edited by J. Carr and M. Perrotet, Marseille, France, July 1993 (Ed. Frontieres, Gif-sur-Yvette, 1994, p. 595).
-
[170]
Genovese M., Nikolaev N.N. and Zakharov B.G., Phys. Lett.,
B 378 (1996) 347;
Levin E.M., Martin A.D., Ryskin M.G., Teubner T., DTP-96-50 (1996);
Buchmüller W., McDermott M.F. and Hebecker A., DESY-97-035 (1997). - [171] Jung H., Comp. Phys. Comm., 86 (1995) 147.
- [172] Bjorken J.D., Phys. Rev., D 47 (1992) 101.
- [173] Mueller A.H. and Tang W.-K., Phys. Lett., B 284 (1992) 123.
- [174] Del Duca V. and Tang W.-K., Phys. Lett., B 312 (1993) 225.
-
[175]
Gotsman E., Levin E.M. and Maor U., Phys. Lett., B 309 (1993)
199;
Fletcher R.S. and Stelzer T., Phys. Rev, D 48 (1993) 5162. - [176] D0 Collaboration: Abachi S. et al., Phys. Rev. Lett., 72 (1994) 2332; Phys. Rev. Lett., 76 (1996) 734.
- [177] CDF Collaboration: Abe F. et al., Phys. Rev. Lett., 74 (1995) 855.
- [178] ZEUS Collaboration, Derrick M. et al., Phys. Lett., B 369 (1996) 55.
- [179] Sjöstrand T., Storrow J.K. and Vogt A., J. Phys., G 22 (1996) 893.
- [180] Nozaki T., in Spin structure of the nucleon, (Wako, Japan, 1995), edited by T.A. Shibata, S. Ohta, N. Saito (World Scientific) 1996, pp. 98-101.
- [181] Duke D.W. and Owens J.F., Phys. Rev., D 26 (1982) 1600.
-
[182]
Allaby J.V. et al., Fourth International Conference on High
Energy Collisions, Oxford (April 1972);
Anderson E.W. et al., Phys. Rev. Lett., 19 (1967) 198;
Akerlof C.W. et al., Phys. Rev., D 3 (1971) 645. - [183] Capiluppi P. et al., Nucl. Phys., B 70 (1974) 1.
- [184] Martin A.D., Roberts R.G. and Stirling W.J., Phys. Rev., D 47 (1993) 867.
- [185] Martin A.D., Roberts R.G. and Stirling W.J., Phys. Lett., B 306 (1993) 145; (erratum) B 309 (1993) 492.
- [186] Lai H.L. et al., Phys. Rev., D 51 (1995) 4763.
- [187] Lai H.L. et al., Phys. Rev., D 55 (1997) 1280.
| process | cross section (b) | full error (b) | ||||||||
|---|---|---|---|---|---|---|---|---|---|---|
| , DD | 20 20 (assumed) | — | ||||||||
| , GD | 23.4 | 2.6 | 4.3 | 10.2 | 11.3 | |||||
| , PD | 8.7 | 1.5 | 1.5 | 3.0 | 3.6 | |||||
| , EL | 17.1 | 1.6 | 3.7 | 1.4 | 4.3 | |||||
| EL + GD + PD + DD | 69.2 | 3.4 | 8.8 | 9.3 | 13.2 | |||||
| ND | 96.1 | 3.5 | 14.7 | 9.6 | 17.9 | |||||
| Total | 165.3 | 2.3 | 10.9 | 1.3 | 11.2 | |||||
| Cross Sections (b) | ||||
|---|---|---|---|---|
| Reaction | Data | CKMT | SaS | GLM |
| , EL | 17 | 16 | 17 | |
| , GD | 25 | 13 | 18 | |
| , PD | 7 | 10 | 15 | |
| , DD | 15 | 13 | 15 | |
|
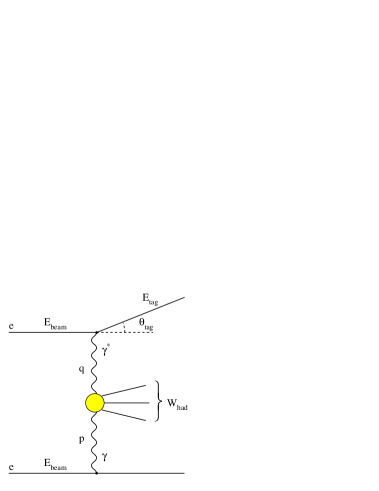


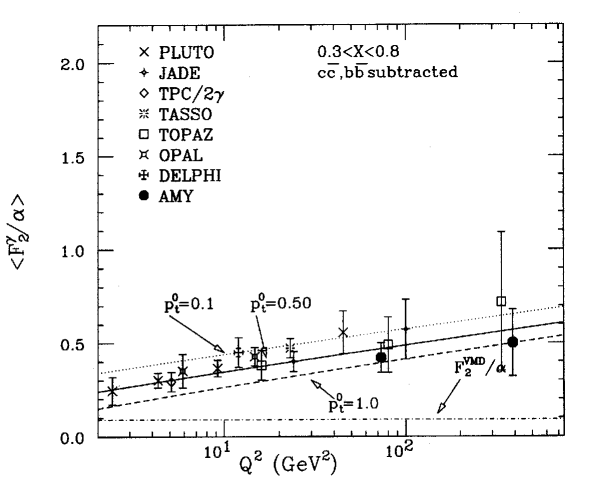


.