1 Introduction
The electron-positron collider LEP at CERN has delivered several million hadronic Z decays to each of the four experiments. This large data sample allows for precision studies of the Standard Model of electroweak and strong interactions. In particular it is now possible to perform precision tests of perturbative Quantum Chromodynamics (QCD), the theory of strong interactions of quarks and gluons. This arises from the fact that at the high energies at LEP () the strong coupling constant is not too large owing to the property of asymptotic freedom, thus making perturbative calculations reliable and hadronization effects less important. Altogether this allows for the observation of hadronic jets, whose energies and directions are in close correspondence with those of the partons (quarks and gluons), which are not directly observable.

QCD is a gauge theory with SU(3) as underlying gauge group. For a general gauge theory with a simple Lie group, the couplings of the fermion fields to the gauge fields and the self-interactions in the non-abelian case are determined by the coupling constant and the Casimir operators of the gauge group. Measuring the eigenvalues of these operators, called colour factors, probes the underlying structure of the theory in a gauge invariant way. Considering the case where and are the dimensions of the fundamental and adjoint representations of the gauge group with structure constants and generators , the following relations hold :
| (1) |
where represent gauge (fermion) field indices and , and are the colour factors. For SU() one finds
| (2) |
For QCD , hence and . The relations between Feynman vertices and colour factors are illustrated in Fig. 1. In general a cross section for has the structure
| (3) |
and thus it also depends on the number of active flavours . This number could be altered from its LEP 1 expectation of five by new physics, such as the existence of a very light gluino [1].
2 Test Variables
Basically two different kind of observables have been used in order to extract information on the colour factors. They differ in the order at which their perturbative prediction starts.
2.1 First Order Variables
First order variables are quantities for which the perturbative prediction starts at . Examples are event-shape distributions such as thrust, jet masses, jet broadenings or the differential two-jet rate. For a general event-shape distribution , which vanishes in the limit of perfect two-jet topologies, the differential cross section can be written as [2] :
| (4) |
Here is the total hadronic cross section, and the redefinition of the running coupling constant has been adopted. With this definition the leading coefficient of the QCD beta-function is .
The coefficient functions and are obtained by integrating the fully differential matrix elements [2]. Whereas is colour factor independent, can be decomposed into [2, 3]
| (5) |
From this it becomes clear that information on colour factors enters only in next-to-leading order via the coefficient function . However, additional dependence at and higher orders enters through the running coupling, mainly via , if the renormalization scale is chosen to be different from the hard scale .
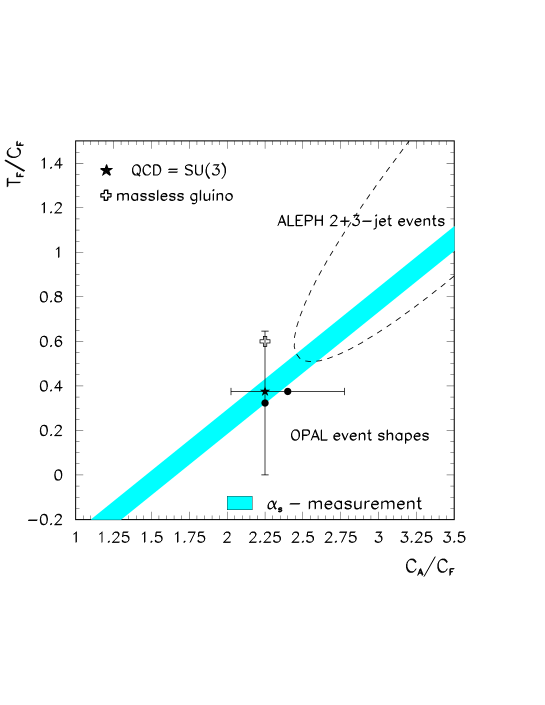
For several event-shape variables it is possible to resum the leading and next-to-leading logarithms in all orders of ([4] and references therein). In those cases a function is added to the expression in Eq. (4), where , therefore enters again in connection with the leading terms, which introduces a high correlation between the estimates of and . Summarizing it can be stated that first order variables are suited for measuring and a function of and , namely . This is shown schematically in Fig. 2, where a confidence region in the colour factor plane is shown for determinations from event shapes.
OPAL has used resummation calculations for event shapes to measure and one of the colour factors at a time [5], setting the others to the QCD expectations. The results are shown in Fig. 2, together with an ALEPH measurement [6] where a second-order calculation for the differential three-jet cross section has been used. As they extracted additional information from the two-jet rate, it was possible to measure simultaneously and both colour factor ratios. However, the systematic errors are large, mainly owing to the large renormalization scale uncertainty when using only second-order calculations.

2.2 Second Order Variables
Information on the colour factors can also be obtained from second order variables, for which the perturbative expansion starts only at , like thrust-minor, light jet mass or angular variables in four-jet events. Here the cross section is given by
| (6) |
with coefficient functions () again found by integration of the matrix elements. Such variables have the advantage that colour factor information already enters in leading order, but normally they are not used to measure , as only Born level calculations were available until recently. Hence in the case of four-jet angular variables only the shapes of distributions were fitted. First results of a next-to-leading order calculation [7] indicate that these shapes remain almost unchanged under inclusion of higher orders, although, the four-jet rate is changed. Like in the case of first order variables, a light gluino would alter the cross section.
Four-jet angular distributions [8] have proven to be very sensitive to the colour factors. First, four-jet events are found according to a given clustering prescription and resolution criterion. If the primary quarks are tagged via energy ordering (), the following variables can then be computed ( being the jet momenta) :
-
•
the Bengtsson-Zerwas angle :
-
•
the Körner-Schierholz-Willrodt angle :
-
•
the (modified) Nachtmann-Reiter angle :
-
•
the angle between the two lowest energetic jets :
DELPHI [9] has performed a least-squares fit of Eq. (6) to the two-dimensional distribution in the variables and in order to find estimates of the colour factor ratios. A similar technique was applied by OPAL, there, however, a three-dimensional distribution was measured by using also the angle . Recently it has been shown by DELPHI [10] that the sensitivity of these angular distributions to the colour factors can be further improved by tagging two of the four jets as originating from b- or c-quarks, using lepton and lifetime information. This method gives an efficiency of about to tag both primary jets correctly and a purity of , whereas with energy ordering only in of all events do the two most energetic jets originate from the primary quarks.

ALEPH [11] has tried a different approach which is based on a maximum likelihood fit of selected four-jet events to the theoretical prediction for the five-fold differential four-jet cross section.
The results of the measurements mentioned above are summarized in Fig. 3. Most of them were statistically limited. The systematic errors are typically dominated by hadronization uncertainties and systematic effects related to two- and three-jet background.
OPAL has made a first attempt to study angular correlations in five-jet events [12] in order to determine the fraction of the cross section proportional to , which is the colour class that contains the quartic gluon vertex diagrams and enters only at . The results are summarized in Fig. 4. Consistency with the expectation from QCD is found, however, the errors are large.
3 Combination of First and Second Order Variables
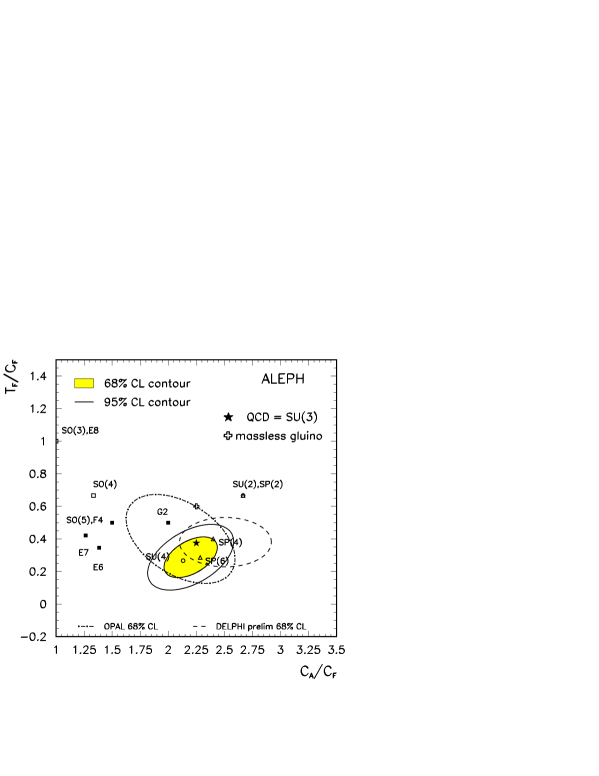
Recently ALEPH has presented a simultaneous measurement of the strong coupling constant and the colour factors [13]. The idea of this analysis is to combine information on these parameters obtained both from first and second order variables. As first order variable the distribution in has been employed, where is the minimum distance scale , computed according to the Durham prescription [14, 15], after clustering an event to three jets. This variable is also called differential two-jet rate, and the resummation of leading and next-to-leading logarithms is available for it [14, 16]. As second order variables, all four angular distributions defined in Section 2.2 have been used, with jets ordered in energy. In total, 2.7 million hadronic events have been analyzed, giving a large sample of about 170000 four-jet events. A least-squares fit has been performed simultaneously to all five one-dimensional distributions by taking into account the correlations. The fit parameters were , and . From an analysis of mass effects on the four-jet variables it is concluded that the effective number of flavours is , which is then used to extract the final results for the colour factor ratios,
These represent the most precise measurements to date. The systematic uncertainties include contributions from renormalization scale and matching ambiguity (matching of fixed order and resummation calculation), from hadronization effects and biases introduced via the detector simulation, and finally from the estimation of mass effects. The result is illustrated in Fig. 5 and compared to the best measurements by OPAL and DELPHI.
From Fig. 5 it becomes already clear that the light gluino hypothesis is not favoured by the colour factor measurements. A further test of this hypothesis is obtained by fixing the colour factors to their SU(3) values, thus assuming QCD to be the correct gauge theory of strong interactions, and instead extracting and from a fit to the differential two-jet rate and angular distributions. The results are and . The measurement of is in agreement with the world average of [17], and the result for is consistent with the expectation of five. At leading order a massless gluino would lead to an excess above five of three units. However, mass effects can lower this excess. From their measurement, ALEPH computes an upper limit on the excess of at CL, from which they deduce a lower limit on the gluino mass of . Similar conclusions are drawn by the analyses of the running of of Refs. [18] and [19]. There the measurements of and are used in order to measure at different scales and thus to test the running coupling, which is a function of the colour factor ratios and the number of active flavours, as shown in Section 1.
4 Conclusions
Measurements of the QCD colour factors have been performed by the LEP experiments, based on a variety of approaches. Consistency with the expectations from QCD with SU(3) as gauge group has been found in all cases. The existence of a very light gluino is ruled out, which however has yet to be confirmed by direct searches.
5 Acknowledgements
I would like to thank J. Fuster, A. Seitz, S. Bentvelsen and S. Kluth for providing me with relevant information for the preparation of this talk.
References
- [1] G. Farrar, Phys. Rev. D51 (1995) 3904.
- [2] R.K. Ellis, D.A. Ross, and A.E. Terrano, Nucl. Phys. B178 (1981) 421.
- [3] N. Magnoli, P. Nason, and R. Rattazzi, Phys. Lett. B252 (1990) 271.
- [4] S. Catani, L. Trentadue, G. Turnock, and B.R. Webber, Nucl. Phys. B407 (1993) 3.
- [5] R. Akers et al., OPAL Collaboration, Z. Phys. C68 (1995) 519.
- [6] R. Barate et al., ALEPH Collaboration, CERN-PPE/96-186, 1996.
- [7] A. Signer and L. Dixon, hep-ph/9609460, 1996; private communication, 1997.
- [8] S. Bethke, A. Richter and P.M. Zerwas, Z. Phys. C49 (1991) 59.
- [9] P. Abreu et al., DELPHI Collaboration, Phys. Lett. B255 (1991) 466; Z. Phys. C59 (1993) 357; ICHEP94 Ref. gls0180, 1994.
- [10] DELPHI Collaboration A. Seitz, ICHEP96 Ref. pa01-020, 1996.
- [11] D. Decamp et al., ALEPH Collaboration, Phys. Lett. B284 (1992) 151.
- [12] OPAL Collaboration, OPAL Physics Note PN-188, July 1995.
- [13] R. Barate et al., ALEPH Collaboration, CERN-PPE/97-002, 1997.
- [14] S. Catani, Y.L. Dokshitzer, M. Olsson, G. Turnock, and B.R. Webber, Phys. Lett. B269 (1991) 432.
- [15] N. Brown and W.J. Stirling, Z. Phys. C53 (1992) 629.
- [16] G. Dissertori and M. Schmelling, Phys. Lett. B361 (1995) 167.
- [17] M. Schmelling, hep-ex/9701002, 1996.
- [18] M. Schmelling and R. St.Denis, Phys. Lett. B329 (1994), 393.
- [19] F. Csikor and Z. Fodor, CERN-TH/96-323, 1996.