hep-ex/9703014
March, 1997
DEEP INELASTIC SCATTERING FROM UNPOLARISED TARGETS
In this paper the experimental status of unpolarised structure functions is reviewed. In particular the latest results from the NMC, E665, CCFR, and HERA experiments are discussed. Emphasis is put on the fixed-target experiments, which cover with high precision the region relevant for the present polarised DIS experiments.
Invited Talk at the
International School of Nucleon Structure
1st Course: The Spin Structure of the Nucleon
Erice, Italy, 3–10 August 1995
DEEP INELASTIC SCATTERING FROM UNPOLARISED TARGETS
G. K. MALLOT
In this paper the experimental status of unpolarised structure functions is reviewed. In particular the latest results from the NMC, E665, CCFR, and HERA experiments are discussed. Emphasis is put on the fixed-target experiments, which cover with high precision the region relevant for the present polarised DIS experiments.
1 Introduction
Deep inelastic scattering (DIS) of charged and neutral leptons has revealed most of what we know about the quark structure of the nucleon and of nuclei. The interpretation of DIS data is based on the factorisation of the hard scattering process from the nonperturbative nucleon structure. The former is described by Quantum Chromodynamics (QCD) while the latter is parametrised in terms of structure functions. Thus the objectives of DIS experiments are twofold. They test QCD and probe the nucleon’s structure at the same time. DIS experiments led to the discovery of partons, which later were identified with the hypothetical quarks, postulated earlier to explain the hadron spectrum. It was also found that the charged partons are fermions with spin 1/2 and carry only about half of the nucleon’s momentum. This suggests that gluons play an important rôle in the nucleon. The same partition was recently predicted for the angular momentum in the limit of infinite momentum transfer, . With the advent of the high statistics experiments at large , the gluon distribution could be inferred from the dependence of the structure functions using the Gribov–Lipatov–Altarelli–Parisi evolution equations (GLAP) . Important input for the flavour decomposition of the quark content of the nucleon came from charged-current neutrino scattering. It was shown that the nucleon contains three valence quarks and that the mean-square charge of the up and down quarks is 5/18. From opposite-sign di-muon events the distribution of the strange quarks was obtained.
Although a consistent picture emerged and DIS developed to a precise tool, its history is accompanied by surprises. First strong effects due to nuclear binding were discovered by the European Muon Collaboration, the so-called EMC-Effect. Later the violation of the Ellis–Jaffe sum rule, discovered by the EMC in polarised muon-proton scattering, questioned our understanding of the nucleon’s spin structure. Then the violation of the Gottfried sum rule found by the New Muon Collaboration (NMC) revealed that the light quark sea is not flavour symmetric. Recently, a strong increase of at very small was found at HERA and finally, the excess of events at high and also seen at HERA might be a trace of “new physics”.

The DIS process is sketched in Fig. 2. The kinematics in the laboratory frame for fixed-target experiments is given by the incoming lepton energy, , the energy transfer, , the square of the virtual-photon mass, , and the proton mass, . In Born approximation the inclusive, differential cross section in terms of the scaling variables, and , reads
| (1) |
where are the dimensionless structure functions and is the square of the lepton-nucleon c.m. energy. The coupling constants and the boson propagators yield,
| (2) |
for charged-lepton () and charged-current neutrino scattering (), respectively. The parity-violating structure function enters with positive (negative) sign for (anti)neutrino scattering and vanishes for electron and muon scattering. Neutral-current neutrino scattering and charged-current electron (muon) scattering are not discussed in this paper.
In the Quark-Parton-Model (QPM), which is motivated in the Bjorken limit, at fixed , the scaling variable represents the fraction of the nucleon’s longitudinal momentum carried by the struck quark. The structure functions become functions of only and acquire a very intuitive interpretation in terms of quark and antiquark distribution functions, and with . One finds the Callan–Gross relation , , and
| (3) | |||||
where denotes the electric charge of a quark with flavour . In Eq. 1 neutrino scattering from isoscalar targets is assumed and in addition and is used in the expressions for and . In the QCD-improved QPM a logarithmic dependence of the structure functions is generated by gluon bremsstrahlung. This dependence can be calculated in QCD and is described by the GLAP equations. It is one of the cleanest tools to determine the gluon distribution function of the nucleon, , and the strong coupling constant .
In this paper emphasis is put on the results relevant to the analysis of the polarised DIS data, i.e. the region and the main part of the paper is dedicated to fixed-target experiments. However, the most important results from HERA are also reviewed. The results from the Zeus experiment at HERA are discussed in more detail in a separate contribution to this Workshop. Due to the lack of space a discussion of nuclear effects in structure functions has been omitted.
2 The Experiments
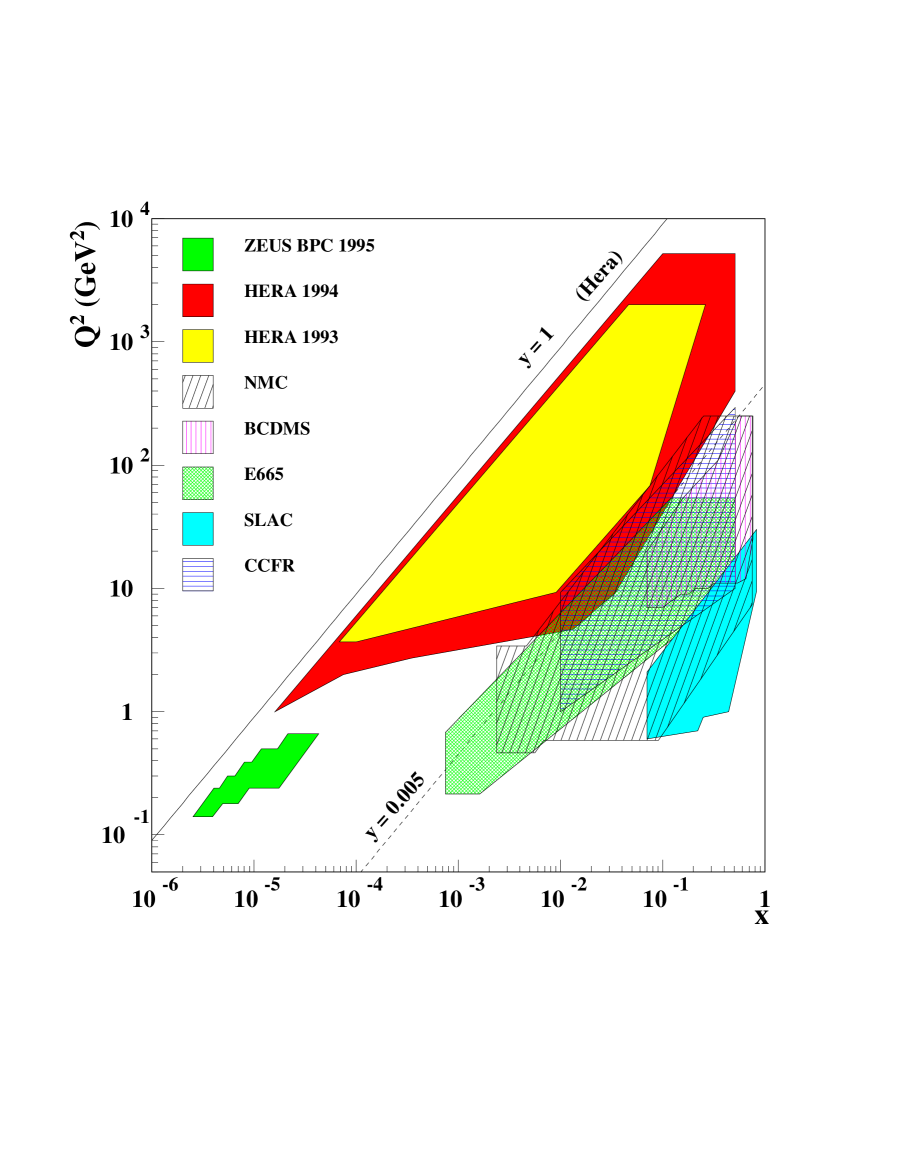
The series of unpolarised electron DIS experiments at SLAC began in the late 1960’s and lasted till 1985 and beyond. The scattered electrons were detected by 1.6, 8, and 20 GeV/ small-aperture magnetic spectrometers. The maximum incident electron energy was 20 GeV covering the kinematic range .
In the 1980’s the high-intensity 280 GeV CERN muon beam served simultaneously the experiment of the BCDMS and that of the European Muon Collaboration (EMC). The momentum of the incident muon was measured by a dedicated common magnetic spectrometer. The EMC apparatus comprised an extended target area with an about 5 m long liquid hydrogen or deuterium target, a large-aperture spectrometer magnet and a muon-identification stage downstream of a hadron absorber. Subsequently upgraded versions of this spectrometer were used by the New Muon (NMC) and by the Spin Muon Collaboration (SMC). The NMC experiments were optimised for the determination of cross-section ratios. A group of two targets along the beam axis was frequently exchanged with a second group of targets, in which the order of the target materials along the beam was inverted. This yielded very precise results for and for nuclear effects in the structure functions. The BCDMS experiment consisted of a series of segmented toroids interspersed with MWPCs and trigger hodoscopes. The central bore contained the in total 40 m long targets. The muons were bent by the magnetic field in the iron toroids towards the axis of the spectrometer. This setup resulted in a good acceptance for large scattering angles, i.e. for large values of and . The to date last unpolarised muon DIS experiment was performed by the E665 Collaboration using the 470 GeV muon beam at FNAL. The principle of the spectrometer is similar to that of the EMC. However, it involved an additional spectrometer magnet close to the target.
In the early 1980’s also charged-current neutrino–nucleon scattering experiments started at CERN with the CDHSW experiment. The most precise data today come from the CCFR Collaboration at FNAL, which took data in the late 1980’s. Neutrinos and antineutrinos of 30–600 GeV from kaon and pion decays impinged on a 690 ton iron target and the emerging muons were detected in a 420 ton toroid system. Apart from and results for the Gross-Llewellyn Smith sum rule and the strange quark content of the nucleon were obtained.
Finally, in the 1990’s the HERA e-p collider at DESY with its H1 and ZEUS experiments opened up a completely new kinematic domain. The 820 GeV proton and the 27 GeV electron beam provide a centre-of-mass energy of GeV with which values as low as can be reached at a momentum transfer of and for values of can be accessed. The kinematic range of the individual experiments is shown in Fig. 2.
3 The Longitudinal-to-Transverse Cross-Section Ratio
Both, longitudinally and transversely polarised photons contribute to the differential cross section of Eq. 1. The ratio of the corresponding cross sections, and , is given by
| (4) |
It can determined from measurements at the same (, ) point at different values of , i.e. different incident lepton energies. Transverse quark momenta introduced by gluon bremsstrahlung allow also the absorption of longitudinal virtual photons. Due to the absence of transverse momenta, vanishes in the naïve QPM. In perturbative QCD and thus () can be calculated from and from the gluon distribution function, ,
| (5) |
where for electron and muon scattering and , the number of active flavours, for neutrino scattering. Note that is proportional to the strong coupling constant . At small values of , where rises sharply, an increase of is expected from Eq. 5.


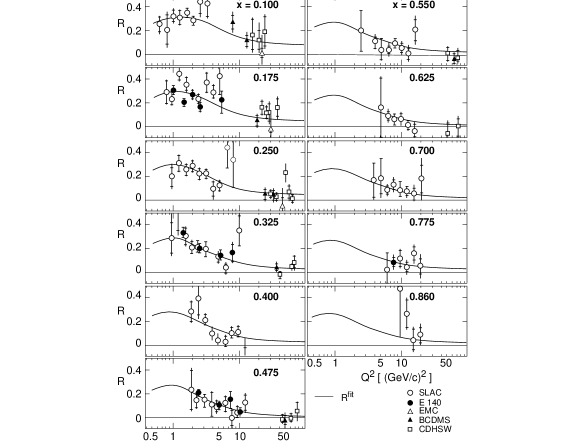
The result of a comprehensive global analysis of the the SLAC electron-proton and deuteron data on and some high muon and neutrino data from CERN resulted in a phenomenological parametrisation for , often referred to as R1990, which is shown together with the data in Fig. 3. The kinematic region covered is and GeV2 for the SLAC data and up to about 80 GeV2 for the muon and neutrino data. The ratio is rather well determined for intermediate and large , where it is small. However, the behaviour in the region is uncertain. Recently, new data from the NMC in the small- region, , became available (Fig. 4). The data agree well with the rise expected from perturbative QCD and – in the region of overlap – with the previous measurements. Also the preliminary neutrino data for from the CCFR Collaboration for and agree well with (not shown here). The comparison of the neutrino data taken with an iron target and the charged-lepton data shows no evidence for a dependence of on the target material. Similar conclusions were previously reached from muon and electron experiments using a series of nuclear targets.
A measurement of at very small is presently being considered at HERA using lower beam energies. First results were obtained from the 1994 H1 data using a different approach. Equation 1 can be rewritten in terms of and yielding a differential cross section proportional to . Thus at small the cross section is dominated by , while and contribute with similar weight at large . The longitudinal structure function was determined from the data with by subtracting the contribution, which was obtained from data with . Since both data sets were taken using same beam energies, the data had to be evolved from the measured to the value corresponding to the higher value of using next-to-leading order GLAP evolution. In this sense was not directly measured but inferred from data taken at different points. The result, at and , corresponds to and agrees well with expectations.


4 Structure Function Data
4.1 Muon and Electron Fixed-Target Data
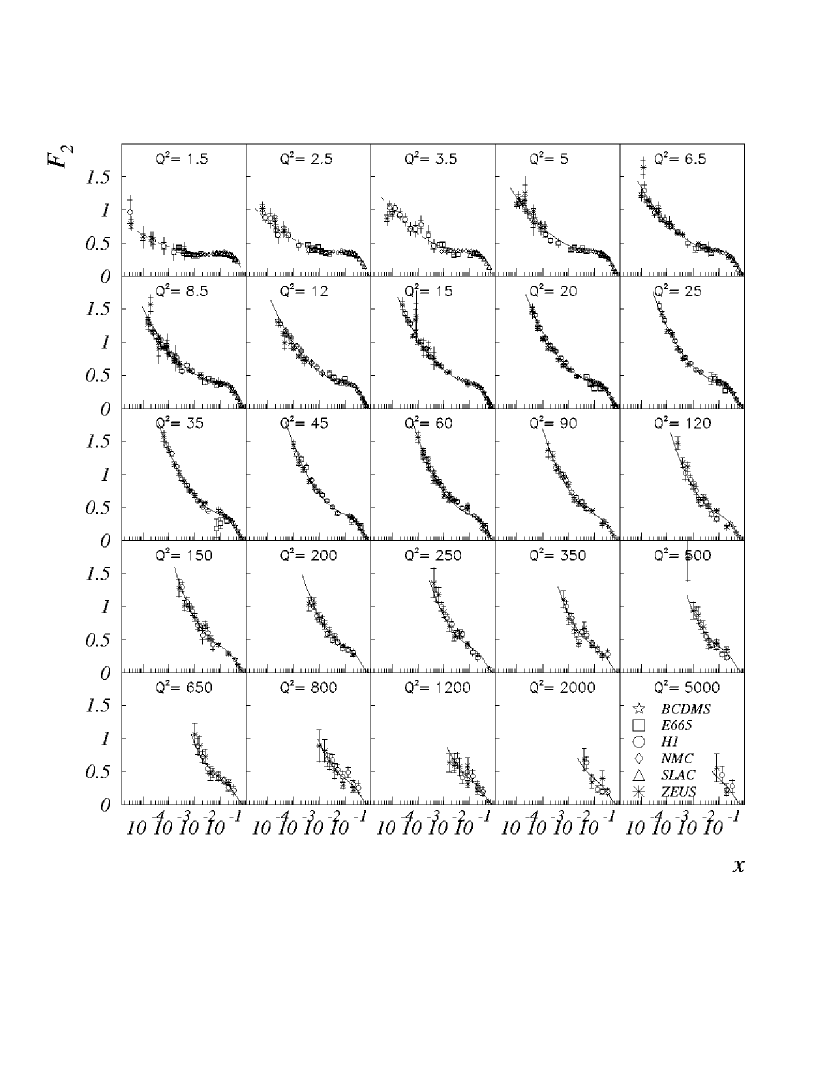
The present status of the deuteron measurements from charged-lepton fixed-target experiments is summarised in Figs. 6 and 6. The proton data are in accuracy and kinematic coverage similar to the deuteron results. The data from SLAC, the NMC, and the BCDMS collaboration are in excellent agreement. They exhibit strong scaling violations, which are positive at small and negative at large . The EMC data deviate systematically from the BCDMS and NMC data at small . This discrepancy remained also after a re-analysis of the EMC data, which therefore were not included in this compilation. At large and the data are dominated by the results from the BCDMS while the small and region is the domain of the SLAC data. The final analysis of the NMC data comprises all the data taken with 90, 120, 200, and 280 GeV muon beams. The NMC data provide the link between the SLAC and BCDMS data and extend the measured region by more than an order of magnitude from down to . A useful phenomenological parametrisation to the NMC, BCDMS, and SLAC data is given in Ref. [?]. A comparison of the NMC data with the E665 data for the proton and the deuteron in the range is shown in Fig. 6. The E665 data extent over five more small- bins not shown here down to where the average is about 0.4 GeV2. A comparison of the HERA data from H1 and Zeus to the NMC data, which are considerably more accurate, is shown in Fig. 7. The HERA data are in fair agreement with the extrapolation of the NMC data to larger values of .


4.2 The ratio and the Gottfried sum rule
Recent measurements of the structure function ratio come from the NMC and the E665 Collaboration (Fig. 8). The neutron-to-proton structure function ratio is obtained from experiments with liquid hydrogen and deuterium targets. Neglecting nuclear effects in the deuteron the ratio is given by
| (6) |
The latter step in Eq. 6 is justified by several measurements finding the difference to be compatible with zero in the range . This puts via Eq. 5 a limit on a possible difference of the gluon distributions in the proton and the deuteron. The ratio is found to be largely independent of . Small negative slopes, , were observed in the range in agreement with predictions from perturbative QCD. The ratio approaches unity for as expected in this region where the sea quarks dominate. The small deviation from unity is in the order of 0.02, which is a typical value expected for shadowing corrections in the deuteron. At very small the E665 data indicate a drop below 0.9. Note however, that is as small as 30 MeV2 for , what makes the data difficult to interpret.
The NMC used the ratio together with to test the Gottfried sum rule
| (7) |
If the last term vanishes the Gottfried sum rule takes its original form, . The NMC finds at significantly below 1/3. From Eq. 7 it is obvious that this result can be interpreted as a flavour-asymmetric sea yielding . This explanation is supported by the CERN experiment NA51, in which the cross-section asymmetry for Drell-Yan production of muon pairs was measured using proton and deuteron targets. From the asymmetry a value of at was inferred. Both, the NMC and NA51 experiment, find a larger down than up-quark component in the proton’s quark sea.
4.3 Data from Neutrino Experiments
The nucleon’s structure functions, , measured in charged-lepton and neutrino experiments are related by (see Eq. 1)
| (8) |
where is the mean square charge of the up and down quarks. An analysis using the BCDMS and CCFR data yields . Neutrino data are taken with heavy nuclear targets and must be corrected for both, nuclear effects and non-isoscalarity, before being compared to deuteron data from charged-lepton experiments. These corrections are assumed to be equal to those in charged-lepton scattering where they are well measured. In addition to the parity-violating, nonsinglet structure function , which measures the difference of quark and antiquark contributions, can be studied in neutrino and antineutrino scattering.
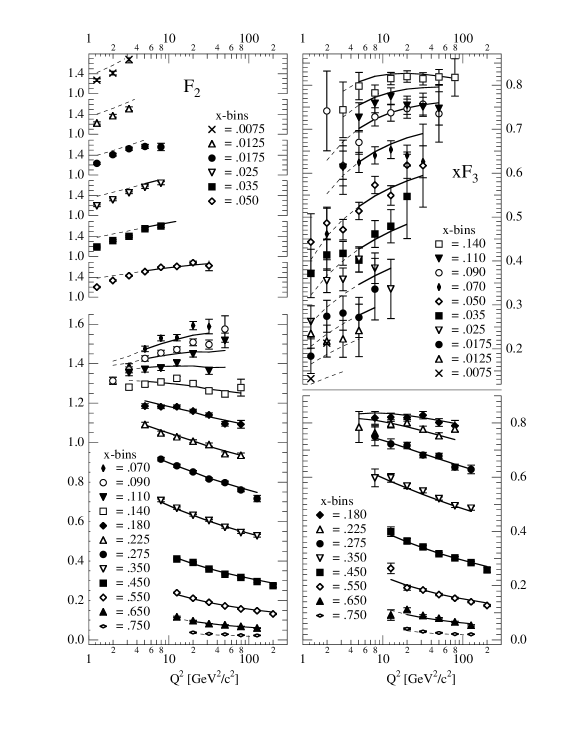
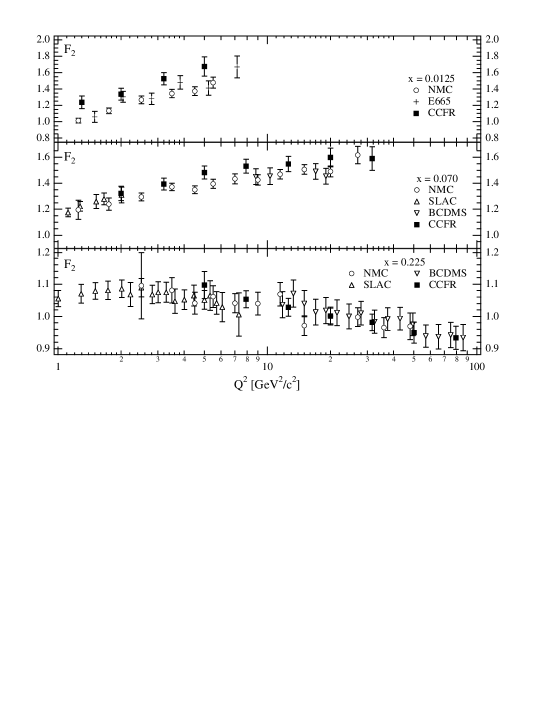
The most precise data for deep-inelastic neutrino scattering come from the CCFR Collaboration at FNAL. The complete and data sets are shown in Fig. 9. For good agreement of the corrected CCFR iron data with the NMC and BCDMS deuteron data is found. However, in the small region, , the neutrino data are up to 20 % larger (Fig. 10). In the first bins this discrepancy, which decreases systematically with increasing , is outside the statistical and systematic errors. In this region the strange sea contribution may become important. The strange-quark content of the nucleon was determined directly from neutrino-induced charm production, , and analysed in terms of the parameter
| (9) |
In a next-to-leading order analysis a value of was found establishing a suppression of the strange sea. The shape of the strange quark distribution function, , is compatible with that of the light antiquarks. A possible difference between the strange and antistrange distribution functions, , which is expected for an intrinsic strangeness component in the nucleon, is beyond the precision of the present data. A fit allowing different shapes for and , with , yielded . The strangeness content found in this measurement is not sufficient to explain the discrepancy between the charged-lepton and neutrino data at . Possible other sources for the discrepancy are discussed in Refs. [?, ?, ?]
5 QCD analyses and determination of
Perturbative QCD predicts the evolution of the flavour singlet, , and nonsinglet, , quark distribution functions and of the gluon distribution function, . The quark singlet combination evolves coupled to the gluons while quark nonsinglet combinations evolve independently. Typical nonsinglet combinations are the difference of quarks and antiquarks, , and the difference of up and down quarks, , while is almost a pure singlet combination. Apart from a test of QCD the aim of QCD analyses of the structure function data is the determination of the parton distribution functions and of the strong coupling constant, . The parton distribution functions are parametrised at a starting scale and are then evolved to the of the data points according to the GLAP equations.
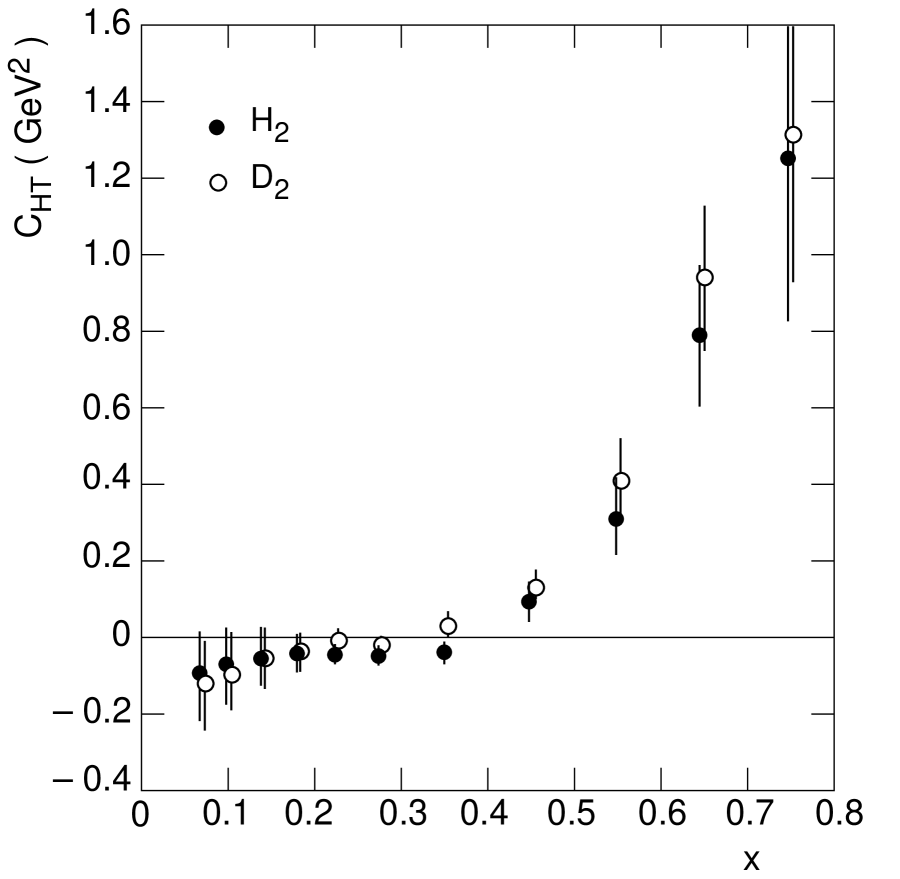
For the BCDMS/SLAC, the NMC, and the CCFR data next-to-leading order QCD analyses were carried out by the experimental groups. In the BCDMS and NMC analyses the proton and deuteron data were fitted simultaneously. The data included in the BCDMS fit cover with in the range 0.5–260 GeV2. In addition to the leading-twist contribution and target-mass corrections, combined in , higher-twist corrections had to be included to describe the data. They were parametrised in the form
| (10) |
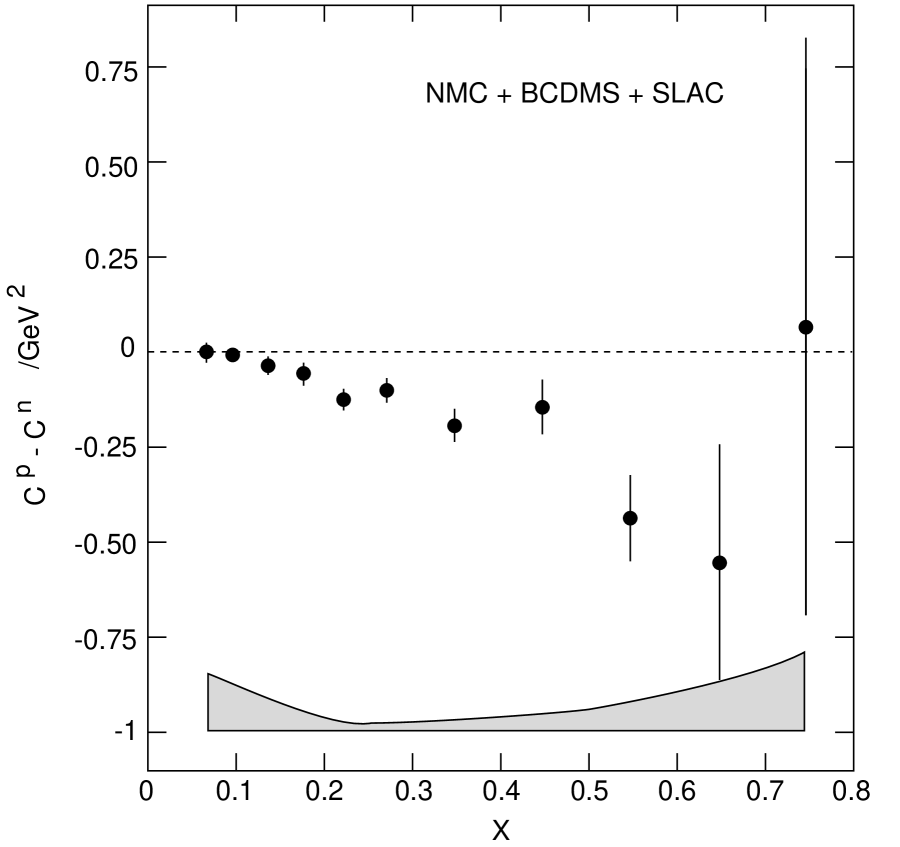
where is the higher-twist coefficient for the th bin. The fitted coefficients for the proton, , and for the deuteron, , are shown in Fig. 12. A calculation of these coefficients using infrared renormalons is in good agreement with the experimental results. The differences of the proton and neutron coefficients, were studied with higher precision in a combined analysis of data from the NMC, BCDMS, and SLAC experiments (Fig. 12).


The higher-twist coefficients from the BCDMS analysis were used in the next-to-leading order QCD analysis of the NMC data with . This analysis was the first to focus on the small region, , where the gluon contribution dominates. This is demonstrated in Fig. 14, where the total QCD evolution and that due to quarks as obtained from the QCD fit is shown separately. At the gluon distribution function was determined with a precision of 20 % (Fig. 14). The total momentum fraction carried by quarks and gluons in the region covered by the data amounts to 0.95 and the quarks carry a momentum fraction of at .
In the QCD analysis of the CCFR and structure functions, data with or a hadronic final-state energy of were excluded. This largely removed the small- region, where the charged-lepton and the neutrino data differ. The fit is shown as solid line in Fig. 9. The value obtained for the strong coupling constant, , is considerably larger than the one found in a previous analysis of the same data, . The change by two standard deviations is mainly attributed to changes in the energy calibration. The results for are summarised in Table 1 together with some typical parameters of the fits. The contributions from the different error sources were added in quadrature.
| Data | Ref. | ||||
| BCDMS/SLAC | ? | 0.5 GeV2 | 20 GeV2 | 0.113 | |
| NMC | ? | 1.0 GeV2 | 7 GeV2 | 0.117 | |
| CCFR | ? | 5.0 GeV2 | 5 GeV2 | 0.119 | |
| HERA | ? | 0.120 | |||
| CCFR (GLS, | ? | 3.0 GeV2 | 0.115 | ||
| NNLO) | ? | 1–20 GeV2 | 0.108 | ||
| PDG | ? | 0.118 | |||
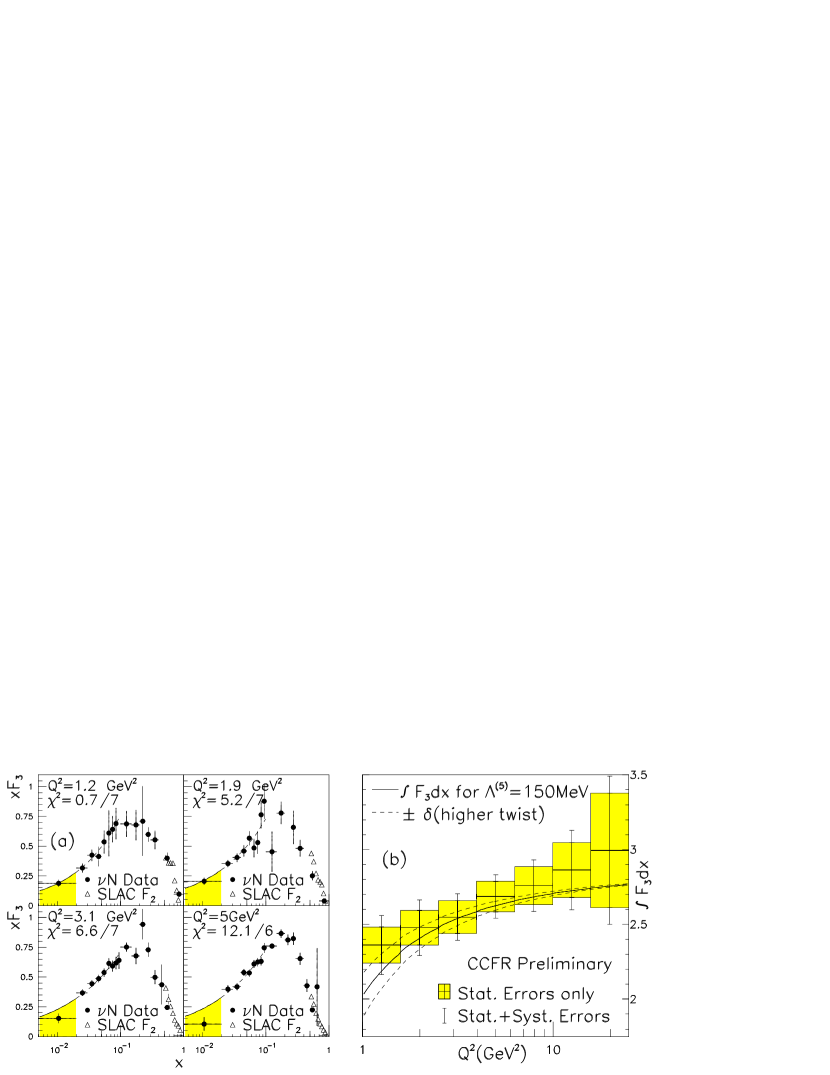
The dependence of moments of structure functions is directly predicted by the operator-product expansion. The GLAP equations can be obtained by a transformation from moment to coordinate space. Therefore the study of moments of structure functions is particularly interesting from the theoretical point of view. However, the extrapolations to (and ) and the fact that the sum rules must be evaluated at a fixed value of for all values of introduces additional experimental uncertainties. The Gross–Llewellyn Smith sum rule (GLS) for the parity-violating structure function states that the nucleon contains three valence quarks
| (11) |
The valence quarks represent a flavour-nonsinglet quark combination like the difference of up and down quark polarisations, , in the famous Bjorken polarisation sum rule. The QCD corrections for both sum rules are known to order . The CCFR Collaboration has evaluated the GLS sum at as . This yields in next-to-next-to-leading order . In this analysis the structure functions were evolved from the of the measurement to 3 GeV2 using the GLAP equations. To avoid any evolution of the data a new analysis was performed including data from other experiments. In particular, data from SLAC were used for , where the antiquark contribution becomes negligible and thus . The GLS sum was evaluated for seven bins between 1 and 20 GeV2 (Fig. 15). The data with GeV2 average to . This value differs considerably from the one found in the re-analysis of scaling violations in and and from the present world average .


6 HERA data for
The HERA experiments H1 and ZEUS have extended the kinematic range of measurements down to and to GeV2 for . The HERA data taken in 1994 agree fairly with the high extrapolation of the fixed-target data as shown in Figs. 16, 17, and 7. In the small- region a steep rise of is observed for decreasing . The parameter increases with from about 0.2 at 10 GeV2 to 0.3 at 100 GeV2 and possibly to 0.5 at 1000 GeV2. The rise of towards small continues down to . Thus Regge-inspired models underestimate in this region. However, preliminary results from ZEUS using the beam-pipe calorimeter and reaching down to and agree with the Donnachie–Landshoff model below .
The asymptotic behaviour of in the small-–large- range is generated by QCD dynamics and can be described by the two variables,
| (12) |
with and . In the HERA region should grow linearly with and be independent of . The slope can be calculated and one obtains for five active flavours. With the quantity becomes independent of both, and . Here accounts for the finite size of and . The HERA data impressively confirm this asymptotic behaviour as shown in Fig. 18. The slope of fitted to the H1 data is in good agreement with the prediction.
The strong correlation of the gluon distribution function with at small makes it difficult to determine in a standard QCD analysis from the HERA data alone. However, the growth of in the small- and large- region is directly related to the value of . An analysis of the HERA data taken in 1993 yielded a rather high value compared to other DIS results, . A preliminary result from the 1994 data yields an even higher value of .

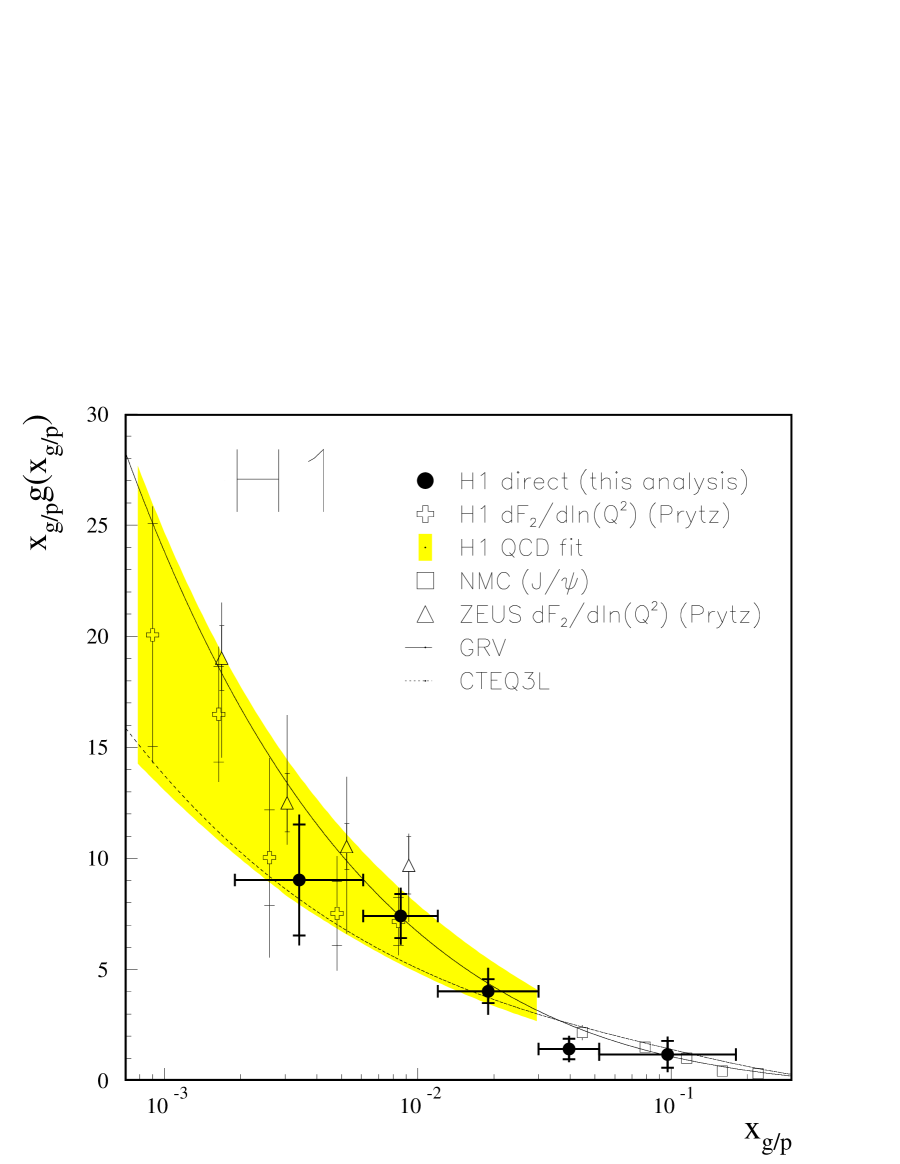
The gluon distribution function determined in a next-to-leading order QCD analysis in the scheme from the H1 data is shown in Fig. 20. New parton distribution functions from global fits including the new HERA data are available from the MRS and CTEQ groups. A direct measurement of can be performed using the (2+1)-jet production data. From the photon-gluon fusion process, , two quark jets emerge. The target jet disappears in the beam pipe. There is an about 30 % contribution from the QCD Compton process, . The (2+1)-jet production is via the photon-gluon fusion process directly linked to the gluon distribution in the proton. Leading-order results from the 1993 (2+1)-jet data from H1 are shown in Fig. 20 together with NMC results from J/ production. They are in good agreement with other determinations of .
7 Conclusions
The fixed-target structure function data are in good agreement. A small discrepancy in the small- region persists between the muon and neutrino data. Presently, it is unclear whether this has a physics origin or is a reflection of experimental difficulties. This question is partly related to the rôle of strangeness in the nucleon and maybe also to the longitudinal structure function, . For considerable progress was made in the small- region. However, it is still much less well known than . An accurate measurement at HERA, requiring a luminosity upgrade, is highly desirable. The theoretical understanding of higher-twist corrections, in particular of their dependence, has made considerable progress over the last years and the calculations agree well with the data. This is an essential ingredient for the determination of from sum rules, e.g. the Gross-Llewellyn Smith sum rule. While up to now most determinations of from scaling violations in structure functions yielded consistently smaller results than obtained from LEP, the situation is less clear after the re-analysis of the CCFR structure functions. A determination of from the small-–high- region of the HERA data yields also a rather large result. The rise of with decreasing and increasing has been mapped out at HERA with a considerable precision. Thus a good determination of the gluon distributions at small became possible.
Deep inelastic scattering continues to be one of the most important testing grounds of perturbative – and to the extent our present understanding allows – also of nonperturbative QCD.
Acknowledgements
I thank my colleagues in the New Muon and Spin Muon Collaborations for many helpful discussions and B. Frois and V. W. Hughes for organising this stimulating Workshop in Erice and for their patience awaiting this manuscript.
References
- [1] X. Ji, J. Tang, and P. Hoodbhoy, Phys. Rev. Lett. 76 (1996) 740.
-
[2]
V. N. Gribov and L. N. Lipatov,
Sov. J. Nucl. Phys. 15 (1972) 438;
L. N. Lipatov, Sov. J. Nucl. Phys. 20 (1975) 94. - [3] Y. L. Dokshitzer, Sov. Phys. JETP 46 (1977) 461.
- [4] G. Altarelli and G. Parisi, Nucl. Phys. B 126 (1977) 298.
- [5] The CCFR Collaboration, A. O. Bazarko et al., Z. Phys. C 65 (1995) 189.
- [6] The EM Collaboration, J. J. Aubert et al., Phys. Lett. B 123 (1983) 275.
- [7] J. Ellis and R. L. Jaffe, Phys. Rev. D 9 (1974) 1444; Phys. Rev. D 10 (1974) 1669.
- [8] The EM Collaboration, J. Ashman et al., Phys. Lett. B 206 (1988) 364.
- [9] The EM Collaboration, J. Ashman et al., Nucl. Phys. B 328 (1989) 1.
- [10] The NM Collaboration, P. Amaudruz et al., Phys. Rev. Lett. 66 (1991) 2712.
- [11] The NM Collaboration, M. Arneodo et al., Phys. Rev. D 50 (1994) R1.
- [12] K. Gottfried, Phys. Rev. Lett. 18 (1967) 1154.
- [13] The H1 Collaboration, I. Abt et al., Nucl. Phys. B 407 (1993) 515.
- [14] The ZEUS Collaboration, M. Derrick et al., Phys. Lett. B 316 (1993) 412.
- [15] The H1 Collaboration, C. Adloff et al., Preprint DESY 97-24 (Hamburg, Germany, February 1997), submitted to Z. Phys. C.
- [16] The ZEUS Collaboration, J. Breitweg et al., Preprint DESY 97-25 (Hamburg, Germany, February 1997), submitted to Z. Phys. C.
- [17] R. D. Ball and A. de Roeck, in: Proceedings Int. Workshop on Deep Inelastic Scattering and related Phenomena (DIS 96), Roma, Italy, April 15–19, 1996, hep–ph/9609309.
- [18] The H1 Collaboration, S. Aid et al., Phys. Lett. B 379 (1996) 319.
- [19] The ZEUS Collaboration, M. Derrick et al., Z. Phys. C 72 (1996) 47.
- [20] C. G. Callan and D. J. Gross, Phys. Rev. Lett. 22 (1969) 156.
- [21] W. Zeuner, these Proceedings.
- [22] R. Taylor, Rev. Mod. Phys. 63 (1991) 573; H. Kendall, Rev. Mod. Phys. 63 (1991) 597; J. Friedman, Rev. Mod. Phys. 63 (1991) 615.
- [23] L. W. Whitlow, E. M. Riordan, and S. Dasu, Phys. Lett. B 282 (1992) 475.
- [24] T. Sloan, G. Smadja, and R. Voss, Phys. Rep. 162 (1988) 45.
- [25] The EM Collaboration, O. C. Allkofer et al., Nucl. Instrum. Methods 179 (1981) 445.
- [26] The NM Collaboration, M. Arneodo et al., submitted to Nucl. Phys. B , hep–ex/9611022.
- [27] The NM Collaboration, P. Amaudruz et al., Nucl. Phys. B 441 (1995) 3.
- [28] The NM Collaboration, M. Arneodo et al., Nucl. Phys. B 481 (1996) 23.
- [29] The E665 Collaboration, M. R. Adams et al., Phys. Rev. D 54 (1996) 3006.
- [30] J. P. Berge et al., Z. Phys. C 49 (1991) 187.
- [31] The CCFR Collaboration, W. C. Leung et al., Phys. Lett. B 317 (1993) 655.
- [32] L. W. Whitlow et al., Phys. Lett. B 250 (1990) 193.
- [33] G. Altarelli and G. Martinelli, Phys. Lett. B 76 (1978) 89.
- [34] The NM Collaboration, M. Arneodo et al., Nucl. Phys. B 483 (1997) 3.
- [35] The CCFR/NuTeV Collaboration, A. Bodek et al., J. Phys. G 22 (1996) 775.
- [36] NM, P. Amaudruz et al., Phys. Lett. B 294 (1992) 120.
- [37] The E-140 Collaboration, S. Dasu et al., Phys. Rev. Lett. 61 (1988) 1061
- [38] The E-140 Collaboration, S. Dasu et al., Phys. Rev. D 49 (1994) 5641.
- [39] The E-140X Collaboration, L. H. Tao et al., Z. Phys. C 70 (1996) 387.
- [40] The H1 Collaboration, C. Adloff et al., Preprint DESY 96-236 (Hamburg, Germany, November 1996).
- [41] BCDMS, A. C. Benvenuti et al., Phys. Lett. B 223 (1989) 485.
- [42] BCDMS, A. C. Benvenuti et al., Phys. Lett. B 237 (1990) 592.
- [43] The EM Collaboration, J. J. Aubert et al., Nucl. Phys. B 259 (1985) 189.
- [44] The EM Collaboration, J. J. Aubert et al., Nucl. Phys. B 293 (1987) 740.
- [45] A. Milsztajn et al., Z. Phys. C 49 (1991) 527.
- [46] K Bazizi and S. J. Wimpenny, Preprint UCR/DIS/91-02 (1991).
- [47] The NM Collaboration, M. Arneodo et al., Phys. Lett. B 364 (1995) 107.
- [48] The H1 Collaboration, S. Aid et al., Nucl. Phys. B 470 (1996) 3.
- [49] The ZEUS Collaboration, M. Derrick et al., Preprint DESY 96-076 (Hamburg, Germany, 1996) submitted to Z. Phys. C.
- [50] The E665 Collaboration, M. R. Adams et al., Phys. Rev. Lett. 75 (1995) 1466.
- [51] B. Badełek and J. Kwiecinski, Nucl. Phys. B 3270 (1992) 278; Phys. Rev. D 50 (1994) R4.
- [52] W. Melnitchouk and A. W. Thomas, Phys. Rev. D 47 (1993) 3783.
- [53] The NA51 Collaboration, A. Baldit et al., Phys. Lett. B 332 (1994) 244.
- [54] The CCFR Collaboration, W. G. Seligman et al., hep–ex/9701017.
- [55] The CCFR Collaboration, S. R. Mishra et al., Preprint Nevis #1459 (June 1992).
- [56] The E-139 Collaboration, J. Gomez et al., Phys. Rev. D 49 (1994) 4348.
- [57] The NM Collaboration, M. Arneodo et al., Nucl. Phys. B 481 (1996) 3.
- [58] S. J. Brodsky, C. Peterson, and N. Sakai, Phys. Rev. D 23 (1981) 2745.
- [59] M. Burkhardt and B. J. Warr, Phys. Rev. D 45 (1992) 958.
- [60] V. Barone et al., Phys. Lett. B 268 (1991) 279.
- [61] V. Barone et al., Phys. Lett. B 304 (1993) 176.
- [62] A. Donnachie and P. V. Landshoff, Z. Phys. C 61 (1994) 139.
- [63] M. Virchaux and A. Milstajn, Phys. Lett. B 274 (1992) 221.
- [64] The NM Collaboration, P. Amaudruz et al., Nucl. Phys. B 371 (1992) 3.
- [65] The NM Collaboration, M. Arneodo et al., Phys. Lett. B 309 (1993) 222.
- [66] H. Georgi and H. D. Politzer, Phys. Rev. D 14 (1976) 1829; A. de Rújula, H. Georgi, and H. D. Politzer, Ann. Phys. 103 (1977) 315.
- [67] M. Dasgupta and B. R. Webber, Phys. Lett. B 382 (1996) 273.
- [68] The CCFR Collaboration, P. Z. Quintas et al., Phys. Rev. Lett. 71 (1993) 1307.
- [69] The CCFR Collaboration, D. A. Harris et al., in: J. Tran Thanh Van, ed., Proceedings XXXth Rencontres de Moriond: QCD and High Energy Hadronic Interactions, Meribel les Allues, France, 19–25 Mar 1995, (Editions Frontières, France, 1995) 247, hep–ex/9506010.
- [70] R. D. Ball and S. Forte, Phys. Lett. B 358 (1995) 365.
- [71] J. Chýla and L. A. Kataev, Phys. Lett. B 297 (1992) 385.
- [72] The Particle Data Group, R. M. Barnett et al., Phys. Rev. D 50 (1994) 1.
- [73] D. J. Gross and C. H. Llewellyn Smith, Nucl. Phys. B 14 (1969) 337.
- [74] J. D. Bjorken, Phys. Rev. 148 (1966) 1467; Phys. Rev. D 1 (1970) 1376.
- [75] S. A. Larin and J. A. M. Vermaseren, Phys. Lett. B 259 (1991) 345.
- [76] The ZEUS Collaboration, Y. Zhu et al., in: Proceedings Int. Workshop on Deep Inelastic Scattering and related Phenomena (DIS 96), Roma, Italy, April 15–19, 1996.
- [77] A. Donnachie and P. V. Landshoff, Phys. Lett. B 296 (1992) 227.
- [78] A. De Rújula et al., Phys. Rev. D 10 (1974) 1649.
- [79] R. D. Ball and S. Forte, Phys. Lett. B 335 (1994) 77.
- [80] R. D. Ball and S. Forte, in: Proceedings Int. Workshop on Deep Inelastic Scattering and related Phenomena (DIS 96), Roma, Italy, April 15–19, 1996, hep–ph/9607289.
- [81] The H1 Collaboration, S. Aid et al., Nucl. Phys. B 449 (1995) 3.
- [82] NM, D. Allasia et al., Phys. Lett. B 258 (1991) 493.
- [83] A. D. Martin, R. G. Roberts, and W. J. Stirling, Phys. Lett. B 387 (1996) 419.
- [84] H. L. Lai et al., Phys. Rev. D 55 (1997) 1280.