DESY 97–009 ISSN 0418-9833
January 1997
Diffraction Dissociation in
Photoproduction at HERA
H1 Collaboration
A study is presented of the process , where there is a large rapidity gap between the systems and . Measurements are made of the differential cross section as a function of the invariant mass of the system produced at the photon vertex. Results are presented at centre of mass energies of and , both where the proton dominantly remains intact and, for the first time, where it dissociates. Both the centre of mass energy and the dependence of HERA data and those from a fixed target experiment may simultaneously be described in a triple-Regge model. The low mass photon dissociation process is found to be dominated by diffraction, though a sizable subleading contribution is present at larger masses. The pomeron intercept is extracted and found to be , in good agreement with values obtained from total and elastic hadronic and photoproduction cross sections. The diffractive contribution to the process with is measured to be of the total cross section at .
C. Adloff35, S. Aid13, M. Anderson23, V. Andreev26, B. Andrieu29, V. Arkadov36, C. Arndt11, I. Ayyaz30, A. Babaev25, J. Bähr36, J. Bán18, Y. Ban28, P. Baranov26, E. Barrelet30, R. Barschke11, W. Bartel11, U. Bassler30, H.P. Beck38, M. Beck14, H.-J. Behrend11, A. Belousov26, Ch. Berger1, G. Bernardi30, G. Bertrand-Coremans4, M. Besançon9, R. Beyer11, P. Biddulph23, P. Bispham23, J.C. Bizot28, K. Borras8, F. Botterweck27, V. Boudry29, A. Braemer15, W. Braunschweig1, V. Brisson28, W. Brückner14, P. Bruel29, D. Bruncko18, C. Brune16, R. Buchholz11, L. Büngener13, J. Bürger11, F.W. Büsser13, A. Buniatian4, S. Burke19, M.J. Burton23, D. Calvet24, A.J. Campbell11, T. Carli27, M. Charlet11, D. Clarke5, B. Clerbaux4, S. Cocks20, J.G. Contreras8, C. Cormack20, J.A. Coughlan5, A. Courau28, M.-C. Cousinou24, G. Cozzika9, L. Criegee11, D.G. Cussans5, J. Cvach31, S. Dagoret30, J.B. Dainton20, W.D. Dau17, K. Daum42, M. David9, C.L. Davis19,39, A. De Roeck11, E.A. De Wolf4, B. Delcourt28, M. Dirkmann8, P. Dixon19, W. Dlugosz7, C. Dollfus38, K.T. Donovan21, J.D. Dowell3, H.B. Dreis2, A. Droutskoi25, O. Dünger13, H. Duhm12,† J. Ebert35, T.R. Ebert20, G. Eckerlin11, V. Efremenko25, S. Egli38, R. Eichler37, F. Eisele15, E. Eisenhandler21, E. Elsen11, M. Erdmann15, W. Erdmann37, A.B. Fahr13, L. Favart28, A. Fedotov25, R. Felst11, J. Feltesse9, J. Ferencei18, F. Ferrarotto33, K. Flamm11, M. Fleischer8, M. Flieser27, G. Flügge2, A. Fomenko26, J. Formánek32, J.M. Foster23, G. Franke11, E. Fretwurst12, E. Gabathuler20, K. Gabathuler34, F. Gaede27, J. Garvey3, J. Gayler11, M. Gebauer36, H. Genzel1, R. Gerhards11, A. Glazov36, L. Goerlich6, N. Gogitidze26, M. Goldberg30, D. Goldner8, K. Golec-Biernat6, B. Gonzalez-Pineiro30, I. Gorelov25, C. Grab37, H. Grässler2, T. Greenshaw20, R.K. Griffiths21, G. Grindhammer27, A. Gruber27, C. Gruber17, T. Hadig1, D. Haidt11, L. Hajduk6, T. Haller14, M. Hampel1, W.J. Haynes5, B. Heinemann11, G. Heinzelmann13, R.C.W. Henderson19, H. Henschel36, I. Herynek31, M.F. Hess27, K. Hewitt3, W. Hildesheim11, K.H. Hiller36, C.D. Hilton23, J. Hladký31, M. Höppner8, D. Hoffmann11, T. Holtom20, R. Horisberger34, V.L. Hudgson3, M. Hütte8, M. Ibbotson23, C. Issever8, H. Itterbeck1, A. Jacholkowska28, C. Jacobsson22, M. Jacquet28, M. Jaffre28, J. Janoth16, D.M. Jansen14, T. Jansen11, L. Jönsson22, D.P. Johnson4, H. Jung22, P.I.P. Kalmus21, M. Kander11, D. Kant21, R. Kaschowitz2, U. Kathage17, J. Katzy15, H.H. Kaufmann36, O. Kaufmann15, M. Kausch11, S. Kazarian11, I.R. Kenyon3, S. Kermiche24, C. Keuker1, C. Kiesling27, M. Klein36, C. Kleinwort11, G. Knies11, T. Köhler1, J.H. Köhne27, H. Kolanoski41, S.D. Kolya23, V. Korbel11, P. Kostka36, S.K. Kotelnikov26, T. Krämerkämper8, M.W. Krasny6,30, H. Krehbiel11, D. Krücker27, H. Küster22, M. Kuhlen27, T. Kurča36, J. Kurzhöfer8, B. Laforge9, M.P.J. Landon21, W. Lange36, U. Langenegger37, A. Lebedev26, F. Lehner11, V. Lemaitre11, S. Levonian29, G. Lindström12, M. Lindstroem22, F. Linsel11, J. Lipinski11, B. List11, G. Lobo28, P. Loch11,43, J.W. Lomas23, G.C. Lopez12, V. Lubimov25, D. Lüke8,11, L. Lytkin14, N. Magnussen35, E. Malinovski26, R. Maraček18, P. Marage4, J. Marks15, R. Marshall23, J. Martens35, G. Martin13, R. Martin20, H.-U. Martyn1, J. Martyniak6, T. Mavroidis21, S.J. Maxfield20, S.J. McMahon20, A. Mehta5, K. Meier16, P. Merkel11, F. Metlica14, A. Meyer13, A. Meyer11, H. Meyer35, J. Meyer11, P.-O. Meyer2, A. Migliori29, S. Mikocki6, D. Milstead20, J. Moeck27, F. Moreau29, J.V. Morris5, E. Mroczko6, D. Müller38, G. Müller11, K. Müller11, P. Murín18, V. Nagovizin25, R. Nahnhauer36, B. Naroska13, Th. Naumann36, I. Négri24, P.R. Newman3, D. Newton19, H.K. Nguyen30, T.C. Nicholls3, F. Niebergall13, C. Niebuhr11, Ch. Niedzballa1, H. Niggli37, G. Nowak6, T. Nunnemann14, M. Nyberg-Werther22, H. Oberlack27, J.E. Olsson11, D. Ozerov25, P. Palmen2, E. Panaro11, A. Panitch4, C. Pascaud28, S. Passaggio37, G.D. Patel20, H. Pawletta2, E. Peppel36, E. Perez9, J.P. Phillips20, A. Pieuchot24, D. Pitzl37, R. Pöschl8, G. Pope7, B. Povh14, S. Prell11, K. Rabbertz1, G. Rädel11, P. Reimer31, H. Rick8, S. Riess13, E. Rizvi21, P. Robmann38, R. Roosen4, K. Rosenbauer1, A. Rostovtsev30, F. Rouse7, C. Royon9, K. Rüter27, S. Rusakov26, K. Rybicki6, D.P.C. Sankey5, P. Schacht27, S. Schiek13, S. Schleif16, P. Schleper15, W. von Schlippe21, D. Schmidt35, G. Schmidt13, L. Schoeffel9, A. Schöning11, V. Schröder11, E. Schuhmann27, B. Schwab15, F. Sefkow38, A. Semenov25, V. Shekelyan11, I. Sheviakov26, L.N. Shtarkov26, G. Siegmon17, U. Siewert17, Y. Sirois29, I.O. Skillicorn10, T. Sloan19, P. Smirnov26, M. Smith20, V. Solochenko25, Y. Soloviev26, A. Specka29, J. Spiekermann8, S. Spielman29, H. Spitzer13, F. Squinabol28, P. Steffen11, R. Steinberg2, H. Steiner11,40, J. Steinhart13, B. Stella33, A. Stellberger16, J. Stier11, J. Stiewe16, U. Stößlein36, K. Stolze36, U. Straumann15, W. Struczinski2, J.P. Sutton3, S. Tapprogge16, M. Taševský32, V. Tchernyshov25, S. Tchetchelnitski25, J. Theissen2, C. Thiebaux29, G. Thompson21, N. Tobien11, R. Todenhagen14, P. Truöl38, G. Tsipolitis37, J. Turnau6, E. Tzamariudaki11, P. Uelkes2, A. Usik26, S. Valkár32, A. Valkárová32, C. Vallée24, P. Van Esch4, P. Van Mechelen4, D. Vandenplas29, Y. Vazdik26, P. Verrecchia9, G. Villet9, K. Wacker8, A. Wagener2, M. Wagener34, B. Waugh23, G. Weber13, M. Weber16, D. Wegener8, A. Wegner27, T. Wengler15, M. Werner15, L.R. West3, T. Wilksen11, S. Willard7, M. Winde36, G.-G. Winter11, C. Wittek13, M. Wobisch2, H. Wollatz11, E. Wünsch11, J. Žáček32, D. Zarbock12, Z. Zhang28, A. Zhokin25, P. Zini30, F. Zomer28, J. Zsembery9, K. Zuber16 and
M. zurNedden38
1 I. Physikalisches Institut der RWTH, Aachen, Germanya
2 III. Physikalisches Institut der RWTH, Aachen, Germanya
3 School of Physics and Space Research, University of Birmingham,
Birmingham, UKb
4 Inter-University Institute for High Energies ULB-VUB, Brussels;
Universitaire Instelling Antwerpen, Wilrijk, Belgiumc
5 Rutherford Appleton Laboratory, Chilton, Didcot, UKb
6 Institute for Nuclear Physics, Cracow, Polandd
7 Physics Department and IIRPA,
University of California, Davis, California, USAe
8 Institut für Physik, Universität Dortmund, Dortmund,
Germanya
9 CEA, DSM/DAPNIA, CE-Saclay, Gif-sur-Yvette, France
10 Department of Physics and Astronomy, University of Glasgow,
Glasgow, UKb
11 DESY, Hamburg, Germanya
12 I. Institut für Experimentalphysik, Universität Hamburg,
Hamburg, Germanya
13 II. Institut für Experimentalphysik, Universität Hamburg,
Hamburg, Germanya
14 Max-Planck-Institut für Kernphysik,
Heidelberg, Germanya
15 Physikalisches Institut, Universität Heidelberg,
Heidelberg, Germanya
16 Institut für Hochenergiephysik, Universität Heidelberg,
Heidelberg, Germanya
17 Institut für Reine und Angewandte Kernphysik, Universität
Kiel, Kiel, Germanya
18 Institute of Experimental Physics, Slovak Academy of
Sciences, Košice, Slovak Republicf,j
19 School of Physics and Chemistry, University of Lancaster,
Lancaster, UKb
20 Department of Physics, University of Liverpool,
Liverpool, UKb
21 Queen Mary and Westfield College, London, UKb
22 Physics Department, University of Lund,
Lund, Swedeng
23 Physics Department, University of Manchester,
Manchester, UKb
24 CPPM, Université d’Aix-Marseille II,
IN2P3-CNRS, Marseille, France
25 Institute for Theoretical and Experimental Physics,
Moscow, Russia
26 Lebedev Physical Institute, Moscow, Russiaf
27 Max-Planck-Institut für Physik,
München, Germanya
28 LAL, Université de Paris-Sud, IN2P3-CNRS,
Orsay, France
29 LPNHE, Ecole Polytechnique, IN2P3-CNRS,
Palaiseau, France
30 LPNHE, Universités Paris VI and VII, IN2P3-CNRS,
Paris, France
31 Institute of Physics, Czech Academy of
Sciences, Praha, Czech Republicf,h
32 Nuclear Center, Charles University,
Praha, Czech Republicf,h
33 INFN Roma 1 and Dipartimento di Fisica,
Università Roma 3, Roma, Italy
34 Paul Scherrer Institut, Villigen, Switzerland
35 Fachbereich Physik, Bergische Universität Gesamthochschule
Wuppertal, Wuppertal, Germanya
36 DESY, Institut für Hochenergiephysik,
Zeuthen, Germanya
37 Institut für Teilchenphysik,
ETH, Zürich, Switzerlandi
38 Physik-Institut der Universität Zürich,
Zürich, Switzerlandi
39 Institut für Physik, Humboldt-Universität,
Berlin, Germanya
40 Rechenzentrum, Bergische Universität Gesamthochschule
Wuppertal, Wuppertal, Germanya
41 Visitor from Physics Dept. University Louisville, USA
† Deceased
a Supported by the Bundesministerium für Bildung, Wissenschaft,
Forschung und Technologie, FRG,
under contract numbers 6AC17P, 6AC47P, 6DO57I, 6HH17P, 6HH27I,
6HD17I, 6HD27I, 6KI17P, 6MP17I, and 6WT87P
b Supported by the UK Particle Physics and Astronomy Research
Council, and formerly by the UK Science and Engineering Research
Council
c Supported by FNRS-NFWO, IISN-IIKW
d Supported by the Polish State Committee for Scientific Research,
grant no. 115/E-343/SPUB/P03/120/96
e Supported in part by USDOE grant DE F603 91ER40674
f Supported by the Deutsche Forschungsgemeinschaft
g Supported by the Swedish Natural Science Research Council
h Supported by GA ČR grant no. 202/96/0214,
GA AV ČR grant no. A1010619 and
GA UK grant no. 177
i Supported by the Swiss National Science Foundation
j Supported by VEGA SR grant no. 2/1325/96
1 Introduction
At the HERA electron-proton collider the bulk of the cross section corresponds to photoproduction, in which a beam electron is scattered through a very small angle and a quasi-real photon interacts with the proton. For such small photon virtualities the dominant interaction mechanism takes place via the fluctuation of the photon into a hadronic state [1] which interacts with the proton via the strong force. High energy photoproduction therefore exhibits broadly similar characteristics to hadron-hadron collisions, but with cross sections typically reduced by factors of order the fine structure constant. Whilst the regime of asymptotic freedom in strong interactions can be described using perturbative QCD, the overwhelming majority of the cross section in which no hard scale is present remains far from understood. The study of soft interactions between photons and protons provides an excellent environment in which to study both the hadronic manifestation of the photon and the dynamics of the long range component of the strong force.
The dependence on centre of mass energy of elastic and, via the optical theorem, total hadron-hadron cross sections has been remarkably well described in a large kinematic domain by Regge phenomenology [2]. In this framework, interactions take place via the -channel exchange of reggeons related to mesons [3] and of the leading vacuum singularity, the pomeron () [4]. The pomeron is the mediator of diffractive111In this paper, the word ‘diffractive’ is used synonymously with -channel pomeron exchange; -channel approaches to diffraction are discussed in [5, 6]. processes. At asymptotically large energies, pomeron exchange dominates the elastic channel, such that both elastic and total cross sections display a slow increase with centre of mass energy. Interactions in which one or both of the hadrons dissociates to higher mass states also occur [5]. Such processes are characterised by the presence of large regions of rapidity space in which no hadrons are produced and are dominated by diffractive exchange at large centre of mass energy and small dissociation mass . The inclusive dissociation mass distribution may be treated via Mueller’s generalisation of the optical theorem [7], such that an appropriate Regge description involves diagrams that contain three-reggeon couplings.
Experimental results on dissociative processes and their theoretical description are extensively covered in a number of review articles [8, 9, 10, 11]. At sufficiently high energy, differential dissociation cross sections are approximately independent of and fall like [12, 13]. The dependence on the 4-momentum transfer squared is approximately exponential at small . The highest energy experiments [14, 15] have confirmed this behaviour, but have reported weaker dependences of integrated diffractive cross sections on than is predicted by Regge models based on fits to total and elastic cross sections. This is often taken to be the first hint of the influence of unitarity bounds [16] on diffractive cross sections and a number of mechanisms that unitarise the cross section have been proposed [17, 18].
As in the case of hadron-hadron interactions, distinct elastic and dissociative photoproduction subprocesses are usually distinguished. Each of these may be discussed in terms of the diagram for the process shown in figure 1. The elastic (EL) case, , corresponds to the situation where the system consists of a vector meson state, , , , , and is a proton. For single photon dissociation (GD), , the proton remains intact and the photon dissociates to a continuum of states with invariant mass . Single proton dissociation (PD), , describes the case where a vector meson is produced at the photon vertex, and the proton dissociates to a system of mass . Finally, in the case of double dissociation (DD), , both interacting particles dissociate.
Results from HERA on the total cross section [19, 20] and exclusive light vector meson photoproduction [21, 22, 23] are well described in the Regge picture in terms of a single pomeron trajectory, consistent with that obtained by Donnachie and Landshoff in fits to and total cross sections [24]. Differential cross sections for the GD process have been measured in a fixed target photoproduction experiment [25]. In [19] overall cross sections for the EL and the sum of the GD, PD and DD processes were measured at an average centre of mass energy and in [20], the EL, GD and PD contributions were presented as a function of the unmeasured DD cross section at . No measurements have yet been made at HERA that fully unfold the PD, GD and DD components or that do not rely on model dependent extrapolations of dissociation mass spectra.
In this paper, the mass is reconstructed directly in the central components of the H1 detector. In addition to the central detectors, components of H1 that are sensitive to hadronic activity very close to the outgoing proton direction are used to constrain the mass . This leads to measurements of , both for events in which the proton dominantly remains intact (closely corresponding to the EL and GD processes) and where it dissociates to low mass states (corresponding to the PD and DD processes). In section 2, the processes measured are defined at the level of final state hadrons and kinematic variables are introduced. Section 3 briefly describes the H1 detector and section 4 outlines the Monte Carlo simulations used in the measurement. Event selection, kinematic reconstruction methods and other details of the experimental procedure are covered in section 5. In section 6 the measured cross sections are presented, the GD process is decomposed according to a triple-Regge prescription and the dissociation mass and centre of mass energy dependences of the diffractive contribution are discussed.
2 Cross section definitions and kinematics
Dissociation mass spectra have traditionally been measured by tagging leading final state protons and inferring the mass of the dissociation products from the 4-vectors of the beam and tagged protons. In this analysis a complementary approach is taken, making use of the fact that, where a colourless exchange takes place, there is generally an associated region in rapidity space that contains no final state particles (a ‘rapidity gap’). The size of the gap is related to the masses of the final state systems produced at each vertex.
Each event is considered in terms of the generic quasi two-body process, , illustrated in figure 1. The two systems and are separated by the largest rapidity gap, with rapidity calculated in the photon-proton centre of mass frame. is the system closest to the proton beam direction. This scheme of event decomposition provides a means of defining hadron level cross sections without assumptions as to the interaction mechanism. However, where a colourless exchange does not take place, the location of the largest gap is determined by random fluctuations, the average gap size is small and at least one of the systems or generally has a large mass.
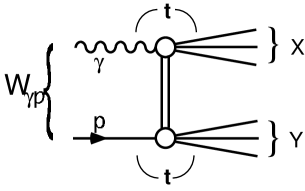
The kinematics of the interaction are specified in terms of the 4-vectors of the incoming photon and proton, denoted by and respectively, and those of the two distinct components of the final state, and . Convenient Lorentz scalars are
where is the total photon-proton centre of mass energy, is the square of the 4-momentum transferred and and are the invariant masses of the two final state hadronic systems. The ratios and most naturally distinguish between the kinematic region where diffraction is dominant and that in which other exchanges become important.
The mass of the system is measured using the central components of the detector up to . For the mass of the system may also be measured. Where is smaller its value is constrained using the location of the rapidity gap. The resolution in transverse momentum is insufficient for a differential measurement of the dependence. Measurements of the differential cross section are presented at and , for the region and and for and all .
3 The H1 detector
The components of the H1 detector that are most relevant to this analysis are briefly described here. More detailed information can be found in [26]. The coordinate system convention for the experiment defines the forward, positive direction as being that of the proton beam. The polar angle is defined relative to this axis such that pseudo-rapidity, , is positive in the forward region.
Final state electrons are detected in the electron tagger of the luminosity system (eTag), which is situated at and has an acceptance such that , where describes the photon virtuality. Bremsstrahlung photons produced at very small polar angles leave the beam-pipe through an exit window and are detected at in the photon arm of the luminosity system.
Minimally biased photoproduction data samples are obtained using trigger signals from the eTag in coincidence with a ‘ToF’ trigger. The ToF trigger demands at least one pair of hits in the twin layers of plastic scintillator comprising the Time of Flight device, during a short time period at each bunch crossing when particles originating from interactions in the vertex region are expected to arrive. The backward location of the ToF () significantly enhances the efficiency for triggering events at low compared to triggers that require tracks in the central parts of the detector.
The system is detected and measured using tracking and calorimeter information from the central parts of the detector. Charged tracks are measured in the range in the two large concentric drift chambers of the central tracker, which lies inside a solenoidal field. Surrounding the drift chambers, the finely segmented liquid argon calorimeter (LAr) provides smooth and hermetic coverage in the range . The lead-scintillator Backward Electromagnetic Calorimeter (BEMC) completes the coverage in the backward region for . The backward multi-wire proportional chambers (BPC) are mounted directly onto the surface of the BEMC.
The most forward components of H1 are used to tag hadronic activity at high pseudo-rapidity [27, 28, 29, 30]. At all but the smallest values of , rescattering of primary particles with the beam-pipe and the surrounding material yields showers of secondary particles which are observable in these detectors, extending their sensitivity to pseudo-rapidities larger than would be expected on the basis of their geometrical acceptance alone. The Proton Remnant Tagger (PRT) consists of double layers of scintillator surrounding the beam-pipe at and covers the highest pseudo-rapidity region. Three double layers of drift chambers of the Forward Muon Detector (FMD) cover a slightly lower pseudo-rapidity range. These components of H1 provide high efficiency for the identification of primary particle production in the region . A third detector component, the plug calorimeter, is sensitive at the lower end of this range and is used to perform cross-checks of the measurement. The overall range of sensitivity of the H1 detector to final state hadron production spans 11 pseudo-rapidity units, providing excellent discrimination between different event topologies.
4 Simulations
Two Monte Carlo models, based on the event generators PHOJET [31] and PYTHIA [32], are used to determine corrections to the data for triggering and detector inefficiency, the effects of analysis cuts and the smearing of kinematic quantities due to detector resolution. The description of soft photoproduction processes by both models is based on Regge phenomenology. Both generators produce events from all four elastic and dissociative subprocesses described in section 1 as well as events in which colour is exchanged. The generated events are passed through a full simulation of the H1 detector and are subjected to the same analysis chain as the data.
The lowest lying vector meson states are generated in the ratio , consistent with previous measurements at HERA [21, 22, 23] and at lower energy [33]. The differential distributions take the peripheral form , with the slope parameter in both models for . Non-resonant di-pion production is accounted for by reweighting the mass distributions produced by the models such that the line shape matches the parameterisation of Ross and Stodolsky [34], with parameters fixed according to previous HERA measurements [21, 22].
Dissociative events are produced in the regions and , using approximations to triple-pomeron predictions with couplings constrained by low energy data. The -slope parameters, , and have logarithmic dependences on , and . The PD and GD slope parameters are approximately half those for the EL reaction, and the DD slope parameter is reduced by a further factor of approximately 2.
The PYTHIA model of dissociation processes assumes a pomeron intercept of unity, such that the differential cross section for the GD process at fixed takes the approximate form
| (1) |
with similar expressions for the differential PD and DD cross sections. Additional factors are applied in order to modify the distributions in kinematic regions in which a triple-pomeron model is known to be inappropriate. Their main effects are to enhance the low mass components of the dissociation spectra, suppress the production of very large masses and, in the DD case, to reduce the probability of the systems and overlapping in rapidity space [32, 35]. GD, PD and DD states produced with or decay isotropically to two-body final states. The fragmentation of higher mass dissociation systems is treated in a string model, with final state hadrons distributed in a longitudinal phase space with limited transverse momentum [36].
In the PHOJET model, the first moment Finite Mass Sum Rule (FMSR) [37] is applied in order to achieve a smooth transition between the elastic, resonance and high mass continuum regions. At fixed , the GD spectrum follows the parameterisation
| (2) |
where the pomeron intercept is taken to be , and the ‘mass’ of the incoming photon is taken to be that of the meson. A similar parameterisation was found to work well for fixed target photoproduction data [25]. PD and DD distributions are produced in a similar manner with the proton mass defining for the system . Dissociation to states in the resonance region () are treated through the extended Vector Dominance Model [38] in a similar manner to EL processes. A single effective resonance is assumed in the low mass GD region, normalised using the FMSR and decaying to 2 or 3 particle final states. The slope parameter falls smoothly through the resonance region. Higher mass final states are again limited in .
The mass distributions and ratios for the distinct subprocesses are iteratively reweighted such that the differential cross sections of each Monte Carlo simulation best describe the measured cross sections presented in section 6.1.
A third event generator, DIFFVM [39], models vector meson production at large , both where the proton dissociates and where it remains intact. The simulation is based on Regge behaviour and the Vector Dominance Model and is described in more detail in [29, 30]. Since DIFFVM is able to generate dissociative events both with limited and with isotropic decays of the dissociative system, it is used to check the sensitivity of the measurement to differing decay properties of the system .
5 Experimental method
5.1 Selection of photoproduction events
The data used in this measurement were collected in two short dedicated runs in 1994, when HERA was colliding positrons at with protons. The first run was taken with the vertex at its nominal position of and the second with the vertex shifted in the proton direction to . The latter configuration gives an enhanced efficiency for the detection of the most backward going final state particles. The integrated luminosities of the two samples are and respectively. The data samples have previously been used in measurements of the total cross section [20] and of the cross section for exclusive photoproduction [22].
Photoproduction events were triggered on the basis of a coincidence of signals from the ToF and eTag triggers described in section 3. These requirements have been shown to give good efficiency for all photoproduction subprocesses [20]. The eTag is also used to measure the energy of the scattered electron, from which the centre of mass energy is inferred. Two ranges of are considered, covering the region in which the acceptance of the eTag is highest. The first, , yields a centre of mass energy averaged over the photon flux distribution [20, 40] of . The second range is , for which .
Events arising from the Bremsstrahlung process, , are removed by requiring no activity above in the photon detector. A correction of is made for the loss of signal due to the random overlap of Bremsstrahlung events with interactions.
The principal background to the measurement arises from interactions of the electron beam with residual gas particles or with the walls of the beam-pipe. Proton-beam induced interactions also contribute to the background when they occur in coincidence with a reconstructed electron in the eTag. This may arise from electron-gas/wall collisions or from a Bremsstrahlung process in which the photon is not detected. All of these sources of contamination are suppressed by requiring either that the total energy reconstructed in the calorimeters is greater than , or that a vertex is reconstructed at a position in that lies within of the mean interaction point. Any event in which a vertex is reconstructed outside this region is rejected. In the higher range of , where backgrounds are largest, a BPC hit is required in addition. After these cuts, the remaining level of background associated with the electron beam alone is estimated from non-interacting electron pilot bunches and that arising from the proton beam is determined from event samples in which either the ToF or the eTag component of the trigger is relaxed. Both backgrounds are subtracted statistically. The subtraction varies between zero and 19% in the measured region.
5.2 Separation of the systems and
In order to ensure that the systems and are clearly separated, only those events that contain a region of at least two units of pseudo-rapidity in which no particles are reconstructed are considered in the analysis. This gap extends from the largest pseudo-rapidity reached by fragments of the system to the smallest pseudo-rapidity at which particles associated with the system are observed. Its presence implies that both and are small compared to .
Three distinct subsamples are defined. In sample A there is no activity above noise levels in the forward detectors (PRT and FMD) and the most forward part of the LAr (). These cuts are similar to those which have been used in previous H1 publications [22, 27, 28, 29, 30]. With this selection, the pseudo-rapidity gap spans at least under nominal vertex conditions and for shifted vertex data. In sample B a signal is observed above noise levels in the forward detectors and there is a pseudo-rapidity gap of at least two units in the central detectors (central tracker and LAr and BEMC calorimeters), extending to the forward limit of acceptance of the LAr. Sample C is defined in the same way as sample B, except that the gap in the central detectors does not extend to the forward edge of the LAr.
The data and simulated events that are shown in all subsequent figures are required to pass one of these three selection criteria. There are 8685 such events in the nominal vertex data sample and 8184 in the shifted vertex sample.
5.3 Reconstruction of and
The mass reconstruction has been optimised by combining tracking and calorimeter information in an energy flow algorithm that avoids double counting. Primary vertex constrained tracks are extrapolated into the calorimeter and energy clusters increasingly distant from the extrapolated track are discounted. The procedure continues either until the total energy of the excluded clusters exceeds that of the track, under the assumption that the particle yielding the track is a pion, or until all electromagnetic (hadronic) clusters within a cylinder of radius () about the extrapolated track have been removed. Detector noise is potentially problematic, particularly at small values of . To minimise its effect, techniques have been developed that reject low energy isolated clusters in the LAr. Any calorimeter deposit that is not associated with a track or rejected as noise is accepted.
The same method is used to reconstruct for all three samples A, B and C. The gap requirements introduced in section 5.2 ensure that does not extend beyond the forward acceptance limit of the central detector components. Losses in the backward direction are, however, unavoidable both into the beam-pipe and because of the poor containment of hadrons by the BEMC. In order to minimise the effect of such losses, the mass of the system is reconstructed using the expression
| (3) |
where is the laboratory energy of the interacting photon, obtained from the electron energy measurement, and and have been neglected in the last expression. The quantity is summed over all hadrons reconstructed backward of the largest pseudo-rapidity gap and has the property of being insensitive to the very backward going hadrons with that are usually not observed. A constant correction factor of 1.07 is applied to the reconstructed to account for the remaining losses. Figure 2a shows a comparison between the reconstructed and generated values of in the PYTHIA simulation. Good reconstruction is obtained for all masses, including those corresponding to exclusive vector meson production. The resolution shows a slow improvement with increasing mass and is approximately 30%.
Only in sample C, where fragments from the system are observed in the central detector components, is it possible to reconstruct . For this sample a similar approach is taken for the reconstruction of as for . The relation
| (4) |
is used, where is the energy of the proton beam and the proton mass and are neglected in the last expression. Equation (4) is insensitive to losses at very large pseudo-rapidities. The remaining effect of undetected particles is accounted for by applying a constant correction factor of 1.10 to the reconstructed . Figure 2b shows a comparison between reconstructed and generated values from simulated events in which particles from the system reach the central detector components (sample C). Good reconstruction is obtained for .
For samples A and B the system is not observed in the central detectors and direct reconstruction of is not possible. Instead, information is obtained from the presence or absence of activity in the forward detectors. The location of the upper edge of the pseudo-rapidity gap is correlated with so that, with a knowledge of the regions of pseudo-rapidity to which the forward detectors are sensitive, different regions of are distinguished.
5.4 Selection of intervals in the invariant mass
The three subsamples defined in section 5.2 are used to measure cross sections in two ranges of . For sample A the system passes unobserved down the forward beam pipe at . Studies using the Monte Carlo simulations have shown that this selection is almost 100% efficient for events in which is a single proton and falls to approximately 50% at . Sample A is therefore used to measure the cross section with . This region is likely to be dominated by the subprocesses GD and EL in which is a proton. There are also likely to be contributions from events in which is a different low mass baryonic system. Since neither the isospin nor the charge of is determined, this may be any of , , , , or a non-resonant system.
Samples B and C are used together to measure the cross section for events of the types DD and PD integrated over the range . For sample B, , while in sample C is usually larger. The full sample B is used along with events from sample C for which , reconstructed using equation (4), is less than . The restrictions imposed by the pseudo-rapidity gap criteria mean that the maximum accessible value of decreases as increases. The upper limit of is chosen so that the measurement can be made over a large range of , whilst ensuring that the upper limit in lies in the region where the reconstruction is good.
Figures 3a and 3b show uncorrected distributions for events used to make measurements in the two intervals compared to the simulations. Satisfactory agreement between the data and the Monte Carlo models is obtained in both cases. An elastic peak is observed in sample A, along with a higher mass continuum that extends until the system reaches the limit set by demanding no activity in the most forward region of the LAr. In samples B and C no significant enhancement in the distribution is observed in the region of the light vector mesons, and the requirement of a gap of at least two pseudo-rapidity units in the central detector components restricts the data to smaller values of . Figure 3c shows the reconstructed distribution in proton dissociation mass of events from data sample C.
5.5 Extraction of cross sections
The criteria described in section 5.4 are used to measure cross sections as defined in section 2 for the regions and . The events in each range are divided into intervals in and the residual contribution from beam induced background is subtracted in each interval using the procedure described in section 5.1.
An average of the PHOJET and PYTHIA models is used to correct for losses and migration of events in and . For , elastically scattered protons are observed in the PRT, resulting in their classification in the wrong interval. The simulations are therefore also used to correct the measurement for to the region and that for to all .
The Monte Carlo models do not explicitly simulate the states that may be present in the data but have different isospin or charge from the proton. However, the acceptance for such states is likely to be similar to that for final states arising from diffractive exchange and, after the reweighting procedure described in section 4, no additional corrections are made. A small correction is applied for the loss of events contributing to the cross section at large and large for which the largest gap in pseudo-rapidity is smaller than two units. The correction necessary in unfolding from the experimental separation of the systems and using the largest gap in pseudo-rapidity to the cross section defined in section 2 in terms of rapidity is found to be negligible.
The mean acceptance of the eTag is for the sample and for . The combined acceptance of the ToF component of the trigger and the off-line cuts is greater than for all measurements and purities222Purity is defined as the fraction of all simulated events reconstructed in a mass interval that are also generated in that interval. are better than for all measured data points. The maximum values of and considered are 0.041 and 0.0084 respectively. Migration from the regions and is less than for all quoted measurements.
A cross section is obtained assuming a photon flux derived from the Weizsäcker-Williams approximation [40, 20]. Radiative corrections were found to be at the level of 1% in [20] and are neglected here. The measurements obtained from the shifted and nominal vertex data samples are compatible within statistical errors. The two measurements are averaged with weights determined from their statistical errors to produce the quoted cross sections. All measurements are presented at the bin centres in . With the exception of the lowest two intervals, where exclusive vector meson production gives rise to a resonance structure [22], bin centre corrections at the level of are applied, based on the fits presented in sections 6.3 and 6.4.
For the boost of the centre of mass frame relative to the laboratory is reduced compared to that at , such that measurements in the lowest region are no longer possible, but larger values become accessible. Statistical errors are largest at high , since both the photon flux distribution and the acceptance of the eTag fall with increasing photon energy.
A cross check has been performed with a sample of data triggered by a track in the central chambers [20], for which the acceptance becomes high at large . The results were consistent with those obtained from the ToF triggered samples. The sensitivity of the results to variations in the pseudo-rapidity gap selection criteria and mass reconstruction methods have been checked in several ways. No significant changes in the measured cross sections are observed when the forward region of the LAr that must be devoid of activity in the low measurement is enlarged to or when this cut is removed completely. There is also little change when the minimum gap size requirement for the larger measurement is varied between 1 and 3 pseudo-rapidity units, when a further forward detector, the plug calorimeter, is included, or when and are reconstructed using calorimeter clusters only.
5.6 Error analysis
Statistical errors arise from the finite volume of data, the samples used in the subtraction of beam induced background and the simulation samples used to make corrections. The statistical error in each interval is formed by adding the contributions from these three sources in quadrature.
Systematic errors are evaluated on a bin by bin basis. No single contribution dominates in any region of the measurement. A brief summary of the systematic effects that are found to be most important is given below.
-
•
The uncertainties in the hadronic energy scales of the BEMC and LAr calorimeters are and respectively. That on track measurements is . There is a 1% uncertainty in the energy calibration of the eTag.
-
•
The uncertainty in the efficiency of the PRT is .
-
•
A variation in the beam induced background, accounting for uncertainties in the extrapolation of pilot bunch information.
-
•
Uncertainties in the decomposition of the total photoproduction cross section are accounted for with variations in the subprocess ratios and in the simulations and variations in the ratios and .
-
•
The shapes of the GD and DD mass spectra assumed in the simulations are individually reweighted by a factor . Those of the PD and DD processes are reweighted by a factor .
-
•
The simulated dependence is varied by changing the slope parameters by for EL, for GD and PD and for DD processes.
-
•
A variation is applied in the relative strengths of and production in the simulations.
-
•
Uncertainties in the correction for migration between the two intervals are estimated by varying the fragmentation scheme assumed in the simulations. An error is formed from the spread in corrections obtained using PHOJET, PYTHIA and DIFFVM in isotropic and longitudinal phase space modes.
-
•
The full difference between results obtained when correcting the data with the PHOJET and PYTHIA simulations is taken as the uncertainty in the modelling of the final state.
-
•
The errors on the luminosity measurements result in overall normalisation uncertainties of 1.7% for the nominal vertex samples and 5.4% for the shifted vertex samples.
-
•
The uncertainty in the acceptance of the eTag results in overall normalisation uncertainties of 3.5% averaged over the range and 6.0% for .
The systematic errors quoted for each data point are formed by adding in quadrature the variations in the measured cross section arising from each uncertainty.
6 Results
6.1 The differential cross sections
The measured differential cross sections are presented in figure 4. Figure 4a shows at , measured in 9 bins of in the range with and . Superimposed is the cross section integrated over the region and all , in 6 intervals in the range . The first interval in is chosen to cover the region of , and production. The second is constructed to contain the resonances [41]. For these two measurements an error bar, reflecting the width of the interval, is shown to account for uncertainties in the details of the resonance structure.333In the remaining intervals the largest deviation from a smooth dependence on is likely to arise from production, which contribute at the level of in the fourth interval [30]. For all but the first two intervals measurements are made in three bins per decade of . The results of the measurement at are shown in figure 4b. All cross section measurements are summarised in table 1.
(a) Bin Limits Stat. Syst. Stat. Syst. () () () () 0.504 ( ) — 2.52 ( ) ( ) 5.87 ( ) ( ) 12.7 ( ) ( ) 27.3 ( ) ( ) 58.7 ( ) ( ) 127 ( ) ( ) 273 ( ) ( ) 587 ( ) ( ) 1270 — ( )
(b) Bin Limits Stat. Syst. Stat. Syst. () () () () 0.504 ( ) — 2.52 ( ) ( ) 5.87 ( ) ( ) 12.7 ( ) ( ) 27.3 ( ) ( ) 58.7 ( ) ( )
At sufficiently large the measurements for in both ranges display an approximate dependence, though closer scrutiny reveals a more complex structure which is investigated in section 6.3. The distribution for falls slightly less steeply with increasing than that for . The cross section is enhanced considerably at the lowest values of and where elastic processes dominate [22].
Previous data exist on the differential cross section for [25]. Since the region is expected to be heavily dominated by this process, the low measurement is compared to fixed target data in section 6.3 and combined fits are performed using the Regge pole model described in section 6.2. The degree to which diffractive and non-diffractive exchanges contribute to the single photon dissociation process is investigated. The questions are addressed as to whether the intercept of the pomeron in such a model is consistent with that previously deduced from soft hadron-hadron and photoproduction interactions and whether any anomalous behaviour is necessary to explain the dependence of the diffractive contribution. The behaviour of the cross section for is discussed in section 6.4.
6.2 Triple-Regge model of photon dissociation
An appropriate framework in which to model dissociation processes is offered by ‘triple-Regge’ phenomenology. For the process may be treated with a Regge expansion. The amplitude at fixed is then a sum of amplitudes for the exchange of reggeons that produce all possible final states , as illustrated in figure 5a. The corresponding cross section contains products of flux factors for reggeons and and amplitudes (figure 5b). The generalised optical theorem [7] relates the sum over of these matrix elements to the forward amplitude for the process at an effective centre of mass energy . When is large by comparison with the hadronic mass scale , a Regge expansion is also appropriate for the photon-reggeon scattering amplitude, such that the dissociation cross section may be decomposed into triple-Regge terms as shown in figure 5c. The cross section may then be expressed as a sum of contributions with reggeons , and [8, 9, 10, 11]
| (5) |
The functions and are not predicted by the model and must be determined from experimental measurements. The trajectories are assumed to take the linear form . The phase of reggeon is determined by the signature factor, , where is the signature of the exchange. The signature factors are written as with the moduli absorbed into the parameters introduced in equation (6). For photoproduction reggeons and must have the same signature such that . As is customary the scale is set to . The functions may be factored into products of couplings each of the form444The couplings are expected to differ from those extracted from data by a factor .
| (6) |
where the terms describe the couplings of the reggeons to external particles and is the appropriate three-reggeon coupling. The dependence of the reggeon-proton and three-reggeon couplings are parameterised here as and .
The pomeron, with trajectory , is unique in Regge theory in that its intercept is significantly larger than those of all other reggeons. In the limit in which both and only the term survives and equation (5) reduces to
| (7) |
where . After the pomeron the next-leading reggeons have approximately degenerate trajectories and carry the quantum numbers of the , , and mesons.555The reggeons under consideration are hereafter referred to as , , , and . Their isospin, signature and C- and G-parities are , , , and . In this analysis the symbol is used to describe combinations of these four reggeons and a single effective trajectory is assumed.
With the two trajectories, and , equation (5) leads to a total of six terms with distinct and dependences. Table 2 lists each of these terms. Diffractive contributions are approximately independent of and correspond to the case in figure 5c where both reggeons and are the pomeron. In addition to the triple-pomeron diagram, a further diffractive term arises from the diagram. The reggeon must have the quantum numbers of the in order to satisfy the requirements of conservation of C-parity at the photon vertex and C- and G-parity at the three-reggeon vertex.
The two non-diffractive terms, and , may involve the exchange of any of , , or and are suppressed by factors like at fixed . The production of states that have different isospin or charge from the proton (, , , , , ) can only occur via isovector exchanges ( or ). Such processes are described, up to a normalisation, in the same way as processes that are elastic at the proton vertex, through those specific terms in table 2 marked with a star.
Since the and reggeons exchange identical quantum numbers they may inter-fere [42, 43, 44, 45, 46].666Only interference between the and reggeons is considered in this analysis. Since the photon is not an eigenstate of G-parity, interference between reggeons of opposite G-parity is in principle also possible. However, the dominance of two-pion final states at small suggests that the photon is dominated by and that the interference terms , and are likely to be small [47]. Such a contribution is expressed in terms of the ‘non-diagonal’ amplitudes, and where . The reggeon has previously been found to couple strongly to the proton [43] and since the interference terms have weaker dependences on than the non-diffractive contributions ( and ), they may be of particular significance in the high energy regime of the present measurement. Restrictions are imposed on the magnitudes of the interference relative to the non-interference terms through the inequality [48]
| (8) |
| Generic | Specific | Approx. | Approx. |
|---|---|---|---|
| term | terms | dependence | dependence |
The intercept of the pomeron is a free parameter in the fits presented here. A free fit for all other parameters is not practical with the limited photoproduction data available. Instead, information is taken from data on total and elastic cross sections. The intercept of the subleading trajectory is taken from the results of fits [24] to the centre of mass energy () dependence of total cross sections that use expressions of the form
| (9) |
The trajectory gradient is obtained from the shrinkage of the forward peak in high energy elastic scattering [49]. The slopes for all non-diffractive trajectories are assumed to be the same and the value of is taken from the result obtained for in analyses [50] of the reaction . The slope parameter is determined from elastic scattering measurements [49] in the regime of diffractive dominance using
| (10) |
where . The parameter is less well determined and is allowed to vary within a range that covers most of the results obtained in lower energy fits. Previous measurements [51] have found that the -dependence of the triple-pomeron coupling is weak compared to those of the external vertices, though less is known about the remaining three-reggeon couplings. It is assumed here that the dominant dependence of arises from the terms and uncertainties in the dependence of the three-reggeon couplings are accounted for by setting for all . Table 3 specifies the values assumed for the parameters that are kept fixed in the fits and the assigned uncertainties.
| Quantity | Value | Source | ||
|---|---|---|---|---|
| [24] | ||||
| [49] | ||||
| [50] | ||||
| [49] | ||||
| [8] | ||||
6.3 Regge analysis of the proton-elastic cross section
Large ranges in both and are required in order to investigate the importance of all six terms in table 2. To extend the range in simultaneous fits are performed to H1 and to fixed target data [25], where the quantity was presented at in the ranges and . For the data from [25] equation (5) is used at . For the H1 data equation (5) is integrated over the measured range, , where is the minimum kinematically accessible value of [52]. The parameters listed in table 3 are fixed and and the four couplings, , , and , are free fit parameters. In order to avoid the complications of the resonance region only data for which are included in the fits.
The additional contribution in the H1 data from events in which the proton dissociates with is accounted for by applying a factor of to equation (5) in the triple-Regge analysis for the H1 measurements only777No correction is necessary for the fixed target measurements, which were performed by tagging leading final state protons. There may be a contribution from protons arising from decays of and other resonances, though this effect is expected to be negligible [45].. This correction is determined by taking an average of the values expected in the PHOJET and PYTHIA models after weights have been applied which make the differential cross sections in the models agree with those measured (see section 4). The uncertainty in this correction is taken as the difference in the values obtained from the two models. The correction does not account for additional states that may be produced by isovector exchange, but cannot be produced by diffractive or other isoscalar exchange. Any contribution from these states would increase the couplings and for the H1 measurement relative to the fixed target data (see table 2).
No good solutions are found when diffractive terms only are considered. In a fit in which the pomeron alone contributes, equivalent to equation (7) with and as free parameters, the made from statistical errors is . When both terms and are included, the result is . We conclude that significant non-diffractive contributions are needed to explain the measured cross sections.
(a)
Correlation coefficients
Parameter
Value
Stat.
Syst.
Model
1.031
(b)
Correlation coefficients
Parameter
Value
Stat.
Syst.
Model
1.101
(c)
Correlation coefficients
Parameter
Value
Stat.
Syst.
Model
1.071

Three scenarios are examined in which subleading as well as diffractive contributions are considered. In fit (a) it is assumed that there is no interference between the diffractive and non-diffractive exchanges and that there is no contribution from isovector reggeons. Only the first four generic terms in table 2 are included and the and terms have the same normalisation at all values. Such a situation would be expected to occur if the were the dominant subleading reggeon. The fit parameters are shown in table 4a. All experimental uncertainties are combined to determine the quoted systematic errors. The model dependence errors arise from the uncertainties in the parameters listed in table 3 and from the uncertainty in the correction from . All systematic and model dependence uncertainties are estimated from the differences between the main fit results and those obtained with the appropriate shifts imposed.
Interference is introduced in fit (b) by including the and terms. Following [53, 45, 46] two-component duality is assumed in the reggeon-photon scattering amplitude, such that the diagonal and non-diagonal terms are separately related for and . Maximal coherence is assumed and, through equation (8), the interference couplings at are parameterised as and . This represents the scenario in which the is the dominant subleading exchange and the and the pomeron couple similarly to the proton [43, 44]. The results are presented in table 4b and figure 6.
In fit (c) effects arising from isovector exchanges are investigated. The interference terms are not included, but the non-diffractive terms ( and ) are allowed to be different in the H1 and the fixed target data. This accounts for possible additional contributions to the H1 data from the specific terms in table 2 that are marked with a star. A further free fit parameter is therefore introduced, defined as the ratio of the sum of the couplings + in the H1 data to that in the fixed target data. If there were no isovector contribution to the subleading exchanges, then it would be expected that . The presence of or exchanges would increase . The results of the fit are presented in table 4c.
From table 4 it can be seen that all three fits are acceptable. This demonstrates that the triple Regge model gives a satisfactory description of both the and the dependence of the existing data on photon dissociation, with the pomeron intercept in excess of unity. The value decreases markedly in fits (b) and (c) relative to (a). This may suggest a preference for either a large interference or a large isovector contribution to the subleading terms, or else a mixture of the two. However, in light of the systematic and model dependence uncertainties, little can be said with any degree of certainty about the nature of the non-diffractive terms. Leading neutron measurements and data at different centre of mass energies would clarify the situation. There are also further uncertainties; pion exchange may be relevant in the fixed target data [42], and measurements at HERA with tagged final state protons would be necessary to eliminate systematic effects arising from the correction from to the elastic proton vertex. All of the fits give a contribution that is consistent with zero, in agreement with previous analyses of and data [42, 48, 46, 54].
The magnitude of the diffractive component at low is difficult to constrain in light of the uncertainties. In the fits presented here, the diffractive contribution to the integrated cross section for varies between and at , depending on the assumptions regarding the nature of the subleading exchange. It is interesting to note that the value of , obtained from a fit with a more empirical treatment of non-diffractive contributions performed by [25], is larger than any of the values found in this analysis.
The diffractive contribution at HERA energies and the pomeron intercept are significantly better constrained. A single value for the pomeron intercept is obtained by taking an average of the three fits. The result is , where the errors are statistical, systematic and model related respectively. The spread of values in the three different fits is included in the model dependence uncertainty and represents the dominant contribution to the quoted error. The value of obtained is similar to those extracted from hadronic cross sections that are governed by a soft pomeron ( [24]).
In analyses of dissociation cross sections extending to centre of mass energies an order of magnitude in excess of those investigated here [15], evidence was found of a need for unitarity corrections in the form of a very shallow centre of mass energy dependence. The dependence was found to be described by the same pomeron intercept as the total cross section. The uncertainties associated with the secondary exchanges in this analysis prohibit firm conclusions regarding screening effects for photoproduction. Although fit (a), in which neither isovector exchange nor interference is considered, yields a value of in the region that might be expected if screening corrections were important [55], the value is larger in fits (b) and (c) and in all three fits presented here, the and dependences are well described with a single value for .
The diffractive cross section for the process with is obtained at by integrating the diffractive terms ( and ) in equation (5), with the values for the coupling constants and pomeron intercept taken from the fits listed in table 4. The results of the three fits are averaged to obtain
| (11) |
Since there is negligible non-diffractive contribution to the cross section in the region , which is omitted in the fits, the corresponding measured cross section is added to that in equation (11) to obtain the integrated cross section for the sum of elastic and single photon dissociation processes. The correction from to the fully elastic case is again obtained from an average of the two Monte Carlo simulations after tuning to match the data. A correction factor of is applied in the second interval and in the first. The latter figure is smaller than the correction used for the remaining intervals because of the fast fall-off with increasing in the low region, apparent in figure 4 and discussed in section 6.4. A correction of , estimated from the di-pion line shape [22], is added to account for the component of the cross section with , which is not measured. The integrated diffractive proton-elastic cross section is found to be
| (12) |
This result is consistent, within errors, with the previous H1 measurement [20]. The diffractive contribution from the process to the total photoproduction cross section for and is .
6.4 The proton-dissociation cross section
No previous data or firm theoretical predictions exist that can easily be related to the measurement with . When both and are large a triple-Regge analysis is in principle possible [8, 9], though even with only two trajectories there are a total of twelve terms with distinct dependences on , and . The measured double dissociation cross section is integrated over a large region in . A full decomposition into diffractive and non-diffractive components is not practical without additional assumptions as to the ill-constrained behaviour of the cross section in the low region, the relative coupling strengths of various reggeons to the photon and the proton and the dependence of triple-Regge couplings. However, as discussed below, certain features of the large measurements made here are as might be expected from the conclusions obtained in the more detailed analysis of the proton-elastic cross section.
From the measurements for with it is found that the diffractive cross section in the elastic region is significantly larger than that integrated over larger values of (compare equations (11) and (12) ). A similar pattern is observed in the dependence on at low . The cross section integrated over the range and is around 3.5 times larger than that for the same region and . This clearly demonstrates the suppression of the cross section for light vector meson production when the proton dissociates compared to that when it remains intact. A similar behaviour is observed in the ratios of cross sections for the processes and [15, 49].
Non-diffractive exchanges are likely to become more important with increasing as well as with increasing . This assertion is supported by the observation that the cross section for falls less steeply with increasing than that for (see figure 4). In contrast to the vector meson region, the differential cross sections in the two ranges of are similar in magnitude for . With the present experimental accuracy the large cross section is well described in the measured region by a power law of the form . In fits to this expression for , a value is obtained at and at .
7 Summary
A measurement of the cross section for the inclusive process has been made at a centre of mass energy more than an order of magnitude larger than previously. A clear peak in the cross section is observed at the lowest values of and , corresponding to the elastic reaction . The cross section falls rapidly in this region as either or is increased. At larger values of an approximate dependence is observed, both where is dominantly a single proton and where it has larger masses, though the fall in the cross section is steeper when is small.
For the data with small and moderately large , a triple-Regge decomposition of the cross section has been presented. Despite the simplifications necessary, it has been shown that triple-Regge parameterisations provide a good description of both the and the dependence of available photoproduction data, with parameters constrained by other processes to which Regge phenomenology is applicable. The data fitted do not lie in the asymptotic regime in which only the pomeron need be considered. An important feature of the model is that it provides a self-consistent treatment of both diffractive and non-diffractive contributions.
In various model scenarios investigated, the dominant exchange at and small is found to be diffractive. At the largest dissociation masses accessed, the need for a non-diffractive contribution is apparent, which may be described with an effective trajectory close to . More measurements at different centre of mass energies or particle identification in the system are required if the precise nature of the subleading exchanges is to be determined.
The pomeron intercept is found to be in good agreement with values extracted from total and elastic hadronic cross sections. In global fits to H1 and fixed target data, a value is obtained. The ‘model dependence’ error arises predominantly from the spread of values when different scenarios are considered for the subleading terms. The cross section for diffractive processes of the type for is found to be at , representing of the total photoproduction cross section.
The double dissociation cross section in the range and for behaves approximately as . For a fit to this form yields . The shallowing of this dependence relative to that for the proton-elastic case may be related to large non-diffractive contributions.
Acknowledgements
We have enjoyed the benefit of several illuminating discussions with E. Levin and of fruitful correspondence with P. Landshoff. We have also received valuable comments from E. Gotsman, A. Kaidalov, U. Maor and M. Strikman. We are grateful to the HERA machine group whose outstanding efforts make this experiment possible. We appreciate the hard work of the engineers and technicians who constructed and now maintain the H1 detector. We thank our funding agencies for their financial support and the DESY directorate for the hospitality that they extend to the non-DESY members of the collaboration.
References
-
[1]
J. Sakurai, Ann. Phys. 11 (1960) 1.
D. Yennie, Rev. Mod. Phys. 47 (1975) 311. -
[2]
T. Regge, Nuovo Cimento 14 (1959) 951.
T. Regge, Nuovo Cimento 18 (1960) 947. - [3] G. Chew, S. Frautschi, S. Mandelstam, Phys. Rev. 126 (1962) 1202.
- [4] G. Chew, S. Frautschi, Phys. Rev. Lett. 7 (1961) 394.
-
[5]
E. Feinberg, I. Pomeranc̆uk,
Suppl. Nuovo Cimento 3 (1956) 652.
M. Good, W. Walker, Phys. Rev. 120 (1960) 1857. -
[6]
For example, H. Miettinen, J. Pumplin,
Phys. Rev. D18 (1978) 1696;
K. Dederichs, M. Faessler, Phys. Lett. B232 (1989) 405. - [7] A. Mueller, Phys. Rev. D2 (1970) 2963.
- [8] A. Kaidalov, Phys. Rep. 50 (1979) 157.
- [9] G. Alberi, G. Goggi, Phys. Rep. 74 (1981) 1.
- [10] K. Goulianos, Phys. Rep. 101 (1983) 169.
- [11] N. Zotov, V. Tsarev, Sov. Phys. Usp. 31 (1988) 119.
-
[12]
UA4 Collaboration, M. Bozzo et al., Phys. Lett. B136 (1984) 217.
UA4 Collaboration, D. Bernard et al., Phys. Lett. B186 (1987) 227. - [13] UA5 Collaboration, R. Ansorge et al., Z. Phys. C33 (1986) 175.
- [14] E-710 Collaboration, N. Amos et al., Phys. Lett. B301 (1993) 313.
- [15] CDF Collaboration, F. Abe et al., Phys. Rev. D50 (1994) 5535.
- [16] J. Pumplin, Phys. Rev. D8 (1973) 2899.
- [17] A. Kaidalov, L. Ponomarev, K. Ter-Martirosyan, Sov. J. Nucl. Phys. 44 (1986) 468.
- [18] E. Gotsman, E. Levin, U. Maor, Z. Phys. C57 (1993) 667.
- [19] ZEUS Collaboration, M. Derrick et al., Z. Phys. C63 (1994) 391.
- [20] H1 Collaboration, S. Aid et al., Z. Phys. C69 (1995) 27.
- [21] ZEUS Collaboration, M. Derrick et al., Z. Phys. C69 (1995) 39.
- [22] H1 Collaboration, S. Aid et al., Nucl. Phys. B463 (1996) 3.
-
[23]
ZEUS Collaboration, M. Derrick et al., Phys. Lett. B377 (1996) 259.
ZEUS Collaboration, M. Derrick et al., Z. Phys. C73 (1996) 73. - [24] A. Donnachie, P. Landshoff, Phys. Lett. B296 (1992) 227.
- [25] T. Chapin et al., Phys. Rev. D31 (1985) 17.
-
[26]
H1 Collaboration, I. Abt et al., DESY 93-103 (July 1993).
H1 Collaboration, I. Abt et al., Internal Report, DESY H1-96-01 (March 1996), to be published in Nucl. Inst. and Meth. - [27] H1 Collaboration, T. Ahmed et al., Phys. Lett. B348 (1995) 681.
-
[28]
H1 Collaboration, S. Aid et al., Z. Phys. C70 (1996) 609.
H1 Collaboration, S. Aid et al., Nucl. Phys. B468 (1996) 3. - [29] H1 Collaboration, S.Aid et al., Nucl. Phys. B463 (1996) 3.
- [30] H1 Collaboration, S. Aid et al., Nucl. Phys. B472 (1996) 3.
-
[31]
R. Engel, Z. Phys. C66 (1995) 203.
R. Engel, J. Ranft, Phys. Rev. D54 (1996) 4244. -
[32]
H. Bengtsson, T. Sjöstrand,
Comp. Phys. Commun. 46 (1987) 43.
H. Bengtsson, T. Sjöstrand, Comp. Phys. Commun. 82 (1994) 74. - [33] T. Bauer et al., Rev. Mod. Phys. 50 (1978) 261.
- [34] M. Ross, L. Stodolsky, Phys. Rev. 149 (1966) 1172.
- [35] G. Schuler, T. Sjöstrand, Nucl. Phys. B407 (1993) 539.
-
[36]
T. Sjöstrand, Comp. Phys. Commun. 39 (1986) 347.
T. Sjöstrand, M. Bengtsson, Comp. Phys. Commun. 43 (1987) 367. - [37] A. Sanda, Phys. Rev. D6 (1972) 280.
- [38] M. Greco, Nucl. Phys. B63 (1973) 398.
- [39] B. List, “Diffraktive –Produktion in Elektron–Proton–Stößen am Speicherring HERA”, Diploma Thesis (Tech. Univ. Berlin), 1993 (unpublished).
-
[40]
C. Weizsäcker, Z. Phys. 88 (1934) 612.
E. Williams, Phys. Rev. 45 (1934) 729.
S. Frixione et al., Phys. Lett. B319 (1993) 339. - [41] A. Donnachie, H. Mirzaie, Z. Phys. C33 (1987) 407.
- [42] R. Field, G. Fox, Nucl. Phys. B80 (1974) 367.
- [43] A. Donnachie, P. Landshoff, Nucl. Phys. B244 (1984) 322.
- [44] T. Inami, R. Roberts, Nucl. Phys. B93 (1975) 497.
- [45] Yu. Kazarinov et al., Sov. Phys. JETP 43 (1976) 598.
- [46] K. Hidaka, Phys. Rev. D16 (1977) 690.
- [47] K. Watson, Phys. Rev. 85 (1952) 852.
- [48] D. Roy, R. Roberts, Nucl. Phys. B77 (1974) 240.
- [49] CDF Collaboration, F. Abe et al., Phys. Rev. D50 (1994) 5518.
- [50] W. Apel et al., Nucl. Phys. B154 (1979) 189.
- [51] For example, R. Cool et al., Phys. Rev. Lett. 47 (1981) 701.
- [52] Particle Data Group, L. Montanet et al., Phys. Rev. D54 (1996) 177.
- [53] M. Einhorn, M. Green, M. Virasoro, Phys. Rev. D7 (1973) 102.
- [54] S. Chu et al., Phys. Rev. D13 (1976) 2967.
- [55] E. Gotsman, E. Levin, U. Maor, Phys. Lett. B347 (1995) 424.