Production in Two-photon Interactions at CLEO
Abstract
Using the CLEO detector at the Cornell storage ring, CESR, we study the two-photon production of , making the first observation of . We present the cross-section for as a function of the center of mass energy and compare it to that predicted by the quark-diquark model.
pacs:
12.38.-t, 12.38.Qk, 12.39.-x, 13.60.Rj, 13.60.-r, 14.20.JnCLEO Collaboration
S. Anderson,1 Y. Kubota,1 M. Lattery,1 J. J. O’Neill,1 S. Patton,1 R. Poling,1 T. Riehle,1 V. Savinov,1 A. Smith,1 M. S. Alam,2 S. B. Athar,2 Z. Ling,2 A. H. Mahmood,2 H. Severini,2 S. Timm,2 F. Wappler,2 A. Anastassov,3 S. Blinov,3,***Permanent address: BINP, RU-630090 Novosibirsk, Russia. J. E. Duboscq,3 D. Fujino,3,†††Permanent address: Lawrence Livermore National Laboratory, Livermore, CA 94551. R. Fulton,3 K. K. Gan,3 T. Hart,3 K. Honscheid,3 H. Kagan,3 R. Kass,3 J. Lee,3 M. B. Spencer,3 M. Sung,3 A. Undrus,3,∗ R. Wanke,3 A. Wolf,3 M. M. Zoeller,3 B. Nemati,4 S. J. Richichi,4 W. R. Ross,4 P. Skubic,4 M. Wood,4 M. Bishai,5 J. Fast,5 E. Gerndt,5 J. W. Hinson,5 N. Menon,5 D. H. Miller,5 E. I. Shibata,5 I. P. J. Shipsey,5 M. Yurko,5 L. Gibbons,6 S. D. Johnson,6 Y. Kwon,6 S. Roberts,6 E. H. Thorndike,6 C. P. Jessop,7 K. Lingel,7 H. Marsiske,7 M. L. Perl,7 S. F. Schaffner,7 D. Ugolini,7 R. Wang,7 X. Zhou,7 T. E. Coan,8 V. Fadeyev,8 I. Korolkov,8 Y. Maravin,8 I. Narsky,8 V. Shelkov,8 J. Staeck,8 R. Stroynowski,8 I. Volobouev,8 J. Ye,8 M. Artuso,9 A. Efimov,9 F. Frasconi,9 M. Gao,9 M. Goldberg,9 D. He,9 S. Kopp,9 G. C. Moneti,9 R. Mountain,9 Y. Mukhin,9 S. Schuh,9 T. Skwarnicki,9 S. Stone,9 G. Viehhauser,9 X. Xing,9 J. Bartelt,10 S. E. Csorna,10 V. Jain,10 S. Marka,10 A. Freyberger,11 D. Gibaut,11 R. Godang,11 K. Kinoshita,11 I. C. Lai,11 P. Pomianowski,11 S. Schrenk,11 G. Bonvicini,12 D. Cinabro,12 R. Greene,12 L. P. Perera,12 B. Barish,13 M. Chadha,13 S. Chan,13 G. Eigen,13 J. S. Miller,13 C. O’Grady,13 M. Schmidtler,13 J. Urheim,13 A. J. Weinstein,13 F. Würthwein,13 D. M. Asner,14 D. W. Bliss,14 W. S. Brower,14 G. Masek,14 H. P. Paar,14 M. Sivertz,14 J. Gronberg,15 R. Kutschke,15 D. J. Lange,15 S. Menary,15 R. J. Morrison,15 S. Nakanishi,15 H. N. Nelson,15 T. K. Nelson,15 C. Qiao,15 J. D. Richman,15 D. Roberts,15 A. Ryd,15 H. Tajima,15 M. S. Witherell,15 R. Balest,16 B. H. Behrens,16 K. Cho,16 W. T. Ford,16 H. Park,16 P. Rankin,16 J. Roy,16 J. G. Smith,16 J. P. Alexander,17 C. Bebek,17 B. E. Berger,17 K. Berkelman,17 K. Bloom,17 D. G. Cassel,17 H. A. Cho,17 D. M. Coffman,17 D. S. Crowcroft,17 M. Dickson,17 P. S. Drell,17 K. M. Ecklund,17 R. Ehrlich,17 R. Elia,17 A. D. Foland,17 P. Gaidarev,17 R. S. Galik,17 B. Gittelman,17 S. W. Gray,17 D. L. Hartill,17 B. K. Heltsley,17 P. I. Hopman,17 S. L. Jones,17 J. Kandaswamy,17 N. Katayama,17 P. C. Kim,17 D. L. Kreinick,17 T. Lee,17 Y. Liu,17 G. S. Ludwig,17 J. Masui,17 J. Mevissen,17 N. B. Mistry,17 C. R. Ng,17 E. Nordberg,17 M. Ogg,17,‡‡‡Permanent address: University of Texas, Austin TX 78712 J. R. Patterson,17 D. Peterson,17 D. Riley,17 A. Soffer,17 C. Ward,17 M. Athanas,18 P. Avery,18 C. D. Jones,18 M. Lohner,18 C. Prescott,18 S. Yang,18 J. Yelton,18 J. Zheng,18 G. Brandenburg,19 R. A. Briere,19 Y.S. Gao,19 D. Y.-J. Kim,19 R. Wilson,19 H. Yamamoto,19 T. E. Browder,20 F. Li,20 Y. Li,20 J. L. Rodriguez,20 T. Bergfeld,21 B. I. Eisenstein,21 J. Ernst,21 G. E. Gladding,21 G. D. Gollin,21 R. M. Hans,21 E. Johnson,21 I. Karliner,21 M. A. Marsh,21 M. Palmer,21 M. Selen,21 J. J. Thaler,21 K. W. Edwards,22 A. Bellerive,23 R. Janicek,23 D. B. MacFarlane,23 K. W. McLean,23 P. M. Patel,23 A. J. Sadoff,24 R. Ammar,25 P. Baringer,25 A. Bean,25 D. Besson,25 D. Coppage,25 C. Darling,25 R. Davis,25 N. Hancock,25 S. Kotov,25 I. Kravchenko,25 and N. Kwak25
1University of Minnesota, Minneapolis, Minnesota 55455
2State University of New York at Albany, Albany, New York 12222
3Ohio State University, Columbus, Ohio 43210
4University of Oklahoma, Norman, Oklahoma 73019
5Purdue University, West Lafayette, Indiana 47907
6University of Rochester, Rochester, New York 14627
7Stanford Linear Accelerator Center, Stanford University, Stanford, California 94309
8Southern Methodist University, Dallas, Texas 75275
9Syracuse University, Syracuse, New York 13244
10Vanderbilt University, Nashville, Tennessee 37235
11Virginia Polytechnic Institute and State University, Blacksburg, Virginia 24061
12Wayne State University, Detroit, Michigan 48202
13California Institute of Technology, Pasadena, California 91125
14University of California, San Diego, La Jolla, California 92093
15University of California, Santa Barbara, California 93106
16University of Colorado, Boulder, Colorado 80309-0390
17Cornell University, Ithaca, New York 14853
18University of Florida, Gainesville, Florida 32611
19Harvard University, Cambridge, Massachusetts 02138
20University of Hawaii at Manoa, Honolulu, Hawaii 96822
21University of Illinois, Champaign-Urbana, Illinois 61801
22Carleton University and the Institute of Particle Physics, Ottawa, Ontario, Canada K1S 5B6
23McGill University and the Institute of Particle Physics, Montréal, Québec, Canada H3A 2T8
24Ithaca College, Ithaca, New York 14850
25University of Kansas, Lawrence, Kansas 66045
Two-photon interactions are a useful tool for the study of the strong interaction. At CLEO we use two-photon interactions to test calculations of strong processes as well as the understanding of hadron structure. CLEO has previously measured the cross-section for [2]. Extending this analysis, in this paper we report on the study of .
Using the Brodsky-Lepage hard-scattering approach [1], predictions have been made for the two-photon production of baryons. The CLEO measurement of the cross-section was inconsistent with the prediction of a pure quark model [3] at energies available to CLEO, but was consistent with the prediction of the quark-diquark model [4, 5]. We compare the measured cross-section to that predicted by these models.
CLEO II is a general purpose detector[6] using the storage ring, CESR[7], operating at GeV. CLEO II contains three concentric wire chambers that detect charged particles over 95% of the solid angle. Particle identification is performed using specific ionization energy loss (dE/dx) in the outer wire chamber. A superconducting solenoid provides a magnetic field of 1.5 T, giving a momentum resolution of for GeV. Outside of the wire chambers and a time of flight system, but inside the solenoid, is a CsI electromagnetic calorimeter, consisting of 7800 crystals arranged as two endcaps and a barrel. For a 100 MeV electromagnetic shower in the barrel, the calorimeter achieves an energy resolution of .
Kinematics of two-photon events are strongly influenced by the fact that the initial state photons are approximately real and tend to have a large fraction of their momenta along the beam line. A typical of the photons is , where is the photon four-momentum. Consequently, the two-photon axis is approximately the beam axis, and the electron and positron rarely have enough transverse momentum to be observed. The two photons have rather unequal energies, causing the center of mass to be boosted along the beam axis. As the available energy in the decay is small, and the cross-section is peaked near the threshold, the decay products, , usually have relatively low transverse momentum. We select those events in which all four hadronic tracks are observed in CLEO.
In our analysis of of data, we use the following selection criteria to minimize background. We select 4 track events in which the charge sum is zero. We require the candidate proton and antiproton to have dE/dx measurements consistent with that of a proton. We require that the event energy, using these particle assignments, is less than 6.0 GeV and that the transverse component of the vector sum of the track momenta is less than 0.6 GeV/c. We veto events in which the candidate or vertex is at the radius of the beam pipe. We also place a requirement on the transverse impact parameters of the reconstructed and with respect to the transverse beam position; their root sum square must be less than 1.0 cm. Finally, cross-section predictions[4, 8] have been made for , where is the angle between the momentum and the two-photon axis in the two-photon center of mass frame. In order to compare with theory and with measurements, we impose the same requirement on the data. As the acceptance of the detector decreases quickly beyond , this requirement does not significantly affect the event yield. After applying these selection criteria, there is a clear enhancement in plane at the point.
To verify that the reconstructed particles are predominantly ’s and ’s produced in two-photon interactions, a number of data and Monte Carlo distributions have been compared, including event energy, decay distance, momentum angular distribution, proper decay length, acoplanarity, acolinearity, proton momentum, and pion momentum. In all cases there is good agreement between the data and the expected distributions.
The signal and background two-photon Monte Carlo events were generated using a program based on the BGMS formalism[9]. The simulation of the transport and decay of the final state particles through the CLEO detector is performed by a GEANT-based detector simulator[10].
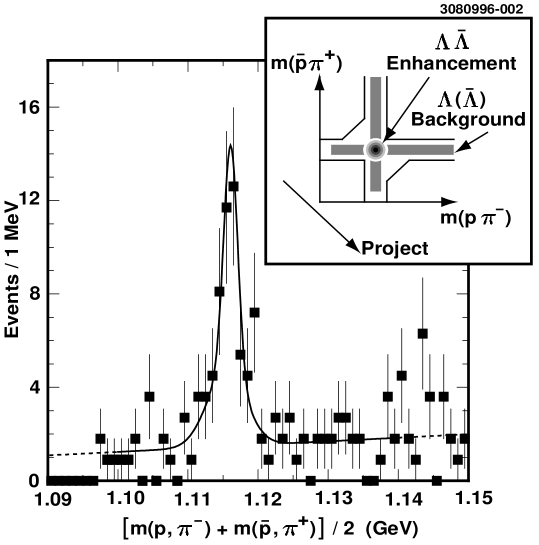
We use the mass average, , to measure the number of signal events[11]. Viewed geometrically, the mass average rotates the plane by and then scales the projected value by ; see Figure 1. The advantage of this approach is that it naturally maps backgrounds from -fake, fake-, and fake-fake into smooth backgrounds in the mass average plot which are then easier to subtract when fitting.
We reduce the fake-fake background by making a geometric selection in the plane before the projection. We require that events are within 6 MeV, nearly times the mass resolution, of the mass for either axis. This simple cross geometry would underestimate fake-fake background near the enhancement. To compensate for this, we extend our geometric criteria at the intersection of the cross so that the area along the projected direction is a constant. This approach is valid as the fake-fake background does not vary significantly near the enhancement.
Using a signal shape fit to the mass average distribution of the Monte Carlo combined with a linear background, we measure events in data. The fit and data are displayed in Figure 1.
Due to reduced sensitivity to other channels and the steep dependence of two-photon production, the dominant source of feeddown into the observed signal comes from the two-photon production of , or , where is the two-photon center of mass energy. At this point we have not used final state photon information to distinguish between the four possible final states for which we use this parenthetical notation to indicate alternative processes.
In order to measure the cross-section we apply the projection technique to the selected data and Monte Carlo events with the addition that we bin in , the effective mass of the and . If the source of the signal is , then . We fit to the background excluding the signal region and subtract this from the number of events within the signal region, which is within about 3 times the mass resolution of the mass. The number of events summed over all bins is constrained to be 51.0, the total number of events measured. We have estimated the systematic uncertainty associated with binning, selection criteria, and background shape. The non-negligible sources of uncertainty are associated with triggering, , tracking, , and event selection, . Assuming that these are independent, gives a quadrature sum of , which is conservative in this case.
We find the cross-section in each bin of by correcting the observed yield in that bin by the efficiency obtained from the Monte Carlo simulation. Summing these we find the total cross-section for to be . The first error is statistical, dominated by the statistics of the first bin, the second is the systematic uncertainty discussed above. This corresponds to an overall efficiency of .
To correctly extract a cross-section, the contamination from feeddown into the observed signal must be removed. As the statistics are limited, we do not use the mass average technique, but instead we search for either a in the events that pass all selection criteria described above and that lie within a radius of the point in the plane. To search for we combine each or with selected photon candidates in the event, using the notation to indicate either a or .
We only consider photon candidates in the crystal barrel. The energy associated with the photon candidate must be within the range 40 MeV to 180 MeV. Each candidate photon must not be matched with an observed charged track, and we apply the stricter requirement that the cosine of the angle between the candidate photon and the shower matched with the anti-proton track must be less than . To reduce background from hadronic interactions, we require that the ratio of energy deposited in the central 9 crystals to that in the central 25 crystals must be .
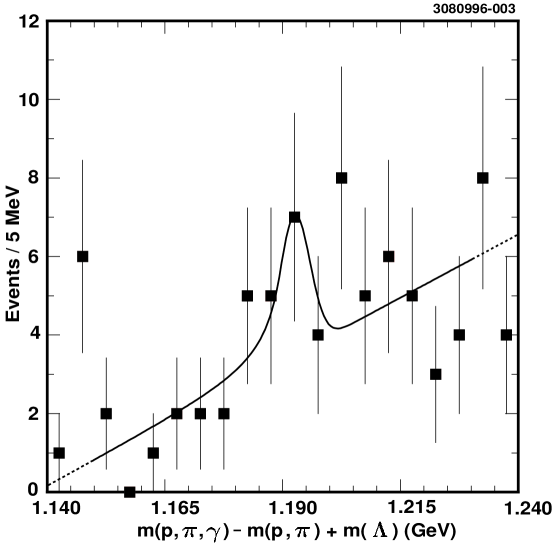
For each we construct which has better resolution than . We use a signal shape fit to the Monte Carlo distribution combined with a linear background to fit the data. From the distribution in Figure 2 we measure the number of to be . As the statistical uncertainty associated with this measurement is very large, the systematic uncertainty is not significant. Although consistent with zero, this value will be used to estimate feeddown into the measurement.
Due to the low statistics of the measurement, we can not determine the ratio of to . We assume that the processes and each contribute half. We assign the difference between the number given by the above mixture of processes and that using the assumption that all observed events were produced by as the systematic uncertainty. Given the above ratio of contributions, we estimate the number of contamination events by multiplying the observed number of by and by the ratio of the detection efficiency to the detection efficiency in events. We have used the fact that the efficiency for finding a in events is approximately twice that for finding in events. The estimated number of non- contamination events is , giving a contamination correction scale factor of . Applying this factor to the cross-section we extract an exclusive cross-section of pb for .
To calculate the cross-section we scale the measured signal using,
| (1) |
to account for photon flux and efficiency, in each bin. We correct the cross-section using our estimate of the the contamination. The distribution observed in data is a good model for the distributions of the and contamination. Consequently, we can apply the contamination correction scale factor bin by bin. The results are shown in Table I. An additional systematic uncertainty associated with the uncertainty of the feeddown distribution is included.
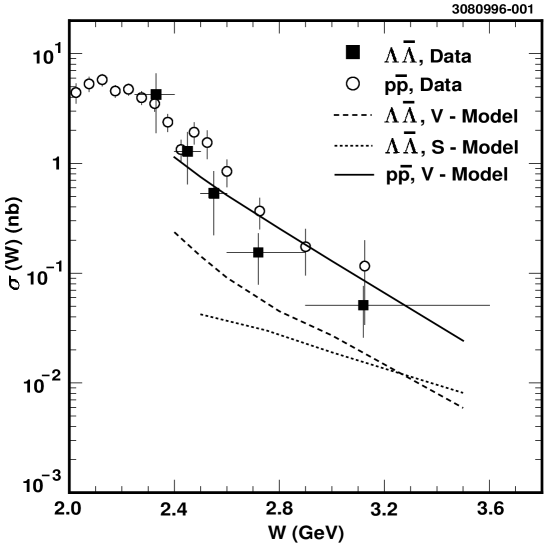
The predicted cross-sections appear to disagree with this measurement. Due to the failure of the of pure-quark calculation to accurately predict the cross-section for at values of that we probe, we do not anticipate that it can accurately predict the cross-section for [3]. However, the quark-diquark model is constructed to predict the cross-section in this energy regime. This model includes nonperturbative effects through the use of the diquark, a bound state within the baryon. The original calculations were performed using only scalar diquarks [4]. More recent calculations include both scalar and vector diquarks [5, 8]. In the energy regime near threshold, the quark-diquark model is also expected to fail.
The extracted exclusive cross-section, the previously measured cross-section, and the predictions of the model are displayed in Figure 3 as a function of for . We place the horizontal location of the cross-section data points at the weighted mean of in the bin based on a distribution. We do not display the predictions of the pure-quark calculation, which are much smaller than the quark-diquark predictions for both and . The unexpected result is that the production of appears to be consistently larger than the prediction of the quark-diquark model. In the three bins above 2.5 GeV the vector quark-diquark model predicts that we should observe events, but in data we observe 32 events.
| [GeV] | [nb] |
|---|---|
In this paper we presented the first observation of . We measured the cross-section, and the cross-section as a function of , each for . The measured cross-section appears to be larger than that predicted by either the quark-diquark model or the pure-quark calculation over the observed range of .
We thank P. Kroll and W. Schweiger for access to their calculations. We gratefully acknowledge the effort of the CESR staff in providing us with excellent luminosity and running conditions. This work was supported by the National Science Foundation, the U.S. Department of Energy, the Heisenberg Foundation, the Alexander von Humboldt Stiftung, the Natural Sciences and Engineering Research Council of Canada, and the A. P. Sloan Foundation.
REFERENCES
- [1] G. P. Lepage and S. J. Brodsky, Phys. Rev. D22 2157 (1980).
- [2] CLEO Collaboration, M. Artuso et al., Phys. Rev. D 50, 5484 (1994).
- [3] G. Farrar et al., Nucl. Phys. B259, 702 (1985); B263, 746(E) (1986).
- [4] M. Anselmino, F. Caruso, P. Kroll, and W. Schweiger, Int. J. Modern Phys. A. 4, 5213 (1989).
- [5] P. Kroll, T. Pilsner, M. Schürmann, and W.Schweiger, Phys. Lett. B 316, 546 (1993).
- [6] CLEO Collaboration, Y.Kubota et al. Nucl. Instr. & Meth. A320, 66 (1992).
- [7] D. Rubin, Proceedings of the 1995 Particle Accelerator Conference 1, 481 (1995).
- [8] Cross-section including vector diquarks via private communication with P. Kroll and W. Schweiger (1995).
- [9] V. M. Budnev, I. F. Ginzburg, G. V. Meledin, and V. G. Serbo, Phys. Rep. 15C, 181 (1975).
- [10] R.Brun et al., “GEANT3 Users Guide,” CERN DD/EE/84-1 (1987).
- [11] H. P. Paar representing the CLEO Collaboration, in Photon ’95, Gamma-Gamma Collisions and Related Processes, edited by D. J. Miller et al., (World Scientific, 1995).