A Study of Cosmic Ray Composition in the Knee Region using Multiple Muon Events in the Soudan 2 Detector
Abstract
Deep underground muon events recorded by the Soudan 2 detector, located at a depth of 2100 meters of water equivalent, have been used to infer the nuclear composition of cosmic rays in the “knee” region of the cosmic ray energy spectrum. The observed muon multiplicity distribution favors a composition model with a substantial proton content in the energy region GeV/nucleus.
pacs:
96.40.Tv,96.40.De,98.70.SaI Introduction
The composition of the cosmic rays in the “knee” ( TeV/nucleus) region of the cosmic ray all-particle spectrum has consequences for astrophysical models of particle acceleration and propagation. For example, a model of accretion onto a black hole in the center of an Active Galactic Nucleus predicts an excess of protons around the knee region in the cosmic ray flux [1], while a model of shock acceleration during a supernova blast into a stellar wind environment predicts an excess of heavy nuclei in the cosmic ray flux in the same energy region [2].
Unfortunately, the composition at energies above TeV/nucleus is difficult to measure directly due to the steeply falling spectrum of cosmic ray primaries. The flux of particles with energies greater than 1000 TeV/nucleus is only 60/m2/sr/year. Therefore measurements of cosmic rays in this energy regime require detectors of either very large acceptance or long exposure, neither of which is currently feasible for measurements near the top of the atmosphere or above. Instead, studies of the composition of cosmic ray primaries in this high energy regime can be carried out indirectly through measurements of aspects of the atmospheric cascade generated by the interaction of a cosmic ray primary with the earth’s atmosphere.
Deep underground experiments, such as Soudan 2, indirectly study the composition of cosmic rays by comparing observations of multiple muon event rates to expectations derived through Monte Carlo simulations using various trial composition models as input. A multiple muon event is one in which two or more nearly parallel, time-coincident muon tracks are observed in the detector. These muons are decay products of mesons which are generated in the hadronic core of the atmospheric cascade. At high energies, massive primaries generate more high energy muons per event than proton primaries of the same total energy. This is because the initial parent meson (predominantly pion) particle multiplicities are larger from the more massive primary, and the atmosphere is more favorable to pion decay versus interaction early in the cascade development. In addition, the point of first interaction of the heavy primary is likely to be higher in the atmosphere than for the proton primary due to the larger cross-section of the heavy nucleus-air interactions.
At the Soudan site, the measurement of the high energy muon component underground is coupled with sampling of the electromagnetic component of the air shower at the surface using a small proportional tube array [3], and a Cherenkov light detector array [4]. A correct interpretation of the cosmic ray composition should yield consistent results using all three experimental techniques in all possible combinations.
In this paper, we report on an analysis in which the observed multiple muon event rates recorded in the Soudan 2 detector are compared with the simulated rates obtained using three distinct trial composition models. The next section of this paper contains a brief description of the relevant aspects of the detector. In Sec. III, we report on the analysis of the observed multiple muon event rates. Sec. IV contains a discussion of the Monte Carlo simulation. Sec. V has a discussion of the test composition models used in this analysis and a comparison between the data multiple muon rates and the rates observed using these models. Finally, Sec. VI summarizes the results.
II The Detector
The Soudan 2 detector [5] is a high resolution tracking calorimeter located in the Soudan Underground Mine State Park in northern Minnesota, at a depth of 710 meters below the surface of the earth. This depth corresponds to a muon threshold energy of TeV for a muon transmission probability of at least 50. The modular design of the detector has allowed the continuous acquisition of data from the beginning of its construction in mid-1988 to the present, during which time Soudan 2 has recorded more than 33 million muon events. The detector reached its full size of 224 1 m1 m2.7 m modules in November, 1993, for a final operating size of 8 m14 m in horizontal surface area 5.4 m in height.
The active region of each detector module consists of 7560 15 mm diameter plastic drift tubes layered between 241 1.6 mm thick corrugated steel sheets. Ionization deposited in the tubes drifts under the influence of an electric field toward the tube ends, where it is collected on vertical anode wires spaced 15 mm apart, and horizontal cathode strips spaced 10 mm apart. The pulses on the wires and strips are read-out and digitized every 200 ns, which, for a drift rate of 0.6 cm/s, corresponds to a timing resolution along the drift axis of 1.2 mm. (The measured resolution along the drift-axis of mm is larger than the timing resolution due to variations in drift velocities.) Pulse matching of the anode and cathode signals yields a three-dimensional space coordinate for each drift tube crossing along the path of a charged particle.
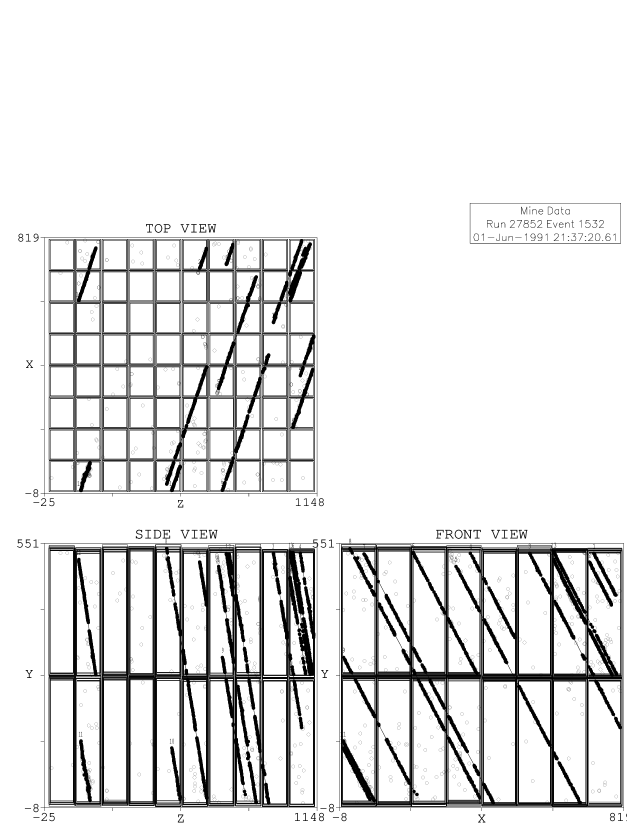
Events with high muon multiplicity require the ability to separate tracks bunched tightly together, as well as to distinguish tracks obscured by showers in multiple muon events in which a large bremsstrahlung has occured. The high resolution of Soudan 2 is particularly suited to this type of study since a typical track will leave hundreds of reconstructed pulses along its path. Fig. 1 shows three views of a 14-muon event as recorded in the detector. The resolution of a space point along a muon track detected in Soudan 2 is cm. The angular resolution of a typical muon track is .
The primary trigger operating over the time span of this data sample was called the “edge” trigger. It required a muon to have pulsed a minimum of 7 anode wires or 8 cathode strips out of any contiguous block of 16 channels of either type, separated by at least one trigger clock pulse of length 600 ns, and occuring within the given time window of 72s. The effect of the trigger requirement on a muon track of length 50 cm, the minimum track length considered in this analysis, is shown in Fig. 2. The boundary shown in the figure represents the ideal; in actuality, muon bremsstrahlung or pair production initiated showers assist triggers allowing some muons outside of this region to satisfy the trigger requirements as well. This, combined with individual channel inefficiencies, creates some fuzziness at the trigger acceptance boundaries. To avoid the trigger holes, the data events in this analysis were subjected to software imposed zenith and azimuthal angle cuts as discussed in the next section.
In addition to the main detector, there is a 14m31m10m veto shield consisting of proportional tubes which nearly covers the entire steradian surrounding the main detector. For multiple muon analysis, the shield is useful as a tool for selecting multiple muon event candidates in the main detector. It can also be used to study muon tracks which pass outside of the main detector volume [6], however this has not been included in the analysis presented here.
III Data Acquisition and Analysis
The data set reported in this paper consists of a sample of the total number of events recorded in Soudan 2 over the time span June 1991 through October 1991, and includes 7.2 single muon and 22000 multiple muon events after all cuts are applied. The detector size at the time of this data sample was 8 m11 m in surface area 5.4 m high. A larger data sample is not necessary for this analysis, since its accuracy is dominated by systematic uncertainties in the Monte Carlo simulation and not by statistics.
Data in Soudan 2 are accumulated in modular “runs” each lasting a little over an hour and containing typically 1500-2500 events. To be included as part of the data sample, each run needed to pass a series of “run quality” checks in order to exclude runs with localized hardware failures such as high voltage trips, excessive noise, or anomalously high or low average trigger rates. After application of run cuts, the total live-time considered in this analysis was 1348.8 hours.
Several cuts were applied to the data sample to ensure the highest quality data. Each muon track was required to have a minimum length of 50 cm. Multiple muon events were required to satisfy a “parallel” cut such that for each muon track there was an angular separation of less than from at least one other muon in the group. This restriction was to eliminate locally produced tracks. To avoid the trigger holes, we have made cuts on the azimuthal and zenith angle regions of acceptance. The muon events are confined to the azimuthal regions in each quadrant and zenith angles . The muon events are further confined to zenith angles as this allows us to apply the flat atmosphere model which is prevalent in atmospheric cascade simulations. The zenith and azimuthal angles of an event with more than one muon track were determined as the average of all muon tracks satisfying the length and parallel cuts.
By design, the Soudan 2 track reconstruction software finds and reconstructs everything from through-going muons to “contained” tracks consisting of as few as 5 pulses. This is because Soudan 2’s primary purpose is to search for the short tracks left by proton decay. The software is very efficient at finding and reconstructing single muon events which typically contain several hundred pulses. For this reason, determining the single muon event rate required only purifying the total of all tracks found by the reconstruction software to extract the through-going muon tracks. The regular track reconstruction code was modified to tag muon tracks as those which satisfied at least one of the following criteria on both ends of the track:
-
The track extrapolated to a time-coincident veto shield hit.
-
The last reconstructed hit on the end of the track was within 50 cm of the detector edge.
-
The end of the track projected through a detector crack, which is defined as the small open region between each pair of modules.
These requirements were enough to make the software very efficient at producing a very pure single muon sample. The single muon event reconstruction was tested against 1900 randomly selected events from two separate data runs, of which 594 events were found to be single muon events passing the length and angular cuts considered here. The results of this test are shown in Table I. The software was found to be efficient at identifying single muon events which passed the stated angular and length cuts. The background of misreconstructed tracks contributing to the single muon sample was determined to be . These corrections have been applied to the observed number of single muon events in Table III.
The software reconstruction of multiple muon events in the main detector is complicated due to a hardware design feature which electrically adds signals from separate regions of the detector together during readout. The purpose of this “multiplexing” is to decrease the cost of the electronics required to read out the drift tubes, and it occurs just before the pulses are digitized. The multiplexing is configured so that a match between a given anode pulse and cathode pulse has a unique position in the detector. The pulses are demultiplexed at the software stage. This multiplexing has little effect on the software reconstruction of contained events or single muon events because the relatively small number of pulses in these events leads to a simple interpretation of the data, but as the multiplicity of the event increases, the number of pulses and the complexity of the demultiplexing of the event increases as well. For this reason, the software reconstruction of all candidate multiple muon events was supplemented by scanning performed by a physicist using an interactive graphics program.
Multiple muon candidates were selected based on a set of generous but simple criteria. These criteria were that a candidate event contain both of the following:
-
At least one “good” track satisfying the criteria of the single muon tracks described above, except that in this case the angular restrictions on this one track were loosened to and in each quadrant.
-
At least one 2-dimensional anode-time or cathode-time reconstructed track, which, when paired with the opposite 2-d track from the “good” track, was parallel to the “good” track within . The sum of the projected lengths of all parallel 2-d tracks in either the anode-time or cathode-time view had to be at least 50 cm.
The net effect of these cuts was to select of the total number of muon events as multiple muon candidates, while the final sample post-scanning consisted of only multiple muons. Therefore these selection cuts are considered to be very liberal.
The multiple muon candidates were examined not just for multiplicity but to check their reconstruction results which were displayed directly over the event. The majority of low multiplicity events () had been reconstructed correctly by the software, while the highest multiplicity events () generally required some manual corrections which were applied through the interactive graphics program to produce the correct fits.
Events with multiplicities greater than 12 were discarded in this analysis due to a flaw in the data acquisition hardware which existed at the time of the data sample. This flaw put a maximum limit on the amount of readout time taken by any one event from the time of the trigger to the end of the event readout CAMAC sequence. The amount of time spent in this sequence rises with the size of the event, which is in turn dependent on the event multiplicity. Since the readout time distributions corresponding to a given multiplicity have long tails, there is a gradual lessening in the efficiency to readout the entire event with increasing multiplicity. Through a simulation in which low multiplicity data events (for which the readout time distributions are known) were used to generate the readout time distributions of high multiplicity events, the efficiency for reading out high multiplicity events was determined [7]. These efficiencies were calculated based on a worst case scenario, and as such cannot be used to correct the data. In this simulation, 99% of 12 muon events were read out successfully by the data acquisition software. This is the maximum multiplicity considered in this analysis.
The efficiency of the multiple muon candidate selection criteria is tabulated in Table II. In this case, the same two runs used to determine the single muon efficiency were used to determine the number of multiple muon events which satisfy the angular, length, and parallel cuts described above. Of the 2970 events in these two runs scanned for multiple muon events, 30 events were determined to be multiple muon events which satisfied these cuts, and the multiple muon selection software found all 30 of these events. Five additional runs shown in the table were scanned by a team of undergraduate scanners. Seventy-nine out of the 8830 events scanned were found to be multiple muon events which satisfied the cuts, of which the multiple muon selection software found 79. The efficiency of the multiple muon selection software has therefore been determined in excess of at the confidence level. This uncertainty has been applied to the errors in Table III for all multiplicities, even though the selection software will certainly be more efficient at finding high multiplicity events than low multiplicity events, so that this can be considered to be a very conservative estimate of the total uncertainty at high multiplicities.
IV Monte Carlo Simulation
The increasing statistical accuracy of indirect measurement data correlated to phenomena from primary energies in the knee region requires the use of sophisticated Monte Carlo simulations to constrain the systematic errors in these types of measurements. In this application, we have used the most fully-developed Monte Carlo simulation of the atmospheric cascade and muon rock propagation currently available. The Monte Carlo simulation used in this analysis consists of three stages:
-
A 3-dimensional simulation of the atmospheric cascade.
-
A 3-dimensional simulation of the propagation of the muons through the rock overburden.
-
A simulation of the detector.
The cascade simulation uses the HEMAS cascade code [8] for controlling the overall structure of the cascade development. This code injects a nucleus of a requested energy, mass, azimuth and zenith angle into the atmosphere. It then tracks this particle and any secondaries produced along the path of the cascade development until they either interact, decay, drop below some user defined energy threshold, or reach the atmospheric sampling height. In our case, this last quantity is at the surface of the earth above Soudan 2, which corresponds to 492 meters above sea level.
The HEMAS cascade code is built so that the hadronic interaction code is fully modular. In this analysis, we have used the recent program SIBYLL [9] for generating hadronic interactions. SIBYLL is based on the dual parton model with minijet production superimposed. It was designed with the motivation of using a theoretical model for extrapolation of “low” energy accelerator and fixed-target data to the energies necessary for the study of cosmic-ray interactions. SIBYLL agrees reasonably well with available accelerator data with one notable exception: the distributions associated with particle production in pp interactions are underestimated at large Feynman x (x) [9]. The distributions of parent mesons are significant in studies like this because is the dominant contributing factor to the lateral distribution of underground muons. At the Soudan 2 depth, the mean separation of muon pairs is comparable to the size of the detector. This means that the Monte Carlo simulation of muon lateral spread is significant for a detector of our size and depth since we need to determine correctly the rate of “observed” events of a given multiplicity from the total number of events at our depth. We have tested the effect that the SIBYLL underestimation of has on our analysis and discuss this in Sec. V.
The nucleus-air interaction simulation is also a modular component of the HEMAS cascade code. We have used the NUCLIB [10] nuclear interaction code for this stage. In addition, the HEMAS cascade simulation package has been modified from its original form to include the effect of the local geomagnetic field, which has a strength of 0.59 Gauss and a magnetic inclination and declination of N and E respectively at the Soudan 2 site. Even though the earth’s magnetic field is weak, it plays a noticeable role in determining the transverse displacement of the underground muons because the distance traveled by the cosmic ray muons through the atmosphere is very long. Because the magnetic field near the Soudan site is nearly vertical, particles at large zenith angles are more greatly affected than those near vertical. We have found that the addition of the magnetic field to the cascade simulation has a negligible effect for events with zenith angle . However, at , the earth’s magnetic field increases the mean transverse displacement of muons from the event core at the Soudan 2 depth from 13 m with no magnetic field to 18 m with magnetic field.
To determine the absolute single and multiple muon rates in the detector, it is essential to understand the composition and thickness of the rock overburden, as well as to have a means to simulate the passage of the muons through the rock. A digitized map from the US Geological Survey was used to determine the depth of rock around the Soudan site. The density of the rock at the Soudan site is also variable. Soudan is located in the “Iron Range” of northern Minnesota and the rock overburden is of non-uniform composition with pockets of iron ore interspersed among an overburden consisting mostly of Greenstone [11]. To determine the density of the overburden, a fit to “world survey” muon data [12] was performed using a large body of muon data spanning the periods June, 1991 to March, 1996. The effective rock density was determined in 337 angular bins covering the angular region considered in this analysis [7].
The GEANT Detector Description Simulation [13] package developed by CERN was used to propagate muons underground. Muon energy loss mechanisms are fairly well understood [14], and in fact have been experimentally verified up to energies of TeV for muon energy loss in iron [15, 16]. For Soudan 2 data this is the critical region of energy, since it defines the shape of the rise of the transmission probability curve. (The transmission probability curve is the probability of a muon to successfully reach the Soudan 2 level versus muon surface energy.) We have compared GEANT to the available muon experimental energy loss data with good results [17].
Finally, the detector was simulated using a simplified model which compares well against a more realistic simulation of the response of the tracking calorimeter modules and their readout electronics. All cuts applied to the data were also applied to the Monte Carlo simulated events.
V Analysis
A Composition Models
The energy and mass of the primary cosmic rays cannot be determined on an event-by-event basis through indirect experimental methods such as underground muon rates because of large fluctuations in the atmospheric development of a cosmic ray cascade. Instead, the experimental approach is to assume a model of primary composition at the top of the atmosphere as a function of mass and energy, and to use the Monte Carlo simulation to predict from the assumed composition the muon rate underground. For simplicity, primary composition models generally divide primary cosmic rays into five mass groups centered around the principal nuclei H, He, CNO, Ne-S, and Fe. To narrow the field of possible test composition models, we have defined three composition models which satisfy the following criteria:
-
The model is theoretically motivated by an astrophysical model.
-
The model fits the available satellite and balloon direct measurement data in the low energy region ( TeV/nucleus) in which this data is available.
-
The model normalizes to the air-shower determined all-particle spectrum in the knee energy region.
In recent years the amount of direct measurement cosmic ray composition data, both satellite and balloon, has grown considerably. Direct measurements currently extend up to almost 1000 TeV/nucleus [18, 19]. Monte Carlo simulations show that Soudan 2 should be sensitive to muon events generated by primary cosmic rays in the energy region 5 - 50000 TeV/nucleus. Therefore, there is significant overlap between direct measurements and the energy region under study in our analysis.
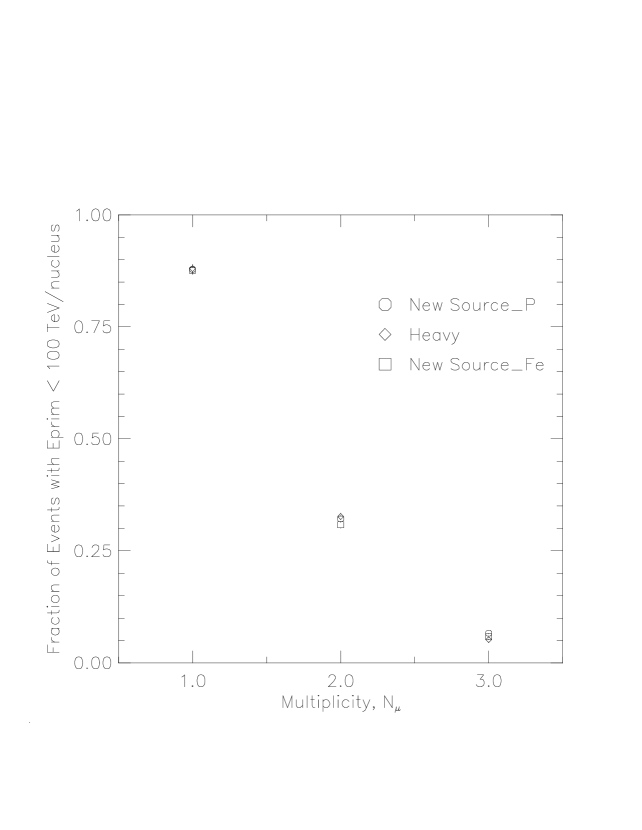
Use of the available direct measurement data performs two important functions in our analysis. First, it tightly constrains the possible test composition models, e.g. a composition model of pure protons over the entire energy range under study would be in obvious contradiction to the mixed composition observed in the lower energy regime by direct measurements. Secondly, proper normalization to the direct measurement data allows for a test of the atmospheric cascade simulation at low energy. To illustrate, Fig. 4 shows the fraction of events which are produced by primaries of energy less than 100 TeV/nucleus as a function of multiplicity. It is clear from the figure that greater than of single muon events are generated by primaries in an energy region in which the composition is well known. Therefore, the absolute single muon rate in Soudan 2 can be used as an important test of the Monte Carlo simulation.
As has been pointed out elsewhere [20], the availability of new high energy direct measurement composition data has made some popular composition models somewhat obsolete. In particular, we note that the versions of a Light test composition model used by NUSEX [21] and MACRO [22] no longer give good agreement to the available direct measurement data over the entire relevant energy range. To formulate test composition models, we follow the lead of Silberberg, et al. [23] and Stanev, Biermann, and Gaisser [24] and assume a two-component model at low-energies, such that the differential spectrum is described by
| (1) |
for each of the five mass groups. A two component model follows naturally from the assumption that the low energy cosmic rays come primarily from two sources: supernova blasts into a homogeneous interstellar medium(e.g. [25]) and supernova blasts into a stellar wind environment [26]. The latter is theorized to play a significant role for the heavy elements and to produce a flatter spectrum than that of the former [26, 23]. To fit Eq. (1) to the direct measurement data, we have compiled data from a large number of direct measurement experiments. These measurements are shown in Figs. 5 and 6. We found that good agreement between Eq. (1) and all five mass groups could be obtained by using =2.75 and =2.50, and by allowing the coefficients K1 and K2 to have the values tabulated in Table IV. Eq. (1), along with the values in Table IV, is used to describe the low-energy component in all models considered in our analysis. The agreement of this low-energy component with the direct measurement data is shown in Figs. 5 and 6.
We then define three test composition models: “New SourceP”,“Heavy”, and “New SourceFe”. The New SourceP model, motivated by the model of Fichtel and Linsley [27], assumes that a new source consisting entirely of protons predominates at energies around the knee. This type of proton-rich source is compatible with the ideas of the AGN particle acceleration model of Szabo and Protheroe [1]. In the New SourceP model, we have assumed that the low-energy components have an exponential cutoff (as in [24]), such that the differential spectrum for these components becomes
| (2) |
The exponential cutoff energy, Ecut, is determined for the proton component by the direct measurement data. The exponential cutoff for the heavier elements is allowed to extend out to higher energies, as suggested by reference [26] for a stellar wind component, and as required by the helium data. This cutoff for the heavier elements is also taken to be rigidity dependent. The low-energy cutoff for all five mass groups are given in Table V and are shown in Fig. 5.
The New SourceP high-energy component, shown in Fig. 7, has the functional form
| (3) |
with parameters for this component given in Table VI. We have chosen to normalize the high-energy component such that the summed mass components of the model equal the all-particle spectrum as determined by Akeno [28]. This choice of normalization and its effect on the underground muon rates will be discussed in the next section.
The second test model, the Heavy model, is motivated by the theoretical model of Biermann, et al. [2, 24], in which the stellar wind component extends out to energies up to GeV/nucleus. In the Heavy test model used here, each of the heavy mass groups (He,CNO,Ne-S,Fe) has the low energy form given in Eq. (1) up to a sharp break at energy Eknee, above which the mass groups follow the single power-law
| (4) |
The Eknee and parameters for this model are given in Table VII and the agreement of this model with direct measurements is shown in Fig. 6. The normalization to the all-particle spectrum closely matches that of New SourceP and is shown in Fig. 7.
The third test model, New SourceFe, is exactly the same as New SourceP except that the high energy protons have been replaced by iron to test the opposite extreme.
The fractional composition for all three models is shown in Fig. 8. We note that even though a pure proton high energy component is assumed for the New SourceP model, this model is still fairly heavy in what will be the critical energy region for this study: GeV/nucleus. In particular, we note that the New SourceP model is heavier than the MACRO Light [22] model in this energy region.
B Results
The results of this analysis are shown in Fig. 9. This figure shows the ratio of simulated multiple muon event rates to observed event rates for each of the three test composition models. Fig. 10 shows the primary energy range to which each multiplicity is sensitive. We note that 90% of the high multiplicity () events come from a fairly well defined region of the energy spectrum which is GeV/nucleus. This is the energy region just below and around the knee of the energy spectrum. From Fig. 9, therefore, it is clear that the high multiplicity events offer a statistically significant test of composition of cosmic rays in this part of the all-particle spectrum.
The agreement of the measured and simulated event rates of each test composition model is tabulated in Table VIII. /d.o.f. in each case is calculated by comparing the absolute event rates of the simulated and measured data for the seven multiplicities 6 through 12 which span the primary energy region of interest around the knee of the all-particle spectrum. The data event rates used in this calculation include statistical and systematic errors, while the simulated event rates include statistical errors only. Of the three trial composition models considered here, the New SourceP simulated event rates clearly give the best agreement with the data in the knee energy region of the all-particle spectrum.
The observed absolute single muon rate agrees with the Monte Carlo rates obtained with all three composition models to within 5%. As already mentioned, of single muon events come from a region of the spectrum in which the composition is known from direct measurements; therefore the agreement of the single muon observed and Monte Carlo rates shows that the Monte Carlo is successful at simulating muon events at low energy. Of course, as we extend the measurement to higher energy, the systematic uncertainties become more complex. Here we discuss two of the more important contributors to the systematic uncertainty of the Monte Carlo simulation at energies around the knee of the all-particle spectrum.
1 All-particle spectrum normalization
As already mentioned, we have chosen to normalize the test composition models to the Akeno determined all-particle spectrum [28] in the knee energy region. The choice of normalization in this energy range has some arbitrariness associated with it since the all-particle spectrum is determined indirectly through air-shower measurements. This choice obviously has an effect on the high multiplicity underground muon rates. The Akeno group [28] established a range in which the all-particle spectrum might fall based on their own measurements using various techniques and the measurements of other experiments. Their parametrized form of their measured all-particle spectrum, used in the analysis presented here, lies along the low end of this range. If we were to increase the normalization of the test composition models towards the upper end of their range, the effect would be to push the results further away from the heavy composition models.
We also compare the normalization of the test model all-particle spectra to the recently reported result of the Tibet AS [44] air shower collaboration. The Tibet air-shower array operates at the high altitude of 4300 meters above sea level, corresponding to an atmospheric depth of 606 g/cm2. This is an ideal altitude for studying the all-particle spectrum in the energy region just before and around the knee, since air showers generated by primaries in the energy range GeV reach their maximum shower development close to the altitude of the experiment, and hence their fluctuations at the point of sampling are at a minimum. Also, the average shower sizes generated by primaries of different atomic mass become nearly identical at sampling heights near shower maximum. This is very important for eliminating the systematic dependence of the measurement of primary energy on the assumed primary composition.
The all-particle spectra of the test composition models considered in this analysis lie about lower than the Tibet measurements at energies of GeV, and about higher at energies of GeV. A renormalization of the all-particle spectrum of the Heavy model to the Tibet spectrum yields underground high-multiplicity event rates which are higher than the present rates, again pushing the Heavy model further away from the data.
2 Hadronic interaction model
As already noted, one of the uncertainties in the hadronic interaction model is that SIBYLL tends to underestimate the increase in with xF (x) for particle production in pp interactions. On the other hand, an older version of a Monte Carlo hadronic interaction code, HEMAS [8], produces a significantly greater mean transverse momentum in the forward fragmentation region than that of SIBYLL, and is in fact likely to overestimate the at large xF [9]. We have run a test using the Heavy model as input and SIBYLL as the main driving code, but scaling the transverse momentum in each SIBYLL hadronic interaction according to the HEMAS distributions. In this way, we were able to extract and test the effect that just this one aspect of the hadronic interaction code has on the Monte Carlo simulated Heavy model rates. The result is that approximately fewer Monte Carlo events with multiplicities are seen in the detector given the larger distributions of the HEMAS hadronic interaction code. This lowers the Heavy composition model rates in the direction of the data, resulting in an improved /d.o.f. agreement between the data and the Heavy model. The /d.o.f. for the scaled Heavy model rates (calculated, as before, by comparing the absolute event rates of the simulated and measured data for the seven multiplicities 6 through 12) is 55/7 (C.L. = 1.8%).
VI Conclusion
We have shown that the multiple muon rates observed in the Soudan 2 detector are sensitive to the nuclear composition of cosmic rays in the energy region GeV/nucleus, which is the energy region just before and around the knee in the cosmic ray all-particle spectrum. The composition model favored in this work includes an enhanced component of protons in this energy region. This component is compatible with the AGN model of particle acceleration of Szabo and Protheroe [1], which shows a contribution of protons due to AGN sources localized in the knee energy region of the spectrum.
The light composition model favored in this analysis is compatible with previous results from Soudan 1 [29] and Soudan 2 [3], in which a small surface array was operated in conjunction with the underground detector. The result is also in agreement with the recent multiple muon analysis performed by MACRO [45], as is shown in Fig. 11. Results from Fly’s Eye [30] favor a mixed to heavy composition at energies near GeV/nucleus. We note that the Fly’s Eye result does not directly contradict our result, since our measurement applies to lower primary energies.
Acknowledgements
We are very grateful to Tom Gaisser for making the HEMAS/SIBYLL cascade simulation package available to us, and for providing valuable advice.
This work was supported by the U.S. Department of Energy, the U.K. Particle Physics and Astronomy Research Council, and the State and University of Minnesota. We wish to thank the staffs of the collaborating institutions, the Minnesota Department of Natural Resources for use of the facilities at the Soudan Underground Mine State Park, the staff of the park for their support (particularly Park Managers D. Logan and P. Wannarka), and the Soudan 2 mine crew: B. Anderson, J. Beaty, G. Benson, D. Carlson, J. Eininger and J. Meier.
REFERENCES
- [1] A. P. Szabo and R. J. Protheroe, Astropart. Phys. 2, 375 (1994).
- [2] P. L. Biermann, Astron. Astrophys. 271, 649 (1993).
- [3] N. P. Longley et al., Phys. Rev. D 52, 2760 (1995).
- [4] P. Border, L. Mualem, K. Ruddick, and V. Vassiliev, in Proceedings of the 24th International Cosmic Ray Conference, Rome, 1995, edited by N. Iucci et al. (Arti Grafiche Editoriali Srl, Urbino, 1995), Vol. 3, p. 484.
- [5] W. W. M. Allison et al., Nucl. Instrum. Methods A376, 36 (1996).
- [6] N. Sundaralingam, Ph.D. thesis, Tufts University, 1993.
- [7] S. M. Kasahara, Ph.D. thesis, University of Minnesota, unpublished.
- [8] C. Forti et al., Phys. Rev. D 42, 3668 (1990).
- [9] R. S. Fletcher, T. K. Gaisser, P. Lipari, and T. Stanev, Phys. Rev. D 50, 5710 (1994).
- [10] J. Engel, T. K. Gaisser, P. Lipari, and T. Stanev, Phys. Rev. D 46, 5013 (1992).
- [11] K. Ruddick, Soudan 2 Collaboration Internal Report PDK 435, 1990 (unpublished).
- [12] M. Crouch, in Proceedings of the 20th International Cosmic Ray Conference, Moscow, 1987, edited by V. Kozyarivsky et al. (Nauka, Moscow, 1987), Vol. 6, p. 165.
- [13] CERN Application Software Group, CERN Program Library Long Writeup W5013, 1993.
- [14] W. Lohmann, R. Kopp, and R. Voss, CERN Report No. 85-03, 1985 (unpublished).
- [15] W. K. Sakumoto et al., Phys. Rev. D 45, 3042 (1992).
- [16] K. Mitsui, Phys. Rev. D 45, 3051 (1992).
- [17] H. J. Trost, Soudan 2 Collaboration Internal Report PDK 473, 1991 (unpublished).
- [18] I. P. Ivanenko et al., in Proceedings of the 23rd International Cosmic Ray Conference, Calgary, 1993, edited by R. B. Hicks, D. A. Leahy, and D. Venkatesan (World Scientific, Singapore, 1994), Vol. 2, p. 17.
- [19] K. Asakimori et al., in Proceedings of the 23rd International Cosmic Ray Conference [18], Vol. 2, p. 21; Vol. 2, p. 25.
- [20] T. K. Gaisser and T. Stanev, in Proceedings of the 23rd International Cosmic Ray Conference [18], Vol. 2, p. 108.
- [21] M. Aglietta et al., Nucl. Phys. (Proc. Suppl.) B14, 193 (1990).
- [22] S. Ahlen et al., Phys. Rev. D 46, 895 (1992).
- [23] R. Silberberg, C. H. Tsao, M. M. Shapiro, and P. L. Biermann, Astrophys. J. 363, 265 (1990).
- [24] T. Stanev, P. L. Biermann, and T. K. Gaisser, Astron. Astrophys. 274, 902 (1993).
- [25] R. Blandford and D. Eichler, Phys. Rep. 154, 1 (1987).
- [26] H. J. Völk and P. L. Biermann, Astrophys. J. 333, L65 (1988).
- [27] C. E. Fichtel and J. Linsley, Astrophys. J. 300, 474 (1986).
- [28] M. Nagano et al., J. Phys. G 10, 1295 (1984).
- [29] U. Das Gupta et al., Phys. Rev. D 45, 1459 (1992).
- [30] T. K. Gaisser et al., Phys. Rev. D 47, 1919 (1993).
- [31] M. Ichimura et al., Phys. Rev. D 48, 1949 (1993).
- [32] E. Júliusson, Astrophys. J. 191, 331 (1974).
- [33] M. J. Ryan, J. F. Ormes, and V. K. Balasubrahmanyan, Phys. Rev. Lett. 28, 985 (1972); 28, 1497(E) (1972).
- [34] J. J. Engelmann et al., Astron. Astrophys. 233, 96 (1990).
- [35] P. Papini et al., in Proceedings of the 23rd International Cosmic Ray Conference [18], Vol. 1, p. 579.
- [36] L. H. Smith et al., Astrophys. J. 180, 987 (1973).
- [37] M. Simon et al., Astrophys. J. 239, 712 (1980).
- [38] V. I. Zatsepin et al., in Proceedings of the 23rd International Cosmic Ray Conference [18], Vol. 2, p. 13.
- [39] C. D. Orth, A. Buffington, G. F. Smoot, and T. S. Mast, Astrophys. J. 226, 1147 (1978).
- [40] J. Dwyer et al., in Proceedings of the 23rd International Cosmic Ray Conference [18], Vol. 1, p. 587.
- [41] T. T. Von Rosenvinge, W. R. Webber, and J. F. Ormes, Astrophys. Space Science 5, 342 (1969).
- [42] J. F. Ormes and W. R. Webber, in Proceedings of the Ninth International Cosmic Ray Conference, London, 1965, edited by A. C. Stickland (The Institute of Physics and The Physical Society, London, 1966), Vol. 1, p. 349.
- [43] T. Stanev, in Particle Acceleration in Cosmic Plasmas, edited by G. P. Zank and T. K. Gaisser (American Institute of Physics, New York, 1992), p. 379.
- [44] M. Amenomori et al., Astrophys. J. 461, 408 (1996).
- [45] O. Palamara for the MACRO Collaboration, in Proceedings of the 24th International Cosmic Ray Conference [4], Vol. 2, p. 689.


| Run | Date | Total Scanned | Muon Events | Efficiency | Background |
|---|---|---|---|---|---|
| Events | Passing Cuts | ||||
| 29052 | 7/21/91 | 1000 | 273 | ||
| 31111 | 10/14/91 | 900 | 321 | ||
| Total | 1900 | 594 |
| Run | Date | Total Events | Multiple Muon Events | Efficiency |
|---|---|---|---|---|
| 29052 | 7/21/91 | 2070 | 23 | 1. |
| 31111 | 10/14/91 | 900 | 7 | 1. |
| 28132 | 6/13/91 | 1858 | 12 | 1. |
| 33009 | 1/01/92 | 1868 | 13 | 1. |
| 35018 | 3/31/92 | 1795 | 19 | 1. |
| 35520 | 4/26/92 | 1428 | 16 | 1. |
| 35848 | 5/12/92 | 1881 | 19 | 1. |
| Total | 11800 | 109 |
| Multi- | Events | Events stat syst | Rate (hr-1) stat syst |
|---|---|---|---|
| plicity | (uncorrected) | (corrected) | (corrected) |
| 1 | 724792 | 716024 846 5249 | 530.87 0.63 3.89 |
| 2 | 17237 | 17237 131 | 12.780 0.097 |
| 3 | 2813 | 2813 53 | 2.086 0.039 |
| 4 | 905 | 905 30 | 0.671 0.022 |
| 5 | 385 | 385 20 | 0.285 0.015 |
| 6 | 172 | 172 13 | 0.128 0.010 |
| 7 | 102 | 102 10 | 0.0756 0.0074 |
| 8 | 58 | 58 7.6 | 0.0430 0.0056 |
| 9 | 42 | 42 6.5 | 0.0311 0.0048 |
| 10 | 37 | 37 6.1 | 0.0274 0.0045 |
| 11 | 20 | 20 4.5 | 0.0148 0.0033 |
| 12 | 13 | 13 3.6 | 0.0096 0.0027 |
| Mass Group | Zeff | Aeff | K1 | K2 | ||
|---|---|---|---|---|---|---|
| H | 1 | 1 | 20830. | 2.75 | 0. | 2.5 |
| He | 2 | 4 | 7750. | 2.75 | 840. | 2.5 |
| CNO | 7 | 14 | 3545. | 2.75 | 550. | 2.5 |
| Ne-S | 12 | 24 | 2655. | 2.75 | 445. | 2.5 |
| Fe | 26 | 56 | 2120. | 2.75 | 335. | 2.5 |
| Mass Group | Ecut |
|---|---|
| H | |
| He | |
| CNO | |
| Ne-S | |
| Fe |
| Ko | Ao | Bo | |
|---|---|---|---|
| 2.75E9 | 327. | 0.322 | 3.3 |
| Mass Group | Eknee | |
|---|---|---|
| He | 3.08 | |
| CNO | 3.08 | |
| Ne-S | 3.08 | |
| Fe | 3.08 |
| Composition Model | d.o.f. | /d.o.f. | C.L. (%) | |
|---|---|---|---|---|
| New SourceP | 8.7 | 7 | 1.2 | 28 |
| Heavy | 103 | 7 | 15 | 2.1 |
| New SourceFe | 236 | 7 | 34 | 3.0 |