NEVIS-1529 A High Statistics Search for Oscillations in the Small Mixing Angle Regime
Abstract
Limits on oscillations based on a statistical separation of charged current interactions in the CCFR detector at Fermilab are presented. interactions are identified by the difference in the longitudinal shower energy deposition pattern of versus interactions. Neutrino energies range from 30 to 600 GeV with a mean of 140 GeV, and flight lengths vary from 0.9 km to 1.4 km. The lowest 90% confidence upper limit in of is obtained at . For , is excluded, and for , is excluded. This result is the most stringent limit to date for and it excludes the high oscillation region favoured by the LSND experiment. The -to- cross-section ratio was measured as a test of universality to be .
pacs:
PACS numbers: 14.60.Pq, 13.15.+gThe existence of neutrino mass and mixing would have important implications for fundamental problems in both particle physics and cosmology. These include violation of lepton family number conservation, the mass of the universe, and the observed neutrino deficits from the sun and from atmospheric sources. Neutrino oscillations are a necessary consequence of non-zero neutrino mass and mixing since neutrinos are produced and detected in the form of weak-interaction eigenstates whereas their motion as they propagate from the point of production to their detection is dictated by the mass eigenstates [1]. In the two-generation formalism, the mixing probability is:
| (1) |
where is the mass squared difference of the mass eigenstates in , is the mixing angle, is the incoming neutrino energy in GeV, and is the distance between the point of creation and detection in km.
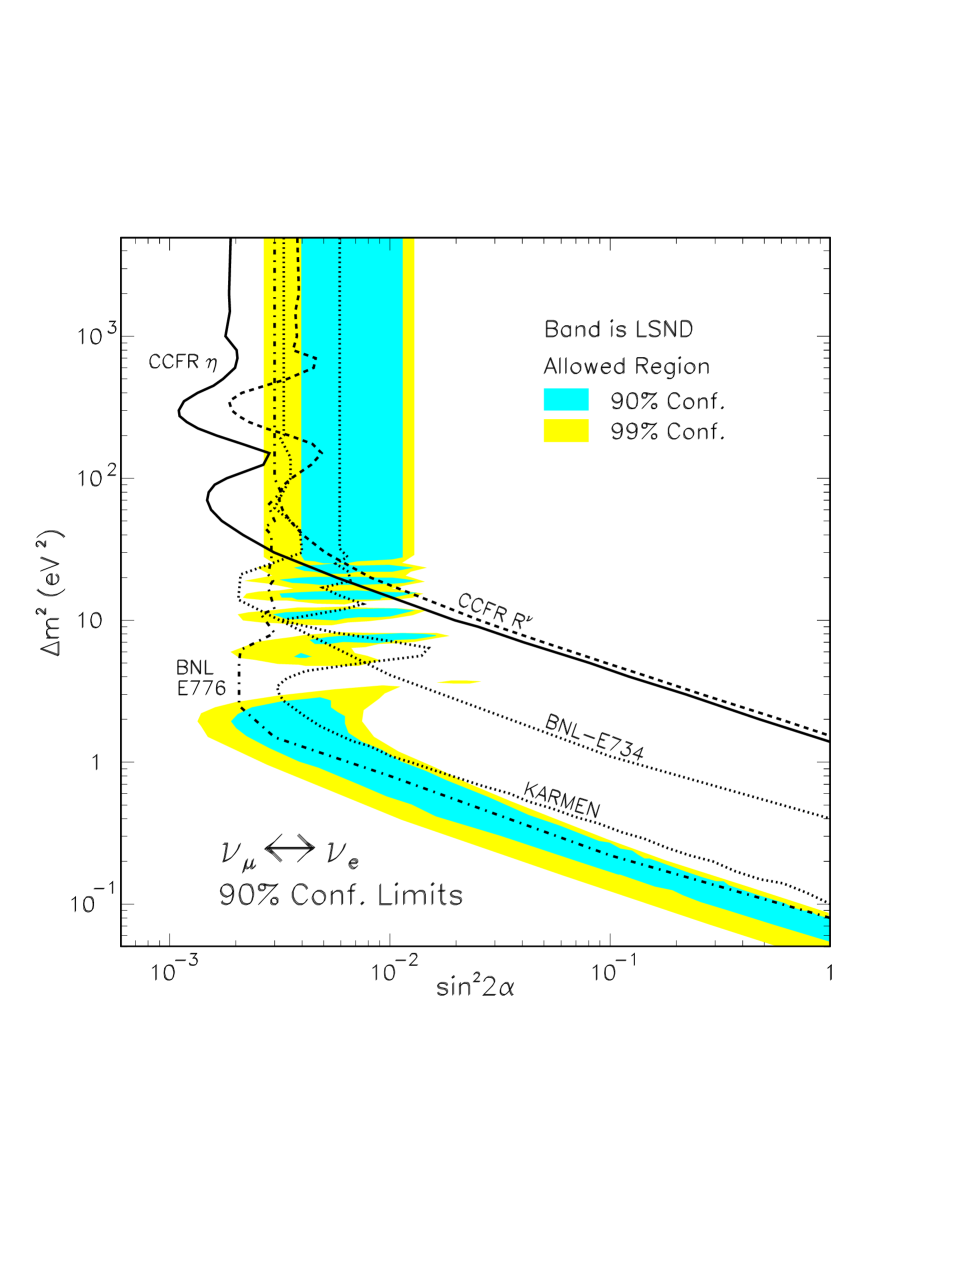
To date the best limits from accelerator experiments for oscillations come from fine-grained calorimetric (e.g.: BNL-E734 [2], BNL-E776 [3]) or fully active detectors (e.g. KARMEN [4], LSND [5]) searching for quasi-elastic charged current production of electrons. The LSND experiment, using a liquid scintillator neutrino target, has reported a signal consistent with oscillations at a and eV2 [5]. The CCFR collaboration has previously reported a limit on oscillations using the ratio of neutral to charged current neutrino events comparable in sensitivity to the above mentioned limits [6].
In this report we present new limits on oscillations based on the statistical separation of charged current interactions.
The CCFR detector [7, 8] consists of an 18 m long, 690 ton total absorption target calorimeter with a mean density of , followed by a 10 m long iron toroidal spectrometer. The target consists of 168 steel plates, each , instrumented with liquid scintillation counters placed every two steel plates and drift chambers spaced every four plates. The separation between scintillation counters corresponds to 6 radiation lengths, and the ratio of electromagnetic to hadronic response of the calorimeter is . The toroid spectrometer is not directly used in this analysis which is based on the shower profiles in the target-calorimeter.
The Fermilab Tevatron Quadrupole Triplet neutrino beam is a high-intensity, non-sign-selected wideband beam with a : flux ratio of about 2.5 : 1 and usable neutrino energies up to 600 GeV. The production target is located 1.4 km upstream of the neutrino detector and is followed by a 0.5 km decay region. The resulting neutrino energy spectra for , , , and induced events are shown in Figure 1. The beam contains a 2.3% fraction of electron neutrinos, 82% of which are produced from .

The neutrino interactions observed in the detector can be divided into three classes depending on the type of the incoming neutrino and on the interaction type:
-
1.
( charged current (CC) events).
-
2.
( neutral current (NC) events).
-
3.
( CC events).
All three types of neutrino interactions initiate a cascade of hadrons that is registered by the drift chambers and scintillation counters. The CC events are characterized by the presence of a muon produced in the final state which penetrates beyond the end of the hadron shower, depositing energy characteristic of a minimum ionizing particle [7] in a large number of consecutive scintillation counters. Conversely, the electron produced in a CC event deposits energy in a few counters immediately downstream of the interaction vertex which changes the energy deposition profile of the shower. The electromagnetic shower is typically much shorter than the hadron shower and the two cannot be separated for a CC event.
In this analysis four experimental quantities are calculated for each event: the length, the transverse vertex position, the visible energy and the shower energy deposition profile. The event length is determined to be the number of scintillation counters spanned from the event vertex to to the last counter with a minimum-ionizing pulse height. The mean position of the hits in the drift chamber immediately downstream of the interaction vertex determines the transverse vertex position. The visible energy in the calorimeter, is obtained by summing the energy deposited in the scintillation counters from the interaction vertex to five counters beyond the end of the shower. The shower energy deposition profile is characterized by the ratio of the sum of the energy deposited in the first three scintillation counters to the total visible energy. Accordingly, we define
| (2) |
where is the energy deposited in the scintillation counter downstream of the interaction place.
The most downstream counter with energy deposited from the products of the neutrino interaction (CEXIT) occurs at the end of the hadron shower for NC and CC events but is determined by the muon track for most CC events. We isolate the events without a muon track by requiring CEXIT to be no more than 10 counters downstream from the end of the hadron shower. We parametrize the event length which contains 99% of such events as:
| (3) |
In order to measure the number of CC events we divide the neutrino events into two classes: “short” if they deposit energy over an interval shorter than , and “long” otherwise. The long events consist almost exclusively of class 1 events, while the short ones are a mixture of class 2, class 3 and class 1 events with a low energy muon which cannot be separated on an event-by-event basis.
Based on Lund studies, we take the hadron showers produced in NC and CC interactions to be the same. Any difference in the shower energy deposition profile of long and short events is attributed to the presence of CC interactions in the short sample. To compare directly the long and short events a muon track from the data was added to the short events to compensate for the absence of a muon in NC events. The fraction, f, of CC events with a low energy muon contained in the short sample which now have two muon tracks was estimated from a detailed Monte Carlo of the experiment in the range of 20%. A simulated sample of such events was obtained by choosing long events with the appropriate energy distribution from the data to which a second short muon track was added in software. The length of the short track and the angular distribution were obtained from a Monte Carlo of CC events.
To simulate interactions in our detector we assume universality. The electron neutrino showers were generated by adding a GEANT [9] generated electromagnetic shower of the appropriate energy to events in the long data sample. The energy distribution of the electron neutrinos and the fractional energy transfer were generated using a detailed Monte Carlo simulation of the experiment. Since the hadron showers in the long sample already have a muon track, the sample can be compared directly with the short and long events.

The long and short distributions were further corrected by subtracting the contamination due to cosmic ray events. The cosmic ray background was estimated from the event sample collected during a beam off gate using an identical analysis procedure as for the data gates. Additionally, the distribution of short CC events, normalized to the predicted fraction f, was subtracted from the short event sample. The distributions for short, long, and events for various energy bins are shown in Figure 2.
For this oscillation search we measure the absolute flux of ’s at the detector and compare it to the flux predicted by a detailed beamline simulation [10]. Any excess could be interpreted as a signal of oscillations. The flux was determined directly from the low hadron energy CC event sample, normalized to the total neutrino cross-section [11]. The same beamline simulation is used to tag the creation point of each simulated along the decay pipe, and give the number of predicted ’s at the detector normalized to the number observed at the detector divided by . is the oscillation probability determined from eq. (1), assuming CP invariance. The predicted electron neutrino flux is normalized to the produced number of ’s. The flux from neutrino oscillations is calculated by multiplying the produced number of ’s by .
The events selected are required to deposit a minimum of 30 GeV in the target calorimeter to ensure complete efficiency of the energy deposition trigger. Additionally, we require the event vertex to be more than 5 counters from the upstream end of the target and five counters plus the separation length from the downstream end and less than from the detector centre-line. The resulting data sample consists of 632338 long events and 291354 short ones.
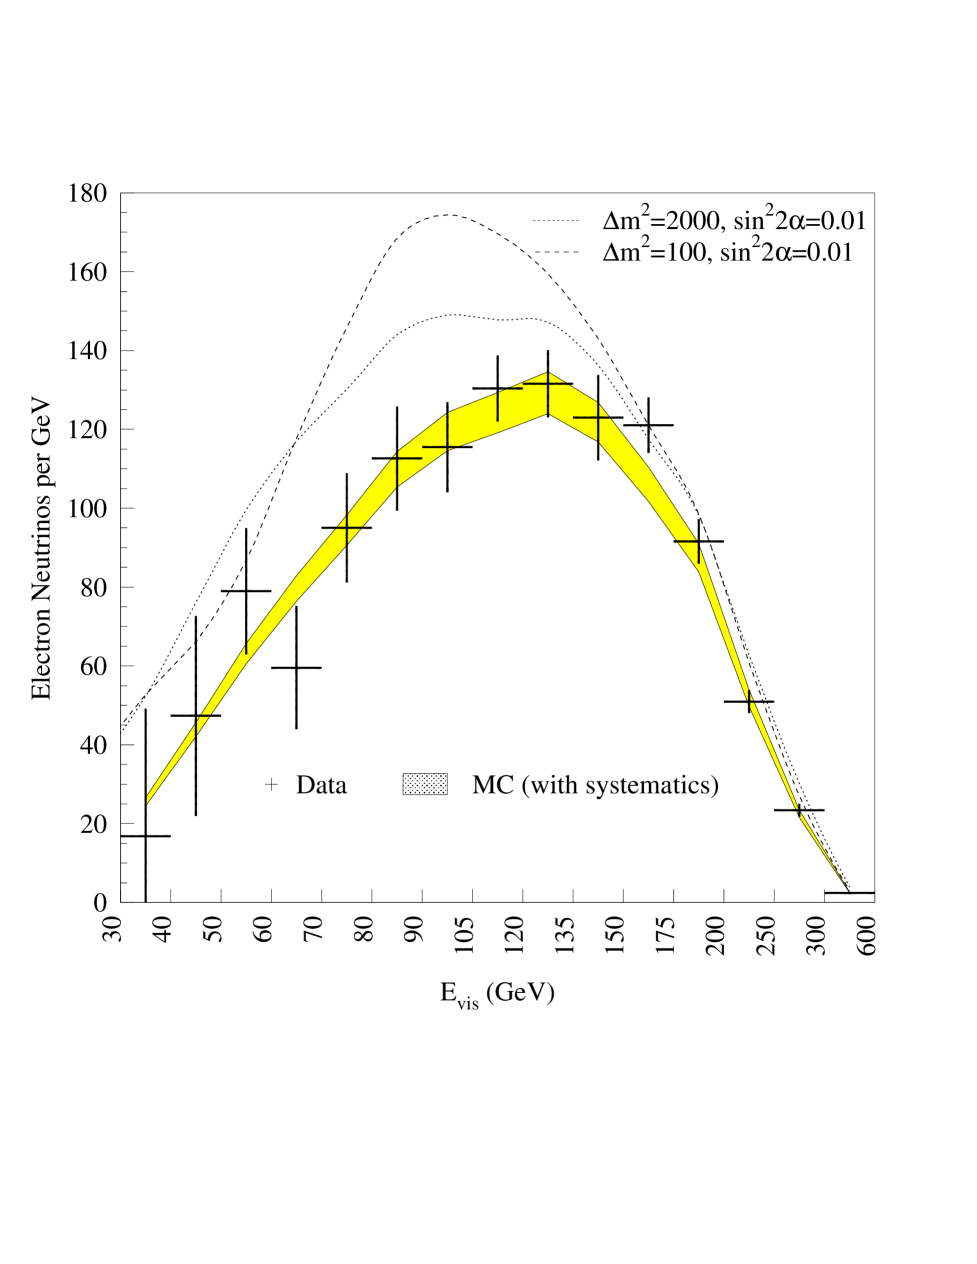
To extract the number of CC events in each of 15 bins, we fit the corrected shape of the observed distribution for the short sample to a combination of CC and CC distributions with appropriate muon additions:
| (4) |
The of the fit in each of the 15 bins ranges from 33.2 to 77.7 for 41 degrees of freedom (DoF) with a mean value of 48.4. Figure 3 shows that the measured number of CC’s agrees with the Monte Carlo prediction in each energy bin. The value with a no-oscillations assumption is DoF.
The major sources of uncertainties in the comparison of the electron flux extracted from the data to that predicted by the Monte Carlo are: (i) The statistical error from the fit in the extraction of the flux. (ii) The error in the shower shape modeling, estimated by extracting the flux using two definitions of . Analogous to the definition of given in eq. (2), we define to be the ratio of the sum of the energy deposited outside the first four scintillation counters to the total visible energy. If the modeling of the showers were correct, the difference in the number of electron neutrinos measured by the two methods should be small, any difference is used to estimate the systematic error. Since this error was shown not to be correlated among energy bins, we add it in quadrature to the statistical error from the fit and take this to be the combined basic error. (iii) The 1% uncertainty in the absolute energy calibration of the detector changes the relative neutrino flux which is extracted using the subset of the data sample with low hadron energy [11]. (iv) The uncertainty in the incident flux of ’s on the detector is estimated to be [10]. This error is dominated by a 20% production uncertainty in the content of the secondary beam which produces 16% of the flux. The majority of the flux comes from decays, which are well-constrained by the observed spectrum from decays [10]. Other sources of systematic errors were also investigated and found to be small.
| (eV2) | Best fit | (eV2) | Best fit | ||||||||||||||||||||||||||||||||||||||||||||||||||||||||||||||||||||||||||||||||||||||||||||||||||||||||||||||||||||
|---|---|---|---|---|---|---|---|---|---|---|---|---|---|---|---|---|---|---|---|---|---|---|---|---|---|---|---|---|---|---|---|---|---|---|---|---|---|---|---|---|---|---|---|---|---|---|---|---|---|---|---|---|---|---|---|---|---|---|---|---|---|---|---|---|---|---|---|---|---|---|---|---|---|---|---|---|---|---|---|---|---|---|---|---|---|---|---|---|---|---|---|---|---|---|---|---|---|---|---|---|---|---|---|---|---|---|---|---|---|---|---|---|---|---|---|---|---|---|---|
|
|
|
|
|
|
The data are fit by forming a which incorporates the Monte Carlo generated effect of oscillations, the basic error, and terms with coefficients accounting for systematic uncertainties. A best fit is determined for each by minimizing the as a function of and these systematic coefficients. At all , the data are consistent with no observed oscillations. The statistical significance of the best-fit oscillation at any is at most .
The frequentist approach [12] is used to set a 90% confidence upper limit for each . The limit in corresponds to a shift of 1.64 units in from the minimum (at the best fit value in Table I). The 90% confidence upper limit is plotted in Figure 4 for . The best limit of is at . For , is excluded, and for , .
Under the assumption that there are no oscillations, this data can also be used to test universality by comparing the observed flux to that predicted by the Monte Carlo. From this comparison we determine the ratio of the cross sections averaged over our flux to be . This is currently the most stringent test of universality at high space-like momentum transfer.
In conclusion, we have used the difference in the longitudinal shower energy deposition pattern of versus interactions to search for oscillations with a coarse-grained calorimetric detector. We see a result consistent with no neutrino oscillations and find 90% confidence level excluded regions in the phase space. This result is the most stringent limit to date for oscillation for . We also tested universality and found the ratio of the -to- cross-section to be .
REFERENCES
- [1] B. Pontecorvo, JETP, 6, 429 (1958); Z. Maki, M. Nakagawa and S. Sakata, Prog. Theor. Phys. 28, 870 (1962).
- [2] L. A. Ahrens et al. , Phys. Rev. D36, 702 (1987).
- [3] L. Borodovsky et al. , Phys. Rev. Lett. 68, 274 (1992).
- [4] B.A. Bodmann et al., Nucl. Phys. A553, 831c (1993).
- [5] C. Athanassopolous et al., Phys. Rev. Lett. 77, 3082 (1996).
- [6] K.S. McFarland, D. Naples et al., Phys. Rev. Lett., 75, 3993 (1995).
- [7] W.K. Sakumoto et al., Nucl. Instrum. Methods, A294, 179 (1990).
- [8] B.J. King et al., Nucl. Instrum. Methods, A302, 254 (1991).
- [9] CN/ASD, GEANT, detetector description and simulation tool, CERN (1995).
- [10] C. Arroyo et al., Phys. Rev. Lett. 72, 3452 (1994); Bruce J. King, PhD Thesis, Columbia University (1994), Nevis preprint 284, unpublished.
- [11] P.Z. Quintas, PhD Thesis, Columbia University (1992), Nevis Preprint 277, unpublished; W.C. Leung, PhD Thesis, Columbia University (1991), Nevis Preprint 276, unpublished.
- [12] Particle Data Group, Phys. Rev. D54,164 (1996).