Measurement of the atmospheric neutrino flavour composition in Soudan 2
Abstract
The atmospheric neutrino flavour ratio measured using a 1.52 kton-year exposure of Soudan 2 is found to be relative to the expected value from a Monte Carlo calculation. The possible background of interactions of neutrons and photons produced in muon interactions in the rock surrounding the detector has been investigated and is shown not to produce low values of the ratio.
, , , , , , , , , , , , , , , , , , , , , , , , , , , , , , , , , , , , , , , , , , , , , , , , , , , , ,
1 Introduction
The flavour content of atmospheric neutrino interactions has previously been measured in four underground experiments [1, 2, 3, 4]. The first two experiments, those performed in water Cherenkov detectors, found that the ratio of to events (tagged by the outgoing lepton) was different from that expected from their Monte Carlo calculations. On the other hand the latter two experiments, carried out in iron calorimeters, found consistency , albeit with inferior statistical precision.
In order to cancel the uncertainties in the overall cosmic ray flux it is desirable to present the result in the form of the double ratio
The water Cherenkov experiments have selected as a measure of the rate, single track (muon) events and the rate, single shower (electron) events. One can then form the experimental ratio
The water Cherenkov detectors found values of between and [5]. The Frejus iron calorimeter experiment, using all events rather than only single prong events and including uncontained events, found a double ratio consistent with 1.0
Since the first reports of this anomaly much effort has been invested in verification of the Monte Carlo calculations [6] and in checking the experimental procedures [7]. No convincing explanation for the water Cherenkov anomaly not involving new physics has been put forward. However there still may be undetected backgrounds or experimental problems. In particular it has been postulated [8] that the effect may be due to a background of neutron produced events, though evidence against this has been produced by the Kamiokande experiment [5]. The possibility remains that the flavour content has changed between the production in the upper atmosphere and their interaction in the underground detectors, implying that flavour oscillations have taken place, that neutrinos have mass and that physics beyond the standard model is being observed.
In this letter we report a measurement of the flavour ratio in Soudan 2 from an exposure of 1.52 fiducial kton-years. The value of obtained is:
Although on its own the deviation from unity is not significant, the agreement of the sign of the discrepancy with the water Cherenkov data adds weight to the hypothesis of a real effect.
Soudan 2 is an iron calorimeter with different experimental systematics from the water Cherenkov detectors and with a different geometry and detection technique to the Frejus experiment. Background events produced by neutral particles entering the detector from the interactions of cosmic ray muons in the surrounding rock are tagged by a hermetic active shield. We show that our low value of is not due to a contamination from such events. Our measured value of the track/shower ratio for neutron produced events does not support the hypothesis that the anomaly in the Kamiokande and IMB experiments is due to such a contamination.
2 The Soudan 2 detector
The Soudan 2 experiment is located 710 meters underground in the Soudan Underground Mine State Park, Soudan, Minnesota,USA. The main detector is a time projection,tracking calorimeter with a total mass of 963 metric tons. It consists of 224 modules each weighing 4.3 tons and having an average density of 1.6 g/cc. It is surrounded by an active shield of aluminum proportional tubes.
About 85% of the mass of a module is provided by 1.6 mm thick sheets of corrugated steel. The sheets are stacked to form a hexagonal ‘honeycomb’ structure. Plastic drift tubes (1.0 m long and 15 mm in diameter) fill the spaces in the honeycomb. An 85% argon/15% CO2 gas mixture is recirculated through the modules. Ionization deposited in the gas drifts toward the closer end of the tube in an 180 volt/cm electric field. The drift velocity is approximately cm/sec, which yields a maximum drift time of 83 sec.
On reaching the end of the tube, the charge is detected by vertical anode wires and horizontal cathode strips. The signals from widely separated wires and strips are summed to reduce the number of readout channels. The summing is designed such that matching a pulse from an anode and cathode channel uniquely identifies the module and tube from which the ionization drifted. The signals are digitized every 200 nsec and are stored in a 1024 word buffer. The primary trigger condition requires activity at different times in any 7 anode OR 8 cathode channels out of any block of 16 channels within a total gate of 72 sec. Further details of module construction may be found in reference [9], its performance in a cosmic ray test stand in [10] and the performance at the Soudan mine in [11].
The calorimeter is surrounded by a 1700 m2 active shield designed to identify particles which enter or exit the detector cavern. The shield covers about 97% of the total solid angle. The basic element is an extruded aluminium manifold, up to 8m long, consisting of eight hexagonal proportional tubes arranged in two layers of four. The four tubes in each layer are connected together and read out as one signal. The random rate in a tube layer coming from natural radioactivity ( Hz m-2) would produce an unacceptably high rejection rate. Thus a coincidence of an adjacent inner and outer layer is required to signal a high energy particle entering or leaving the cavern. The measured efficiency of a coincidence for a single, high energy particle traversing a shield element is 95%. More details of the shield construction and performance can be found in reference [12].
The completed detector runs at a trigger rate of 0.5 Hz. Approximately two thirds of triggers come from cosmic ray muons passing through the detector. Most of the remainder are due to electrical noise or naturally occurring radioactivity. The detector routinely runs with an overall efficiency of % which rises to over during nights and weekends when the laboratory is not occupied. Immediately after completion of a run the data are processed to reconstruct the events and sort them into output files of candidate events for various physics analyses.
Every 240 seconds a data acquisition sequence is initiated, irrespective of detector activity. These ‘pulser’ events provide a snapshot of the background levels in the main detector and are used as underlying events to add detector noise to Monte Carlo events.
3 Data Analysis
3.1 Data reduction
The data considered in this letter come from a 1.52 kton-year exposure between April 1989 and December 1993. During this period the detector was under construction, starting with a total mass of 275 tons and ending with the complete 963 tons. A total of 43 million triggers was taken.
The goal of the data reduction is to obtain a sample of ‘contained events’ which will be used both for the atmospheric neutrino analysis described here and for a search for proton decay. A contained event is defined as one in which no primary particle in the event leaves the fiducial volume of the detector, defined by a 20 cm depth cut on all sides of the detector.
The events are passed through a software filter to reject events with tracks entering or leaving the fiducial volume (mostly cosmic ray muons) or events which have the characteristics of radioactive background or electronic noise. Approximately 1 event per 1500 triggers passes this filter.
The selected events are then double scanned to check containment and to reject background events, using an interactive graphics program. The main backgrounds are residual radioactive and electronic noise, badly reconstructed cosmic ray muons and events where muons pass down the gaps between individual modules, either finally entering a module and stopping or interacting in material in the gap and sending secondary tracks into the modules. Any event with a track which starts or ends on a gap, or which can be projected through a gap to the exterior of the detector is rejected. In addition, events with a vertex in the crack region are rejected. Differences between scanners are resolved by a second level scan. Approximately 1 event in 40 passed by the program filter is finally selected as contained. The average efficiency of individual scanners in selecting contained events was 93.5%. Further details of the event selection procedure can be found in reference [11].
3.2 Monte Carlo analysis
A Monte Carlo simulation of the experiment has been developed which reproduces as closely as possible the experimental data. In particular, Monte Carlo events have been made visually indistinguishable from true data events to experienced physicist scanners. This currently enables Monte Carlo events to be inserted randomly into the data stream and to be processed simultaneously with the data events, ensuring that they are treated identically. This version of the Monte Carlo program was not available at the beginning of the experiment. The last third of the data set reported here had Monte Carlo events inserted at the scanning level. The first two thirds were initially processed independently of the Monte Carlo. Although the Monte Carlo corresponding to this earlier data was processed and scanned separately great care was taken to follow the same procedures as for the real data and thus avoid biases.
Monte Carlo events equivalent to 5.9 times the exposure of the real data were generated and passed through exactly the same data analysis procedure as described in section 3.1.
The neutrinos were generated using the BGS flux[13]. The variation of the intensity with the solar cycle was corrected using neutron monitor data[11, 14].
At the low energies characteristic of the atmospheric flux the predominant interactions are quasi-elastic or resonance production. Full details of the event generation process and a detailed comparison with all available low energy data are given in reference [11]. Nuclear physics effects were represented by the Fermi gas model. Rescattering of pions within the nucleus was applied using data obtained by comparison of bubble chamber interactions on deuterium and neon [15].
Events were generated to simulate the exact size and configuration of the detector as it grew during this exposure. Particles produced in the neutrino interactions were tracked through the detector geometry using the EGS and GEISHA codes. Particles crossing the drift tubes had amounts of ionization deposited in the gas selected from the distribution of reference [16]. The ionization was drifted, with appropriate attenuation and diffusion, to the anode wires where the effects of the avalanche and electronics response were closely simulated. The generated event was superimposed on a pulser trigger which reproduces noise and background in the detector as they vary with calendar time.
A comparison of physical quantities, including topologies and energy distributions, between data and Monte Carlo showed no discrepancies outside the possible effects of the atmospheric neutrino flavour anomaly discussed in this paper. In addition the Monte Carlo representation of tracks and showers has been tested against data taken at the Rutherford Appleton Laboratory ISIS test beam facility which provided electrons, pions and muons up to a momentum of 400 MeV/c and protons up to 800 Mev/c.
3.3 Event classification and reconstruction
The aim of this analysis is to measure the flavour content of neutrinos incident on the detector after their passage from the upper atmosphere. Given the predominance of quasi-elastic scattering the relative rate of single shower (electron) and single track (muon) events is a good measurement of the flavour content. It is also the measurement made in the water Cherenkov detectors. We expect in the future to use the superior track separation and reconstruction properties of Soudan 2 to flavour classify events with multiple tracks but the objective of this paper is to repeat the earlier measurements.
The lepton flavour of each event is determined by the second level scanners who flag them as ‘track’, ‘shower’ or ‘multiprong’. Tracks which have heavy ionization and are straight are further classified as ‘protons’. Proton recoils accompanying tracks and showers are an additional tag of quasi-elastic scattering and are ignored in the classification. Any second track or shower in the event results in a multiprong classification. As a test of the systematic uncertainties introduced by the classification process, all scanning was done independently by two groups prior to merging for the final results.
The quality of the flavour assignment was measured using the Monte Carlo data. Table 1 gives the identification matrix for Monte Carlo events selected as contained.
| Assigned | ||||
|---|---|---|---|---|
| Generated | Track | Shower | Multiprong | Proton |
| cc | 242 | 3 | 98 | 6 |
| cc | 15 | 255 | 110 | 1 |
| Neutral current | 21 | 9 | 44 | 18 |
It can be seen that 87% of events assigned as tracks have muon flavour and 96% of showers electron flavour. The identification matrix is consistent between the first two thirds of the data when the scanners were aware that they were scanning MC events and the last third when the events were randomly mixed. The ratio of accepted muon to electron charged current events is approximately 1:1, different from the expected ratio of 2:1 from the decay chain. At these low energies threshold effects due to the difference in the muon and electron masses cause the generated event ratio to be approximately 1.5:1. Acceptance differences for high energy muons and electrons and the cuts required to remove background produced by cosmic ray muons passing down the gaps between modules further reduce the ratio.
Each contained event is reconstructed, using the interactive graphics system, to determine its position and the energy of the identified particles. A vertex is assigned, and the location of the ends of any tracks is marked.
Electron showers are reconstructed using a clustering algorithm to select all hits lying within 60 cm of their nearest neighbour. The shower direction is determined using these hits and the vertex defined by the scanner. The shower energy is calculated from the number of hits. The energy is calibrated using the results of a test beam exposure of a module to electrons below 400 MeV at the Rutherford Appleton Laboratory ISIS facility and to Monte Carlo showers at higher energies. Early data had some contamination of the shower sample from electrical breakdown in some modules. This was much improved as the experiment progressed by optimization of the wireplane voltages and refurbishment of the worst modules. In order to remove this contamination a cut which required hits was applied to the showers, corresponding to an energy cut of approximately 150 MeV. Raising this cut had no significant effect on the ratio .
Tracks are reconstructed by fitting a polynomial to the hits belonging to the track. The amount of material traversed by the particle along the fit trajectory is calculated by tracking the polynomial through the detailed geometry of the module. The range is then converted into a particle energy by integrating the Bethe-Bloch equation, assuming a muon mass. The energy calibration has again been checked using data from the test beam exposure. A minimum of 6 hits on the track was required, corresponding to a muon kinetic energy cut-off of approximately 40 MeV. Tracks produce a very regular pattern of hits in the honeycomb geometry which breakdown processes do not reproduce and there is no evidence of such contamination of the track sample.
3.4 Shield data and the identification of events
A total of 723 data events are classified as contained. This is much greater than the expected neutrino rate of about 100 events/kton-year. We conclude that the majority of these events are due to the interactions of neutral particles (neutrons or photons) produced by muon interactions in the rock around the detector. The active shield is designed to flag such events by detecting the muon and/or other charged particles which are produced in the muon interaction but do not enter the main detector. It was placed as close to the cavern wall and as far away from the detector as possible to maximize the probability of detecting the accompanying charged particles. Calculations [17] indicate that only a few per cent of such events will not have charged particles traversing the shield.
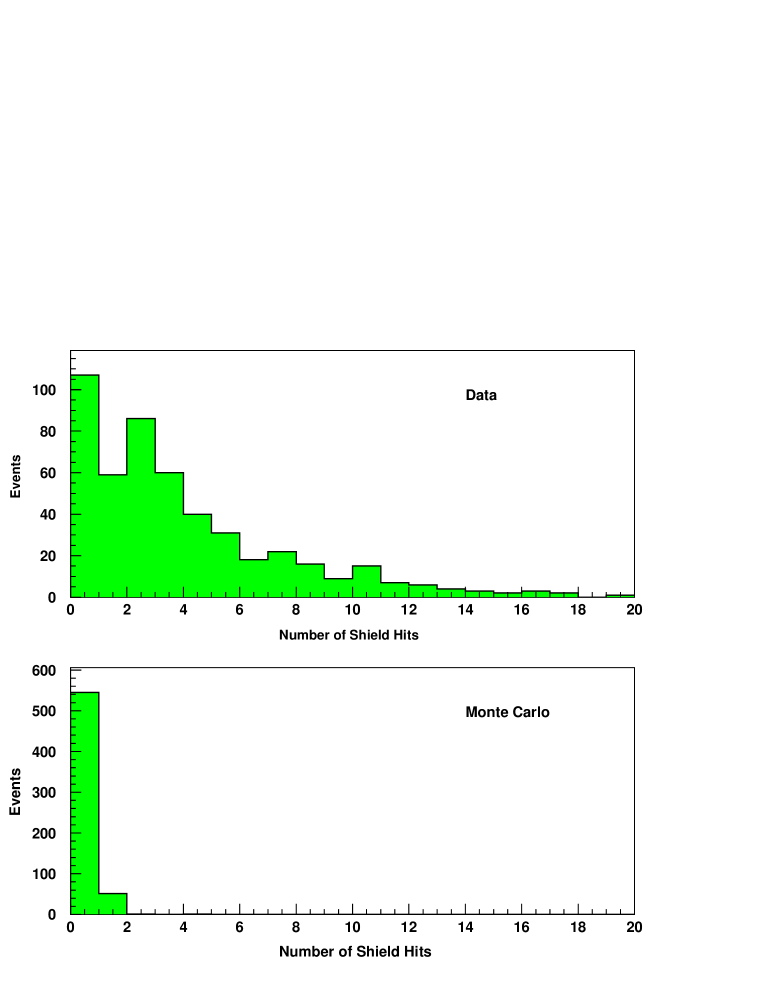
Figure 1(top) is a histogram of the number of coincident shield hits accompanying each track or shower event. The events with no shield hits are defined as our sample (‘gold’ events) and the events with shield hits are defined as arising from muon interactions (‘rock’ events).
Figure 1(bottom) shows the same plot for Monte Carlo contained events. The events with shield hits are due to random shield hits in the background pulser events during the allowed time window of the MC event. A total of 53 out of 598 (8.9%) of Monte Carlo events had random shield coincidences. The random veto events are almost all of multiplicity 1, consistent with the veto being due to Compton electrons produced by photons from the natural radioactivity in the rock. The random vetoing of real events is simulated by selecting only events with no shield hits for the Monte Carlo gold sample.
Rock events produced by a muon which passes through the cavern should give at least two shield hits. The one shield hit events are a combination of zero shield hit events with random hits, genuine one shield hit events where the entering charged particle is stopped in the cavern and potential two shield hit events with a missing hit due to shield inefficiency. The efficiency of the shield has been measured using cosmic ray muons detected in the main detector. It ranges from 81% during the early data runs before the geometrical coverage was complete to 93% at the end of this data period, equal to the convolution of the geometrical coverage and the single tube efficiency. Using the number of 0, 1 and 2 hit events we estimate that gold events are due to muon interactions with a charged particle passing through the shield which was not recorded due to shield inefficiency.
Our sample of rock events, used to determine the properties of any potential non-neutrino background, was defined as those with shield hits since the one shield hit event sample also contains randomly vetoed neutrino events
Table 2 gives the raw numbers of gold, rock and gold MC events in our sample, divided into track, shower, multiprong and proton. The ratio of single prong to multiprong events in our data is higher than in previous experiments. Our track energy threshold is lower than the Cherenkov threshold in water and both track and shower thresholds are considerably lower than those of Frejus. Also the requirement that no track ends on a gap between modules preferentially rejects multiprongs.
| Track | Shower | Multiprong | Proton | |
|---|---|---|---|---|
| Data: gold | 47 | 60 | 51 | 10 |
| Data: rock | 160 | 169 | 90 | 56 |
| MC | 278 | 267 | 252 | 25 |
4 Measurement of the flavour ratio
4.1 Background determination
In section 3.4 it was estimated that a background of rock events was expected in the gold sample because of shield inefficiency. There is also the possibility that neutrons or photons may enter the detector without being accompanied by charged particles in the shield. Our large sample of rock events enables us to investigate this potential background by studying the depth distribution of the events in the detector.
The events produced by photons and neutrons will be attenuated towards the centre of the detector, whilst the neutrino events will be uniformly distributed through the detector. Since the directions of the particles produced in neutron interactions will not in general be the same as that of the incident neutron we cannot directly measure the distance that the neutron travelled through the detector. Instead we define a measure of the proximity of the event to the detector exterior by calculating the minimum perpendicular distance from the event vertex to the detector edge. Since few rock photons and neutrons are expected to travel upwards and the base of the detector does not have an excess of rock vertices, the floor is not considered to be an ‘edge’ for the purposes of this calculation. Figure 2 shows this depth distribution for gold, Monte Carlo and rock tracks and showers. The Monte Carlo distributions are normalized to the exposure of the experiment and the rock sample is normalized to the same number of events as the data sample.
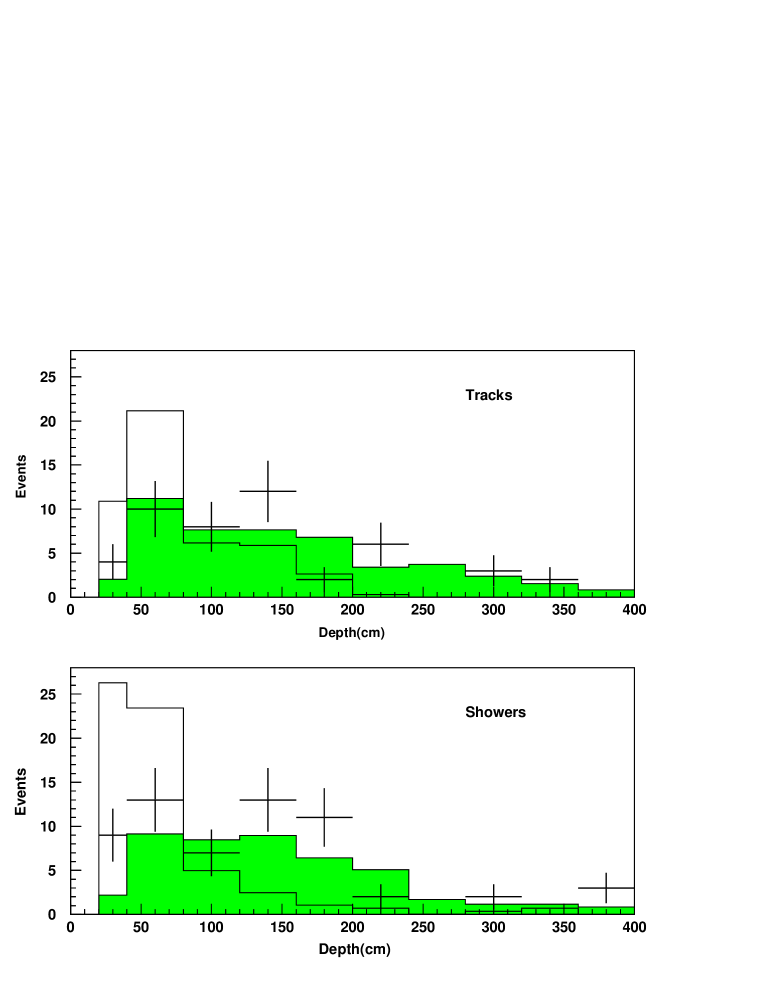
The rock shower and rock track depth distributions are different. The track distribution is consistent with being produced by incoming neutrons with an interaction length of approximately 80 cm. The shower distribution appears to have two components, a long range component consistent with neutrons and a short range component which we attribute to photons. The short range component has a depth distribution consistent with the photon conversion length of 15cm measured in a module at the ISIS test beam [18]. Figure 3(bottom) shows the integral track/shower ratio as a function of depth cut. The ratio rises as events near the edge of the detector are removed, reaching a plateau at a depth cut of around 60 cm when the photon component has been fully attenuated.

Comparison of the Monte Carlo and the gold data depth distributions indicates that there may be a small excess of events at small depth in the shower sample whilst the track distribution closely follows the expected neutrino distribution. However the discrimination between rock and MC distributions is better in the shower sample because of the short distance photon component.
The interactions of the neutral particles in the detector are not expected to be strongly correlated with the number of shield hits. This is verified in figure 3(top) which shows the track/shower ratio to be constant as a function of number of shield hits. We therefore use the full rock sample to estimate the amount of zero shield hit rock background in the gold sample. We have made fits of the shape of the gold distributions of figure 2 to the sum of the shapes of the rock and MC distributions with one free parameter, the fraction of the rock background required in the gold distribution. The bins at large depths were combined to give at least 5 gold events per bin, giving a total of 6 bins in each distribution. A fit with the background set to zero gave of 0.22 and 1.42 for the track and shower distributions respectively. The fit of the tracks is very good while the shower fit probability is about 20%. To this level the fits do not require any background contribution. However as described above we expect some rock contamination so we continue with a second fit which allows a free amount of background in each distribution. The are now 0.19 and 0.54. The track fit is not improved but there is a significant drop in for the shower distribution. As expected from examination of figure 2 more background is suggested in the shower depth distribution than in the track distribution. We find background events in the track sample and in the shower sample, yielding a track/shower ratio of for background events. This is consistent with, but numerically rather different to the measured rock event ratio of . In a third fit we constrain the ratio of the background in the gold tracks and showers to be equal to the measured ratio in the rock events. The for the combined track and shower fit is 0.42 and it gives a total background of events, which are to be divided between tracks and showers in the measured rock ratio. The number of background events is consistent with those found in the unconstrained fits and the fit quality is equally good. We use the constrained fit in the calculation of since it is consistent with the other fits, it uses the maximum amount of measured information, and it produces the smallest errors on . The small systematic errors which are introduced by the assumption that the background in the gold sample is represented by the rock sample are considered in the next section.
4.2 Calculation of
To calculate we correct the raw numbers of gold events using the background estimated in the constrained fit. Note that the error on the correction depends on the errors on the fraction of rock events in the gold sample and the measured rock ratio, not on the uncorrelated errors on the number of background events. The numbers entering the calculation and the corrected and uncorrected values of are given in table 3. The error on includes the error due to the background subtraction as well as the statistical errors on the numbers of data and Monte Carlo events. The background correction has only a small effect on the value of but adds to the error.
| Number of gold tracks | 47 |
|---|---|
| Number of gold showers | 60 |
| Number of MC tracks | 278 (47.1) |
| Number of MC showers | 267 (45.3) |
| Number of rock tracks | 160 |
| Number of rock showers | 169 |
| Rock track/shower ratio | |
| Fraction of rock events in gold sample | |
| Corrected number of tracks | 37.0 |
| Corrected number of showers | 49.4 |
| Raw value of (no background correction) | |
| Corrected value of |
The systematic errors which could effect the value of may be divided into the following categories:
-
•
Systematic uncertainties in the incident neutrino flux ratio. A number of calculations have been made of the neutrino fluxes, summarized and corrected in a recent review [6]. There is agreement that although the absolute rate is uncertain to the order of the flux ratio is much better known. We take an uncertainty of in .
-
•
Systematic uncertainties in the neutrino generator. These include factors such as the uncertainty in the axial vector mass, the various cross sections, the treatment of Fermi motion, the uncertainty in the intranuclear absorption etc. All these factors are considered in more detail in reference [11]. It should be remembered that neutrino universality constrains the and cross sections to be equal up to mass effects. We estimate they contribute an amount in .
-
•
Systematic uncertainties introduced by the scanning process. In order to estimate this contribution the data was independently scanned and classified by two different groups before the groups merged. A value of was calculated by each group independently. The difference in the raw value was 0.02. Since the final result was obtained by combining the two groups and resolving differences we expect the final error due to systematic scanning differences to be smaller than this. However we take the full difference and assign a systematic error on of .
-
•
Systematic uncertainties on the background subtraction. The main systematic error lies in the assumption that the track/shower ratio of the zero shield hit rock background is the same as that of the shield hit rock events. It was shown in figure 3(top) that this ratio is constant as a function of number of shield hits. However, it might be expected that zero shield hit events arise from interactions deeper in the rock than those giving shield hits since both the muon and any associated charged particles have to miss the shield. Neutrons and photons produced in these interactions would have to pass through more rock absorber. The photon component would be attenuated faster than the neutron and the resulting events would contain a reduced fraction of shower events.
The effect of absorption in the rock may be simulated by calculating the track/shower ratio for different depth cuts in the main detector. As in the rock, the photon component is attenuated faster than the neutron component. The track/shower ratio, plotted as a function of depth cut (figure 3(bottom)), rises to a plateau when the photon component is completely absorbed. We take , the value at a depth of 80 cm, as our measurement of the ratio for pure neutrons. We estimate the systematic error on by repeating the calculation with background ratios having values between those measured for the full rock sample and the pure neutron sample, including allowance for the errors on these numbers. This produces a variation of from 0.74 to 0.67. We take this variation as an estimate of the systematic error. Note that the possible rise in the background ratio due to absorption of the photon component results in a shift towards smaller R, i.e. further from the expected value of 1.0.
We have studied the effects of applying an extra cut on the depth distribution to remove events closest to the exterior of the detector. Within the statistical limits on the data we see no significant change in . The uncut data provides the maximum statistics and the best determination of the background fraction and thus the smallest error on .
| Error | |
|---|---|
| Neutrino flux | |
| Monte Carlo systematics | |
| Scanning systematics | |
| Background subtraction | +0.02 -0.05 |
| Total systematic error | +0.05 -0.07 |
The systematic errors are summarized in table 4.
4.3 Absolute rates
The rate of track events is of the expected rate and of showers . The errors do not include the systematic error on the flux calculation, estimated to be by reference [6]. If the BGS flux[13] is accurate we would support the hypothesis that the anomaly results more from a loss of events than a gain of events.
We have investigated other possible systematic effects on the absolute rates. These include uncertainties in the Fermi gas model, particularly in the Pauli blocking of inelastic interactions producing a low energy nucleon, uncertainties in the cross-sections, biases introduced by the detector trigger and biases in the scanning process. We estimate that these produce a further 6.4% systematic error on the ratio of measured to expected tracks and 7.5% on the showers.
5 Conclusions
We have measured the flavour ratio of ratios () in atmospheric neutrino interactions using a 1.52 kton-year exposure of Soudan 2. We find . This value is about from the expected value of 1.0 and is consistent with the anomalous ratios measured by the Kamiokande and IMB experiments. However we note that since our acceptance matrix is different from those of the water Cherenkov experiments we would not expect to measure the same value of R, particularly if physics processes are occurring which are not simulated in our Monte Carlo. There is approximately a 7% chance that our measurement would statistically give 0.72 or less if the true answer is 1.0. To this level we support the observation of an anomaly in the atmospheric neutrino flavour ratio in a detector using a completely different detection technique and with different systematic biases. Data taking in Soudan 2 is continuing and completion of our planned 5 kton-year exposure in 1999 should definitively resolve the question of the presence or otherwise of an anomaly.
We have investigated and corrected for backgrounds due to the interaction of neutrons or photons produced by interactions in the rock surrounding our detector. We have measured the track/shower ratio for neutrons entering Soudan 2 and find a value of . Making allowance for the fraction of the tracks (pions or protons) which would be below Cherenkov threshold in water we cannot reduce this ratio significantly below 1.0. This is in contradiction to the hypothesis [8] that the anomaly in the Kamiokande and IMB detectors could be due to a substantial excess of shower events in neutron background.
References
- [1] Y. Fukuda et al., Phys. Lett. B 335 (1994) 237.
- [2] R. Becker-Szendy et al., Phys. Rev. D 46 (1992) 3720.
- [3] K. Daum et al., Z. Phys. C 66 (1995) 417.
- [4] M. Aglietta et al., Europhys. Lett. 8 (1989) 611.
- [5] Y. Suzuki, Rapporteur’s talk, 28th International Conference on High Energy Physics, Warsaw, Poland July 1996
- [6] T.K. Gaisser et al., Preprint hep-ph/9608253, to be published.
- [7] S. Kasuga, A study of the Particle Identification Capability with a Water Cherenkov Detector, Masters Thesis, University of Tokyo (1995).
- [8] O.G. Ryazhskaya, JETP. Lett. 60 (1994) 617.
- [9] W.W.M. Allison et al., NIM A 376 (1996) 36.
- [10] W.W.M. Allison et al., NIM A, to be published.
- [11] H. Gallagher, Neutrino Oscillation Searches with the Soudan 2 detector, PhD Thesis, University of Minnesota (1996).
- [12] W.P. Oliver et al., NIM A 276 (1989) 371.
- [13] G. Barr,T.K. Gaisser and T. Stanev, Phys Rev D 39 (1989) 3532.
- [14] J. Beiber, Bartol Research Institute, private communication.
- [15] R. Merenyi et al., Phys. Rev. D 45 (1992) 743 and R.Merenyi, A study of Intranuclear scattering in Ne versus D interactions: Implications for Nucleon Decay Searches, PhD Thesis, Tufts University, 1990.
- [16] W.W.M. Allison and J.H. Cobb, Ann. Rev. Nucl. Sci. 30 (1980) 253.
- [17] K. Ruddick, The neutron background in the Contained Event Sample, Soudan 2 internal note, PDK-642 (1996), unpublished.
- [18] C. Garcia-Garcia, Soudan 2 response to low energy particles, Soudan 2 internal note, PDK-449 (1990), unpublished.