Top Quark Physics Results from CDF and D0
Abstract
I summarize recent top quark physics results from the Fermilab Tevatron experiments. Since the observation of the top quark by CDF and D0 in 1995, the experimental focus has shifted to a detailed study of the top quark’s properties. This article describes recent measurements of the top quark production cross section, mass, kinematic properties, branching ratios, , and the polarization in top decays.
1 Introduction
The existence of the top quark, which is required in the Standard Model as the weak isospin partner of the bottom quark, was firmly established in 1995 by the CDF[1] and D0[2] experiments at the Fermilab Tevatron, confirming earlier evidence presented by CDF[3, 4]. Each experiment reported a roughly 5 excess of candidate events over background, together with a peak in the mass distrbution for fully reconstructed events. The datasets used in these analyses were about 60% of the eventual Run I totals. With the top quark well in hand and over 100 pb-1 of data collected per experiment, the emphasis has now shifted to a more precise study of the top quark’s properties.
In collisions at TeV, the dominant top quark production mechanism is pair production through annihilation. In the Standard Model, each top quark decays immediately to a boson and a quark. The observed event topology is then determined by the decay mode of the two ’s. Events are classified by the number of ’s that decay leptonically. About 5% of the time each decays to or (the “dilepton channel”), yielding a final state with two isolated, high- charged leptons, substantial missing transverse energy () from the undetected energetic neutrinos, and two quark jets. This final state is extremely clean but suffers from a low rate. The “lepton + jets” final state occurs in the 30% of decays where when one decays to leptons and the other decays into quarks. These events contain a single high- lepton, large , and (nominally) four jets, two of which are from ’s. Backgrounds in this channel can be reduced to an acceptable level through -tagging and/or kinematic cuts, and the large branching ratio to this final state makes it the preferred channel for studying the top quark at the Tevatron. The “all-hadronic” final state occurs when both ’s decay to , which happens 44% of the time. This final state contains no leptons, low , and six jets, including two jets. Although the QCD backgrounds in this channel are formidable, extraction of the signal is possible through a combination of -tagging and kinematic cuts. Finally, approximately 21% of decays are to final states containing ’s. Backgrounds to hadronic decays are large, and while signals have been identified I will not discuss these analyses here.
This paper is organized as follows. Section 2 discusses the measurement of the production cross section. The measurement of the top quark mass is described in Section 3. Kinematic properties of production are described in Section 4. The measurement of the top quark branching ratio to and the CKM matrix element is described in Section 5. Section 6 discusses searches for rare or forbidden decays of the top. Section 7 discusses a measurement of the polarization in top decays. Section 8 concludes.
2 Production Cross Section
The measurement of the top quark production cross section is of interest for a number of reasons. First, it checks QCD calculations of top production, which have been performed by several groups[5, 6, 7]. Second, it provides an important benchmark for estimating top yields in future high-statistics experiments at the Tevatron and LHC. Finally, a value of the cross section significantly different from the QCD prediction could indicate nonstandard production or decay mechanisms, for example production through the decay of an intermediate high-mass state or decays to final states other than .
2.1 CDF Measurements of
The CDF collaboration has measured the production cross section in the dilepton and lepton + jets modes, and in addition has recently performed a measurement in the all-hadronic channel. The dilepton and lepton + jets analyses begin with a common inclusive lepton sample, which requires an isolated electron or muon with GeV and . The integrated luminosity of this sample is 110 pb-1.
For the dilepton analysis, a second lepton is required with GeV. The second lepton must have an opposite electric charge to the primary lepton and may satisfy a looser set of identification cuts. In addition, two jets with GeV are required, and the must be greater than 25 GeV. For the case GeV, the vector must be separated from the nearest lepton or jet by at least 20 degrees. This cut rejects backgrounds from decays followed by (where the tends to lie along the lepton direction) and from events containing poorly measured jets (where the tends to lie along a jet axis). Events where the dilepton invariant mass lies between 75 and 105 GeV are removed from the and channels as candidates. In addition, events containing a photon with GeV are removed if the invariant mass falls within the mass window. This “radiative ” cut removes one event from the channel and has a negligible effect on the acceptance and backgrounds. Nine dilepton candidates are observed: one , one , and seven events. Including a simulation of the trigger acceptance, the expected division of dilepton signal events is 58% , 27% , and 15% , consistent with the data. It is also interesting to note that four of the nine events are -tagged, including two double-tagged events. Although no explicit -tag requirement is made in the dilepton analysis, the fact that a large fraction of the events are tagged is powerful additional evidence of production.
Backgrounds in the dilepton channel arise from Drell-Yan production of lepton pairs, diboson production, , , and fakes. These backgrounds are estimated through a combination of data and Monte Carlo. The total background in the channels is events, and is events in the channel. Event yields, backgrounds, and estimated contributions are summarized in Table 1.
When these numbers are combined with the acceptance in the dilepton mode of % (including branching ratios), and using CDF’s measured top mass of 175 GeV (described below), the resulting cross section is pb.
| Background | ||
|---|---|---|
| Drell-Yan | — | |
| fakes | ||
| Total bkgd. | ||
| Expected , | 2.6, 1.6, 1.0 | 3.9, 2.4, 1.5 |
| Data (110 pb-1) | 2 | 7 |
The lepton + jets cross section analysis begins with the common inclusive lepton sample described above. An inclusive sample is selected from this sample by requiring GeV. Jets are clustered in a cone of , and at least three jets with GeV and are required in the signal region. (These jet energies are not corrected for detector effects, out-of-cone energy, the underlying event, etc. Such corrections are applied later, in the mass analysis. The average correction factor is about 1.4.) candidates are removed as before, and the lepton is required to pass an appropriate trigger. Finally, the event is required not to have been accepted by the dilepton analysis above. The dilepton and lepton + jets samples are therefore nonoverlapping by construction. There are 324 -jet events in this sample.
Signal to background in this sample is approximately 1:4. CDF employs two -tagging techniques to reduce background. The first technique identifies jets by searching for a lepton from the decay or . Since this lepton typically has a lower momentum than the the lepton from the primary decay, this technique is known as the “soft lepton tag” or SLT. In addition to tagging soft muons, as in the D0 analysis, CDF also identifies soft electrons. The second, more powerful, technique exploits the finite lifetime of the quark by searching for a secondary decay vertex. Identification of these vertices is possible because of the excellent impact parameter resolution of CDF’s silicon microstrip vertex detector, the SVX[9, 10]. This technique is known as the “SVX tag.”
The SLT algorithm identifies electrons and muons from semileptonic decays by matching central tracks with electromagnetic energy clusters or track segments in the muon chambers. To maintain acceptance for leptons coming from both direct and sequential decays, the threshold is kept low (2 GeV). The fiducial region for SLT-tagged leptons is . The efficiency for SLT-tagging a event is %, and the typical fake rate per jet is about 2%. The details of the SLT algorithm are discussed in Ref. [3].
The SVX algorithm begins by searching for displaced vertices containing three or more tracks which satisfy a “loose” set of track quality requirements. Loose track requirements are possible because the probability for three tracks to accidentally intersect at the same displaced space point is extremely low. If no such vertices are found, two-track vertices that satisfy more stringent quality cuts are accepted. A jet is defined to be tagged if it contains a secondary vertex whose transverse displacement (from the primary vertex) divided by its uncertainty is greater than three. The efficiency for SVX-tagging a event is %, nearly twice the efficiency of the SLT algorithm, while the fake rate is only % per jet. The single largest source of inefficiency comes from the fact that the SVX covers only about 65% of the Tevatron’s luminous region. SVX-tagging is CDF’s primary -tagging technique.
Table 2 summarizes the results of tagging in the lepton + jets sample. The signal region is jets, where there are 42 SVX tags in 34 events and 44 SLT tags in 40 events, on backgrounds of and events respectively. SVX backgrounds are dominated by real heavy flavor production (, , ), while SLT backgrounds are dominated by fakes. Monte Carlo calculations are used to determine the fraction of observed +jets events that contain a heavy quark, and then the observed tagging efficiency is used to derive the expected number of tags from these sources. Fake rates are measured in inclusive jet data. Backgrounds are corrected iteratively for the assumed content of the sample.
When combined with the overall acceptance in the lepton + jets mode, is measured to be pb using SVX tags, and pb using SLT tags.
| + 1 jet | +2 jets | 3 jets | |
|---|---|---|---|
| Before tagging | 10,716 | 1,663 | 324 |
| SVX tagged evts | 70 | 45 | 34 |
| SVX bkgd | |||
| Expected | |||
| SLT tagged evts | 245 | 82 | 40 |
| SLT bkgd | |||
| Expected |
CDF has also performed a measurement of in the all-hadronic channel, which nominally contains six jets, no leptons, and low . Unlike in the case of lepton + jets, -tagging alone is not sufficient to overcome the huge backgrounds from QCD multijet production. A combination of kinematic cuts and SVX -tagging is therefore used.
The initial dataset is a sample of about 230,000 events containing at least four jets with GeV and . Signal to background in this sample is a forbidding 1:1000, so a set of kinematic cuts is applied. The jet multiplicity is required to be , and the jets are required to be separated by . Additionally, the summed transverse energy of the jets is required to be greater than 300 GeV and to be “centrally” deposited: , where is the invariant mass of the multijet system. Finally, the subleading jets are required to pass an aplanarity cut. The resulting sample of 1630 events has a signal to background of about 1:15. After the requirement of an SVX tag, 192 events remain.
The tagging background is determined by appying the SVX tagging probabilities to the jets in the 1630 events selected by the analysis prior to tagging. The probabilities are measured from multijet events and are parametrized as a function of jet , , and SVX track multiplicity. The probability represents the fraction of jets which are tagged in the absence of a component, and includes real heavy flavor as well as mistags. Applying the tagging probabilities to the jets in the 1630 events remaining after kinematic cuts, a predicted background of events is obtained, compared to the 192 tagged events observed.
The efficiency to SVX-tag a event in the all-hadronic mode is %. This value is slightly larger than the lepton + jets case due to the presence of additional charm tags from . Combining this value with the acceptance for the all-hadronic mode, including the efficiency of the multijet trigger and the various kinematic cuts, CDF obtains a cross section in this channel of pb.
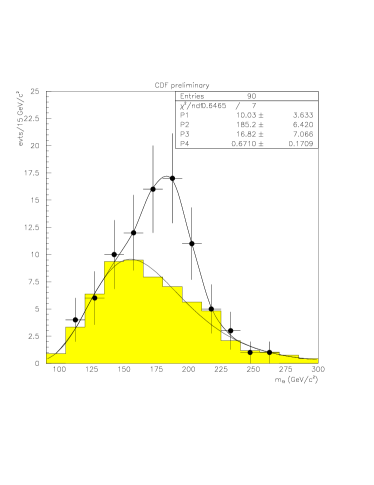
The large background in the all-hadronic channel makes it desirable to have some independent cross check that the observed excess of events is really due to production. The events in this sample with exactly six jets can be matched to partons from the process , and can be fully reconstructed. A plot of the reconstructed top mass for these events is shown in Fig. 1. The events clearly display a peak at the value of the top mass measured in other channels. This analysis impressively illustrates the power of SVX-tagging to extract signals from very difficult environments.
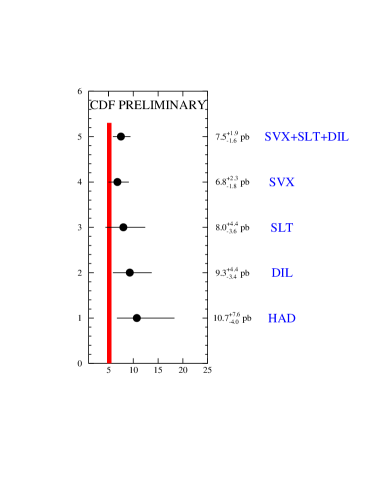
The combined cross section is obtained using the number of events, backgrounds, and acceptances for each of the channels. The calculation is done using the likelihood technique described in Ref. [3]. Acceptances are calculated using GeV. The likelihood method takes account of correlated uncertainties such as the luminosity uncertainty, acceptance uncertainty from initial state radiation, etc. The combined production cross section for GeV is
| (1) |
where the quoted uncertainty includes both statistical and systematic effects. Fig. 2 shows the individual and combined CDF measurements together with the theretical central value and spread. All measurements are in good agreement with theory, though all fall on the high side of the prediction. It is perhaps noteworthy that the single best measurement, from SVX-tagging in the lepton+jets mode, is the one closest to theory.
2.2 D0 Measurements of
The D0 collaboration has measured in both the dilepton (, , and ) and lepton + jets channels. The dilepton analysis is a straightforward counting experiment. Two high- leptons are required, as well as two jets. Cosmic ray and candidates are removed. In the and channels, a cut is also placed on the missing transverse energy. Finally, a cut on , the transverse energy of the jets plus the leading electron (or the jets only, in the case of dimuon events) is applied to reduce backgrounds from pairs, Drell-Yan, etc. The largest acceptance is in the channel, which also has the lowest backgrounds. Three candidate events are observed in this channel on a background of events. For = 180 GeV, signal events are expected in this channel. One event is observed in each of the and channels on backgrounds of and events respectively. For = 180 GeV, one expects and in these two channels.
The D0 measurement of in the lepton + jets channel makes use of two different approaches to reducing the background from +jets and other sources: topological/kinematic cuts, and -tagging. The first approach exploits the fact that the large top quark mass gives rise to kinematically distinctive events: the jets tend be more energetic and more central than jets in typical background events, and the events as a whole are more spherical. Top-enriched samples can therefore be selected with a set of topological and kinematic cuts. (For some earlier work on this subject, see Refs. [4] and [8].) In particular, the total hadronic activity in the event, , can be combined with the aplanarity of the + jets system to reduce backgrounds substantially. Cuts on both of these variables were used in the original D0 top discovery analysis[2], and these cuts have now been reoptimized on Monte Carlo samples for use in the cross section measurement. A third kinematic variable with discriminating power, the total leptonic transverse energy () is also used. Events are required to have four jets with GeV and In 105.9 pb-1 of + jet data, a total of 21 candidate events are observed, on a background of 9.23 2.83 events that is dominated by QCD production of + jets. For comparison, 19 3 (13 2) events are expected for (180) GeV, again using the theoretical cross section from Ref. [7].
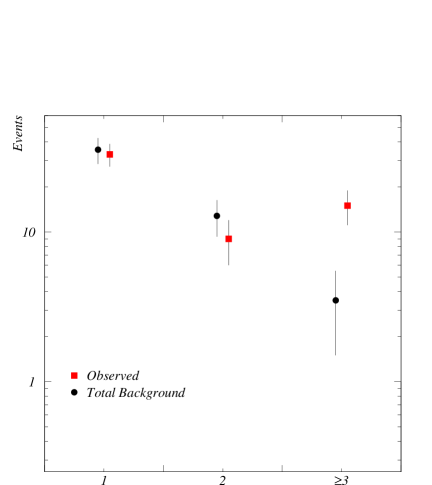
A second D0 approach to the lepton + jets cross section measurement makes use of -tagging via soft muon tags. Soft muons are expected to be produced in events through the decays and . Each event contains two ’s, and “tagging muons” from their semileptonic decays are detectable in about 20% of events. Background events, by contrast, contain a low fraction of quarks and thus produce soft muon tags at only the % level. Events selected for the lepton + jets + -tag analysis are required to contain an or with ( for muons) GeV, and to have respectively. At least three jets are required with GeV and The is required to be at least 20 GeV (35 GeV if the vector is near the tagging muon in an +jets event), and in + jets events is required to satisfy certain topological cuts aimed at rejecting backgrounds from fake muons. Loose cuts on the aplanarity and are also applied. Finally, the tagging muon is required to have GeV and to be near one of the jets, as would be expected in semileptonic decay. In 95.7 pb-1 of + jet data with a muon tag, 11 events are observed on a background ( + jets, fakes, and residual ’s) of 2.580.57 events. Theory[7] predicts 9.02.2 and 5.21.2 events for = 160 and 180 GeV respectively. Figure 3 shows the clear excess of events in the signal region compared to the top-poor regions of one and two jets.
Table 3 summarizes event yields and backgrounds in the D0 cross section analysis. A total of 37 events is observed in the various dilepton and lepton + jets channels on a total background of 13.43.0 events. The expected contribution from ( = 180 GeV) is 21.2 3.8 events.
| Channel | Bkgd. | Expected | Data | |
|---|---|---|---|---|
| 90.5 | 3 | |||
| 105.9 | 1 | |||
| 86.7 | 1 | |||
| +jets | 105.9 | 10 | ||
| +jets | 95.7 | 11 | ||
| +jets/ | 90.5 | 5 | ||
| +jets/ | 95.7 | 6 | ||
| Total | 37 |
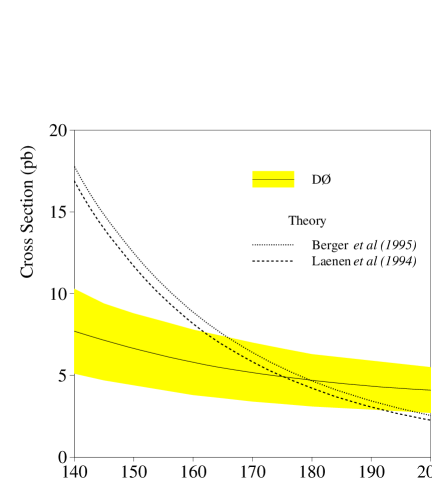
When combined with a Monte Carlo calculation of the acceptance, these numbers can be converted into a measurement of the cross section. Figure 4 shows the cross section derived from D0 data as a function of . For D0’s measured top mass of 170 GeV, described below, the measured cross section is
| (2) |
in good agreement with theory.
3 Top Quark Mass Measurement
The top quark mass is a fundamental parameter in the Standard Model. It plays an important role in radiative corrections that relate electroweak parameters, and when combined with other precision electroweak data can be used to probe for new physics. In particular, the relationship between and displays a well-known dependence on the mass of the Higgs. A precise measurement of the top mass is therefore a high priority of both experiments.
The primary method for measuring the top mass at the Tevatron is a constrained fit to lepton + 4-jet events arising from the process . In these events, the observed particles and can be mapped one-to-one to partons from the decay. However, there are 12 possible jet–parton assignments. The number of jet combinations is reduced to six if one -tag is present, and to two if two ’s are tagged. To select the best combination, both experiments use a likelihood method that exploits the many constraints in the system. Each event is fitted individually to the hypothesis that three of the jets come from one or through its decay to , and that the lepton, , and the remaining jet come from the other or decay. The fit is performed for each jet combination, with the requirement that any tagged jets must be assigned as quarks in the fit. Each combination has a two-fold ambiguity in the longitudinal momentum of the neutrino. CDF chooses the solution with the best , while D0 takes a weighted average of the three best solutions. In both cases, solutions are required to satisfy a cut. The result is a distribution of the best-fit top mass for each of the candidate events. The final value for the top mass is extracted by fitting this distribution to a set of Monte Carlo templates for and background. A likelihood fit is again used to determine which set of templates best fits the data. Because this measurement involves precision jet spectroscopy, both experiments have developed sophisticated jet energy corrections, described below, that relate measured jet energies to parton four-vectors. Uncertainties associated with these corrections are the largest source of systematic error.
Measurements of the top mass in other channels (dilepton, all-hadronic…have larger uncertainties, and give results consistent with the lepton + jets measurements. These channels will not be discussed here. I now describe the CDF and D0 measurements in more detail.
3.1 D0 Measurement of
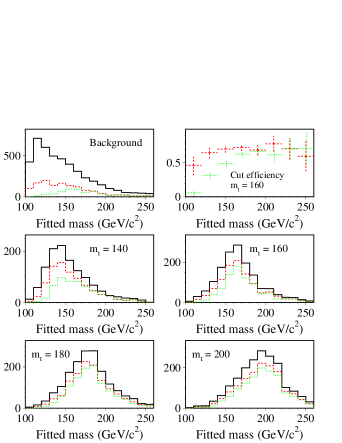
The D0 top mass measurement begins with event selection cuts similar to those used in the lepton + jets cross section analysis, with two important differences. First, all events are required to have at least four jets with GeV and . (Recall that in the cross section analysis, soft-muon tagged events were allowed with only three jets.) Second and more importantly, the cut on the total hadronic (), which proved extremely useful for selecting a high-purity sample in the cross section analysis, is replaced by a new “top likelihood” cut that combines several kinematic variables. A straightforward cut would inject significant bias into the analysis by pushing both background and signal distributions toward higher values of and making background look like signal. The top likelihood variable combines the , the aplanarity of the + jets, the fraction of the of the + jets system that is carried by the , and the -weighted rms of the and jets. The distributions for each of these variables are determined from Monte Carlo events, and the probabilities are combined such that the bias of the fitted mass distributions is minimized. The top likelihood distributions for signal and background Monte Carlo events are shown in Fig. 5. The advantages of this variable are demonstrated in Fig. 6, which compares fitted mass distributions for signal and background Monte Carlo events after the likelihood cut and after the cross section () cuts. The top likelihood cut gives a significantly smaller shift in the fitted distributions. This is particularly true in the case of background events, where the cross section cuts “sculpt” the background distribution into a shape that looks rather top-like. The reduction of this source of bias is particularly important since the D0 top mass sample is nearly 60% background. A total of 34 events pass the selection cuts, of which 30 have a good fit to the hypothesis.

For reconstructing the top mass, one desires to know the four-momenta of the underlying partons as accurately as possible. In practice one observes jets, usually reconstructed with a fixed-cone algorithm, and several effects can complicate the connection between these jets and their parent partons. Calorimeter nonlinearies, added energy from multiple interactions and the underlying event, uranium noise in the calorimeter, and energy that falls outside of the jet clustering cone all must be accounted for. The D0 jet corrections are derived from an examination of events in which a jet recoils against a highly electromagnetic object (a “”). The energy of the “” is well-measured in the electromagnetic calorimeter, whose energy scale is determined from events. It is then assumed that the component of the along the jet axis () is due entirely to mismeasurement of the jet energy, and a correction factor for the recoil jet energy is obtained by requiring to vanish. The correction factors are derived as a function of jet and .
These jet corrections are “generic” and are used in many D0 analyses, including the cross section analysis. Additional corrections are applied for the top mass analysis. These corrections account for the fact that light quark jets (from hadronic decays) and quark jets have different fragmentation properties. Furthermore, jets tagged with the soft muon tag must have the energy of the minimum-ionizing muon added back in, and a correction must be applied for the neutrino. These flavor-dependent corrections are determined from Monte Carlo events. The flavor assignment of the jets is established by the constrained fit.
Backgrounds in the 30-event final sample come from the QCD production of + multijets, and from fakes. These backgrounds are calculated for each channel before the top likelihood cut. The effects of the top likelihood cut and the fitter cut are determined from Monte Carlo. The result is an estimated background of 17.42.2 events. The background is constrained to this value (within its Gaussian uncertainties) in the overall fit to plus background templates that determines the most likely top mass.
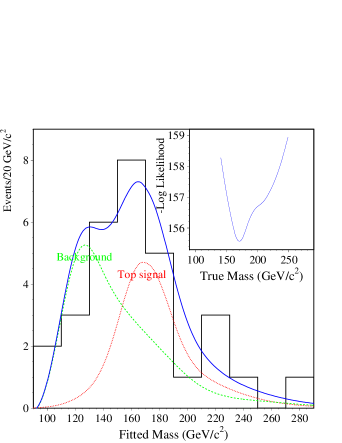
Figure 7 shows the reconstructed mass distribution for the 30 events, together with the results of the fit. The result is (stat) GeV. The statistical error is determined by performing a large number of Monte Carlo “pseudo-experiments” with events and . The standard deviation of the mean in this ensemble of pseudo-experiments is taken to be the statistical error.
Systematic uncertainties come from the determination of the jet energy scale from events (7 GeV), variations among Monte Carlo generators (Isajet vs. the default Herwig) and jet definitions (6 GeV), uncertainties in the background shape ( 3 GeV), variations in the likelihood fitting method ( 3 GeV), and Monte Carlo statistics ( 1 GeV). The final result is therefore
| (3) |
3.2 CDF Measurement of
At the winter ‘96 conferences and at Snowmass, CDF reported a top mass value of GeV. This value was obtained using a technique very similar to that reported in Refs. [1] and [3], with the main improvements being a larger dataset (110 pb-1) and a better determination of the systematic uncertainties. This measurement used a sample of events with a lepton, , at least three jets with GeV and , and a fourth jet with GeV and . Events were further required to contain an SVX- or SLT-tagged jet. Thirty-four such events had an acceptable when fit to the hypothesis, with a calculated background of events.
This technique, while powerful, does not take account of all the available information. It does not exploit the difference in signal to background between SVX tags and SLT tags, nor does it use any information from untagged events that satisfy the kinematic requirements for top. CDF has recently completed an optimized mass analysis that takes full advantage of this information.
To determine the optimal technique for measuring the mass, Monte Carlo samples of signal and background events are generated and the selection cuts for the mass analysis are applied. This sample is then divided into several nonoverlapping subsamples, in order of decreasing signal to background: SVX double tags, SVX single tags, SLT tags (no SVX tag), and untagged events. The mass resolution for each subsample is obtained by performing many Monte Carlo “pseudo-experiments.” Each pseudo-experiment for a given subsample contains the number of events observed in the data, with the number of background events thrown according its predicted mean value and uncertainty. For example, 15 SVX single-tagged events are observed in the data, so the pseudo-experiments for the “single SVX-tag” channel each contain 15 events, with the number of background events determined by Poisson-fluctuating the estimated background in this channel of events. The standard likelihood fit to top plus background templates is then performed for each pseudo-experiment. The mass resolutions are slightly different for each subsample because single-, double-, and untagged events have different combinatorics, tagger biases, etc. Top mass templates are therefore generated for each subsample. By performing many pseudo-experiments, CDF obtains the expected statistical error for each subsample.
Because the subsamples are nonoverlapping by construction, the likelihood functions for each subsample can be multiplied together to yield a combined likelihood. Monte Carlo studies have been performed to determine which combination of subsamples produces the smallest statistical error. One might expect that the samples with SVX tags alone would yield the best measurement, because of their high signal to background. However it turns out that the number of events lost by imposing this tight tagging requirement more than compensates for the lower background, and actually gives a slightly larger statistical uncertainty than the previous CDF technique of using SVX or SLT tags. Instead, the optimization studies show that the best measurement is obtained by combining double SVX tags, single SVX tags, SLT tags, and untagged events. For the untagged events, these Monte Carlo studies show that a smaller statistical error results from requiring the fourth jet to satisfy the same cuts as the first three jets, namely GeV and . For the various tagged samples, the fourth jet can satisfy the looser requirements GeV, . The median statistical error expected from combining these four samples is 5.4 GeV, compared to 6.4 GeV expected from the previously-used method. This reduction in statistical uncertainty is equivalent to increasing the size of the current SVX or SLT tagged data sample by approximately 40%.
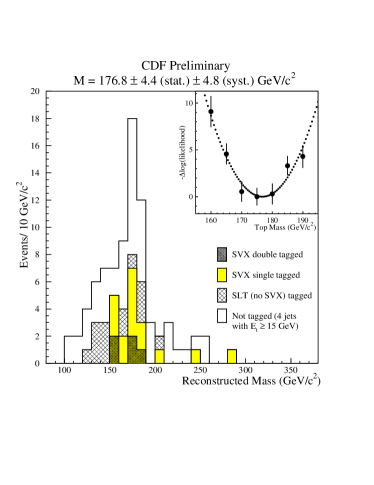
The optimized procedure is then applied to the lepton plus jets data. Table 4 shows the number of observed events in each subsample, together with the expected number of signal and background events, the fitted mass, and the statistical uncertainties. The result is (stat) GeV. The statistical uncertainty is somewhat better than the 5.4 GeV expected from the pseudo-experiments. Approximately 8% of the pseudo-experiments have a statistical uncertainty of 4.4 GeV or less, so the data are within expectations. Figure 8 shows the reconstructed mass distribution for the various subsamples, together with the results of the fit.
| Subsample | Fit Mass | ||
|---|---|---|---|
| (GeV) | |||
| SVX or SLT tag | 34 | ||
| (Prev. Method) | |||
| SVX double tag | 5 | ||
| SVX single tag | 15 | ||
| SLT tag (no SVX) | 14 | ||
| Untagged () | 48 | ||
| Optimized Method |
Systematic uncertainties in the CDF measurement are summarized in Table 5. The largest systematic is the combined uncertainty in the jet scale and the effects of soft gluons (i.e. fragmentation effects). Such effects include calorimeter nonlinearities and cracks, the effect of the underlying event, and Monte Carlo modeling of the jet energy flow outside the clustering cone. The “hard gluon” systematic comes from the uncertainty in the fraction of events where one of the four highest- jets is a gluon jet from initial- or final-state radiation. The Herwig Monte Carlo program predicts that 55% of the time a gluon jet is among the four leading jets. This systematic is evaluated by varying the fraction of such events by in the Monte Carlo and determining the resulting mass shift. Systematics from the kinematic and likelihood fit are determined by using slightly different but equally reasonable methods of performing the constrained fit and the final likelihood fit for the top mass. Such variations include allowing the background to float, or varying the range over which the parabolic fit that determines the minimum and width of the likelihood function is performed. The “different MC generators” systematic is assigned by generating the templates with Isajet instead of the default Herwig. Systematics in the background shape are evaluated by varying the scale in the Vecbos Monte Carlo program that models the + jets background. Studies have shown that the relatively small non- background is kinematically similar to + jets. The systematic from -tagging bias includes uncertainties in the jet -dependence of the -tag efficiency and fake rate, and in the rate of tagging non- jets in top events. Monte Carlo statistics account for the remainder of the systematic uncertainties. The final result is:
| (4) |
| Systematic | Uncertainty (GeV) |
|---|---|
| Soft gluon + Jet scale | 3.6 |
| Hard gluon effects | 2.2 |
| Kinematic & likelihood fit | 1.5 |
| Different MC generators | 1.4 |
| Monte Carlo statistics | 0.8 |
| Background shape | 0.7 |
| -tagging bias | 0.4 |
| Total | 4.8 |
4 Kinematic Properties
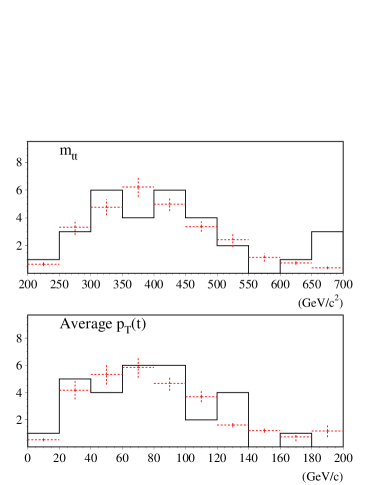
The constrained fits described above return the complete four-vectors for all the partons in the event, and allow a range of other kinematic variables to be studied. As examples, Fig. 9 shows the of the system as reconstructed from CDF data, and Fig. 10 shows the invariant mass and the average and from D0. The distributions have not been corrected for event selection biases or combinatoric misassignments. In these and in similar plots, the agreement with the Standard Model is good.

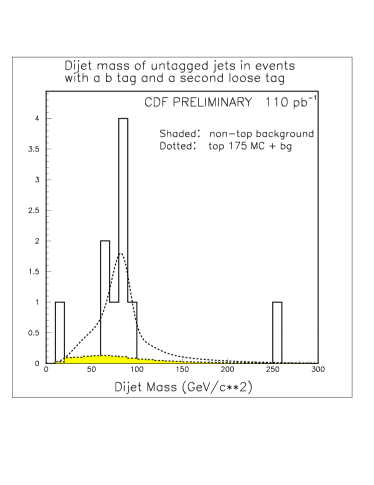
A very important cross-check that the experiments are really observing pair production is to search for the hadronically decaying in lepton + jets events. CDF has performed such an analysis by selecting lepton + 4-jet events with two -tags. To maximize the -tag efficiency, the second in the event is allowed to satisfy a looser tag requirement. The two untagged jets should then correspond to the hadronic decay. Fig. 11 shows the dijet invariant mass for the two untagged jets. The clear peak at the mass, together with the lepton, the , and the two tagged jets, provides additional compelling evidence that we are observing decay to two ’s and two ’s. This measurement is also interesting because it suggests that in future high-statistics experiments the jet energy scale can be determined directly from the data by reconstructing this resonance.
5 Branching ratios,
In the Standard Model, the top quark decays essentially 100% of the time to . Therefore the ratio of branching ratios
| (5) |
where is any quark, is predicted to be one. CDF has measured using two techniques. The first technique compares the ratio of double- to single-tagged lepton + jets events that pass the mass analysis cuts, and double-, single- and un-tagged dilepton events. Since the efficiency to tag a single -jet is well known from control samples, the observed tag ratios can be converted into a measurement of . CDF finds:
| (6) |
or
| (7) |
Untagged lepton + jets events are not used in this analysis because of the large backgrounds admitted by the standard cuts. (Of course, the cuts were designed to be loose to avoid kinematic bias; the background rejection is normally provided by -tagging.) The second CDF technique uses the “event structure” cuts of Ref. [4] to increase the purity of the untagged lepton + jets sample, allowing it to be included in this measurement. The result is:
| (8) |
or
| (9) |
It should be noted that these analyses make the implicit assumption that the branching ratio to non- final states is negligible. The fact that the cross sections measured in the dilepton, lepton + jets, and all-hadronic channels are in good agreement is evidence that this assumption is correct. Alternatively, if one believes the theoretical cross section, it is clear from the SVX and SLT -tag measurements that this cross section is saturated by decays to . However, these “indications” have not yet been turned into firm limits on non- decays.
The measurement of above can be interpreted as a measurement of the CKM matrix element . However, it is not necessarily the case that implies . This inference follows only in the absence of a fourth generation, where the value of is constrained by unitarity and the known values of the other CKM matrix elements. In this case, is determined much more accurately from these constraints than from the direct measurement. (In fact, under the assumption of 3-generation unitarity, is actually the best known CKM matrix element.) A more general relationship, which is true for three or more generations provided that there is no fourth generation quark lighter than top, is
| (10) |
Since depends on three CKM matrix elements and not just one, a single measurement cannot determine , and we must make additional assumptions about and . In general, a fourth generation would allow and to take on any value up to their values assuming 3-generation unitarity. One simplifying assumption is that the upper 3 portion of the CKM martix is unitary. In that case, , and gives directly. However, as noted above, under this assumption is very well determined anyway and this direct measurement adds no improved information. Assuming 3 unitarity, the two analyses described above give and respectively. A more interesting assumption is that 3 unitarity is relaxed only for . Then we can insert the PDG values of and and obtain:
| (11) |
for the first method, or
| (12) |
for the second.
To see that a small value of would not violate anything we know about top, consider the situation with decays. The quark decays of the time to , even though . This is because the channel with a large CKM coupling, , is kinematically inaccessible. The same situation could occur for top in the presence of a heavy fourth generation. However in this case the top width would be narrower than the Standard Model expectation. A more definitive measurement[11] of will be performed in future Tevatron runs by measuring directly through the single top production channel .
6 Rare Decays
CDF has performed searches for the flavor-changing neutral current decays and . The decay to can have a branching ratio as high as in some theoretical models[12]. The search for this decay includes the possibility that one or both top quarks in an event can decay to . In either case the signature is one candidate and four jets. Backgrounds in the channel come from and plus jets production, and are estimated to be events. In addition, 0.5 events are expected from Standard Model decay. One event is observed. Under the conservative assumption that this event is signal, the resulting limit is:
| (13) |
The branching ratio of is predicted to be roughly [13], so any observation of this decay would probably indicate new physics. CDF searches for final states in which one top decays to and the other decays to . The signature is then or more jets (if ), or or more jets (if ). In the hadronic channel, the background is 0.5 events, and no events are seen. In the leptonic channel, the background is 0.06 events, and one event is seen. (It is a curious event, containing a 72 GeV muon, an 88 GeV candidate, 24 GeV of , and three jets.) Conservatively assuming this event to be signal for purposes of establishing a limit, CDF finds:
| (14) |
This limit is stronger than the limit because of the branching fraction to of about 6.7%, compared to the reconstruction efficiency of about 80%.
7 W Polarization
The large mass of the top quark implies that the top quark decays before hadronization, so its decay products preserve the helicity structure of the underlying Lagrangian. Top decays, therefore, are a unique laboratory for studying the weak interactions of a bare quark. In particular, the Standard Model predicts that top can only decay into left-handed or longitudinal bosons, and the ratio is fixed by the relationship
| (15) |
For GeV, the Standard Model predicts that about 70% of top quarks decay into longitudinal bosons. This is an exact prediction resulting from Lorentz invariance and the character of the electroweak Lagrangian. If new physics modifies the -- vertex—i.e. through the introduction of a right-handed scale—it may reveal itself in departures of the polarization from the Standard Model prediction. The polarization has recently been measured, albeit with low statistics, by CDF. I describe this measurement here to illustrate the type of measurement that will be done with high precision in future runs with the Main Injector.
The polarization is determined from the , the angle between the charged lepton and the in the rest frame of the . This quantity can be expressed in the lab frame using the approximate relationship[14]
| (16) |
where is the invariant mass of the charged lepton and the jet from the same top decay, and is the three-body invariant mass of the charged lepton, the neutrino, and the corresponding jet. This last quantity is nominally equal to , though in the analysis the measured jet and lepton energies are used, and the possibility of combinatoric misassignment is included.
Monte Carlo templates for are generated using the Herwig event generator followed by a simulation of the CDF detector. The simulated events are then passed through the same constrained fitting procedure used in the top mass analysis. The fit is used here to determine the most likely jet–parton assignment (i.e. which of the two jets to assign to the leptonic decay), and to adjust the measured jet and lepton energies within their uncertainties in order to obtain the best resolution on . The same procedure is applied to +jets events generated by the Vecbos Monte Carlo program to obtain the distribution of the background.
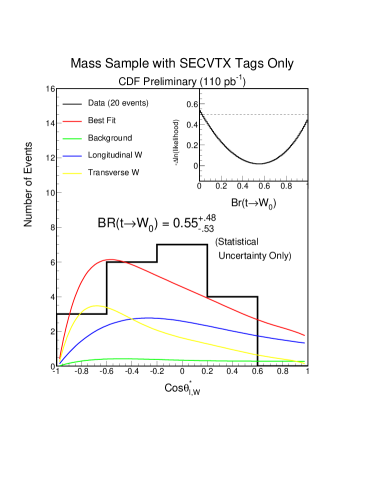
The distribution from the data is then fit to a superposition of Monte Carlo templates to determine the fraction of longitudinal decays. The dataset is the same as in the CDF top mass analysis (lepton + + three or more jets with GeV and , and a fourth jet with GeV and ). To increase the purity, only events with SVX tags are used. The distribution in this sample is shown in Fig. 12 together with the results of the fit. The fit returns a longitudinal fraction of (statistical uncertainties only). The statistics are clearly too poor at present to permit any conclusions about the structure of the -- vertex. However, with the large increase in statistics that the Main Injector and various planned detector improvements will provide, precision measurements of this vertex will become possible. Studies indicate, for example, that with a 10 fb-1 sample one can measure BR() with a statistical uncertainty of about 2%, and have sensitivity to decays to right-handed ’s with a statistical precision of about 1%[15].
8 Conclusions
The Tevatron experiments have progressed quickly from the top search to a comprehensive program of top physics. Highlights of the recently completed run include measurements of the top cross section and mass, studies of kinematic features of top production, and a first look at the properties of top decays. Many of these analyses are still in progress, and improved results can be expected.
With a mass of approximately 175 GeV, the top quark is a unique object, the only known fermion with a mass at the natural electroweak scale. It would be surprising if the top quark did not play a role in understanding electroweak symmetry breaking. Current measurements are all consistent with the Standard Model but in many cases are limited by poor statistics: the world sample numbers only about a hundred events at present. Both CDF and D0 are undertaking major detector upgrades designed to take full advantage of high-luminosity running with the Main Injector starting in 1999. This should increase the top sample by a factor of 50. Beyond that, Fermilab is considering plans to increase the luminosity still further, the LHC is on the horizon, and an linear collider could perform precision studies at the threshold. The first decade of top physics has begun, and the future looks bright.
9 Acknowledgements
I would like to thank the members of the CDF and D0 collaborations whose efforts produced the results described here, and the members of the technical and support staff for making this work possible. I would also like to thank the organizers of Snowmass ‘96 for inviting me to present these results and for sponsoring a stimulating and enjoyable workshop. This work is supported in part by NSF grant PHY-9515527 and by a DOE Outstanding Junior Investigator award.
References
- [1] F. Abe et al. (CDF Collaboration), Phys. Rev. Lett.74, 2626 (1995).
- [2] S. Abachi et al. (D0 Collaboration), Phys. Rev. Lett.74, 2632 (1995).
- [3] F. Abe et al. (CDF Collaboration), Phys. Rev. D50, 2966 (1994); Phys. Rev. Lett.73, 225 (1994).
- [4] F. Abe et al. (CDF Collaboration), Phys. Rev. D51, 949 (1995).
- [5] E. L. Berger and H. Contopaganos, ANL-HEP-PR-95-82 (1996).
- [6] S. Catani, M. L. Mangano, P. Nason, and L. Trentadue, Phys. Lett. B378, 329 (1996).
- [7] E. Laenen, J. Smith, and W. L. Van Neerven, Nucl. Phys. B369, 543 (1992); E. Laenen, J. Smith, and W. L. Van Neerven, Phys. Lett. B321, 254 (1994).
- [8] F. Abe et al. (CDF Collaboration), Phys. Rev. Lett.75, 3997 (1995).
- [9] D. Amidei et al., Nucl. Instrum. Methods A350, 73 (1994).
- [10] S. Chihagir et al., Nucl. Instrum. Methods A360, 137 (1995).
- [11] T. Stelzer and S. Willenbrock, Phys. Lett. B357, 125 (1995).
- [12] H. Fritzsch, Phys. Lett. B224 423 (1989).
- [13] S. Parke, in Proceedings of DPF ‘94, University of New Mexico, Albuquerque, NM (August, 1994).
- [14] G. L. Kane, C. P. Yuan, and G. Ladinsky, Phys. Rev. D45, 124 (1992).
- [15] “Future Electroweak Physics at the Fermilab Tevatron: Report of the TEV_2000 Study Group,” D. Amidei and R. Brock, eds. Fermilab-Pub-96/082 (1996).