CDF/DOC/TOP/PUBLIC/3801
TOP QUARK STUDIES AT HADRON COLLIDERS∗*∗*
Lectures presented at the 1995 SLAC Summer Institute
Abstract
The techniques used to study top quarks at hadron colliders are presented. The analyses that discovered the top quark are described, with emphasis on the techniques used to tag quark jets in candidate events. The most recent measurements of top quark properties by the CDF and D0/ collaborations are reviewed, including the top quark cross section, mass, branching fractions and production properties.
Future top quark studies at hadron colliders are discussed, and predictions for event yields and uncertainties in the measurements of top quark properties are presented.
1 Introduction
1.1 The Case for Top
The top quark and the Higgs boson are the heaviest elementary particles predicted by the standard model. [1] The four lightest quark flavours, the up, down, strange and charm quarks, were well-established by the mid-1970’s. The discovery in 1977 [2] of the resonances, a new family of massive hadrons, required the introduction of the fifth quark flavour. Experimental and theoretical studies have indicated that this quark has a heavier partner, the top quark.
Indirect evidence for the top quark comes from a number of sources. The most compelling data come from the observed properties of the scattering process , where the asymmetry in the scattering of the quark relative to the incoming electron direction implies that the quark has weak isospin of 0.5. The most precise measurement of this comes from the LEP collider, where this asymmetry has been found[3] to be in excellent agreement with the standard model expectation of 0.100 assuming that the quark is a member of an doublet. The other member of that doublet would by definition be the top quark.
Additional indirect evidence comes from the study of quark decays. It has been experimentally determined that the quark does not decay via processes that yield zero net flavour in the final state (e.g., ), or where the decay results in only a quark of the same charge (e.g., where is a state with no net flavour quantum numbers) [4]. The absence of these “flavour-changing neutral currents” in the standard model implies that the quark is a member of an doublet.
Finally, evidence for the existence of a massive fermion that couples via the electroweak force to the quark comes from detailed measurements of the and bosons performed at LEP, SLC, the CERN SS and the Fermilab Tevatron Collider. This body of data, and in particular the radiative mass shifts of the electroweak bosons, can only be described in the standard model by introducing a top quark. A recent compilation of data [5] indicates that the standard model top quark has a mass of
| (1) |
The second uncertainty corresponds to variations of the unknown Higgs boson mass between 60 and 1000 (its nominal value is 300 ).
Taken together, these observations make a strong case for the top quark’s existence. They also imply that our understanding of nature via the standard model would be profoundly shaken if the top quark was shown not to exist with its expected properties. The observation of the top quark is therefore of considerable significance.
1.2 Earlier Top Quark Searches
Direct searches for the top quark have been performed at virtually all of the high-energy collider facilities that have operated in the last twenty years[6]. The most model-independent searches have taken place at colliders, where one looks for the production and decay of a pair of massive fermions. Because of the relatively large mass of the top quark, its decay yields events that are quite spherical and are relatively easy to separate from the background of lighter quark production. The most stringent limits have been set by the LEP collaborations, which require that at 95% confidence level (CL). These limits are insensitive to the decay modes of the top quark and the coupling of the top quark to the electroweak bosons.
Another relatively model-independent limit is set by measurements of the width of the boson. Direct and indirect measurements [7] of indicate that the top quark is massive enough that the decay channel does not contribute to . The limit set is at 95% CL.
Direct searches for the top quark at hadron colliders have focused on two specific models for top quark decay: i) the minimal supersymmetric model (MSSM)[8] where the decay mode is also allowed ( is the charged Higgs boson), and ii) the standard model where the top quark decays directly to . The most stringent limit[9] assuming the MSSM requires that at 95% CL for the case where always and . This limit, however, depends on the overall width of the decay , the Higgs boson branching fractions ( is expected to preferentially decay to and final states) and the detection efficiency. The D0/ collaboration has published the most sensitive standard model search using a 15 dataset, and has excluded a top quark with mass less than 131 at 95% CL [10].
On the other hand, the CDF collaboration published a study of of data in April 1994 that claimed evidence for top quark production [11]. A total of 12 events were observed in several decay modes above a predicted background of approximately 6 events. The probability that the observed event rate was consistent with a background fluctuation was estimated to be 0.25%. In addition, evidence was presented that the events in the sample were consistent with arising from the production and decay of a system and inconsistent with the properties expected of the dominant backgrounds. Although compelling, this observation was statistically limited and the possibility that it arose from a background fluctuation could not be ruled out.
In this report, I will focus on the latest results to come from the D0/ and CDF top quark searches using data collected between 1992 and 1995. Both collaborations have acquired over three times more data, and have now reported conclusive evidence for top quark production [12]. I will describe the analyses performed by both collaborations and compare the two results.
I believe an extremely persuasive case has been made that the top quark has been found.
2 Production and Decay of Heavy Top
The production of heavy quarks in 1.8 TeV proton-antiproton () collisions is predicted to take place through the two leading-order quantum-chromodynamic (QCD) diagrams
| (2) | |||||
| (3) |
with the relative rate of these two processes dictated largely by the mass of the heavy quark (), the parton distribution functions of the proton and phase space. Top quark pair-production is expected to dominate the production rate. The production of single top quarks through the creation of a virtual is smaller[13] (of order 10% of the rate) and expected to occur in a relatively small part of phase space. All heavy top quark searches have therefore ignored single top production.
The next-to-leading order corrections [14] to processes (2) and (3) are relatively small for heavy quark masses greater than . More recently, these estimates have been revised taking into account the effects of internal soft-gluon emission [15, 16]. These cross sections are shown in Fig. 1 plotted as a function of the heavy quark mass. The uncertainty in these estimates reflects the theoretical uncertainty in this calculation, which is believed to be the choice of renormalisation scale. For top quark masses above 100 , the primary contribution to the cross section comes from quark annihilation. This reduces the uncertainties arising from our lack of knowledge of the parton distribution functions of the proton, as these have been relatively accurately measured at large Feynman , the kinematic region that would dominate very heavy quark production.

Top quark pair production will generate a top quark and anti-top quark that are recoiling against each other in the lab. The production diagrams favour configurations where the top quarks are produced isotropically in the lab frame. The relative motion of the system is expected to be small in comparison to the transverse momentum†††††† I will employ a coordinate system where the proton beam direction defines the axis, and transverse variables such as transverse momentum () and transverse energy () are defined relative to this axis. The angle represents the azimuthal angle about the beam axis and the angle represents the polar angle relative to the beam axis. Pseudorapidity will often be employed instead of . () distribution of the top quark itself [17]. The expected distribution for a heavy top quark has a peak around half the top quark mass with a relatively long tail. The pseudorapidity distribution for top quarks is peaked at 0 and falls off rapidly so that most of the top quarks are produced in the “central” region with pseudorapidity . The combination of a relatively energetic heavy quark produced centrally is ideal from an experimental point of view. The top quark decay products are rather stiff and central, aiding their detection.
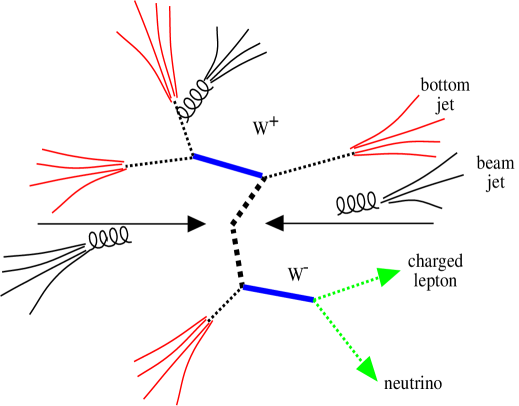
The standard model predicts that the top quark will decay almost always via . The decays approximately 2/3 of the time into pairs ( or ) and 1/3 of the time into one of the three lepton generations. This results in a decay topology consisting of 6 energetic partons that could either be charged leptons, neutral leptons or quark jets.
The decay channels involving leptons are problematic given the difficulty of cleanly identifying these weakly decaying leptons in a hadron collider environment. They have therefore not been explicitly included in the searches I describe below. The final states involving 6 quark jets suffer an enormous background from QCD multijet production, with estimates of intrinsic signal-to-noise of . Because of these large backgrounds, this channel has not been the focus of most of the effort, and I will ignore it here also. However, recent work has demonstrated that a significant signal can be observed in these modes.[18]
With these considerations, there are five final states that are experimentally accessible:
| (4) | |||||
where I have also listed the expected standard model branching fractions for each channel. In all cases where I refer to a specific charge state, the charge conjugate mode is implied. The first three dilepton channels turn out to be the cleanest final states, as the requirement of two energetic charged leptons and neutrinos virtually eliminates all backgrounds. They suffer from rather small branching fractions and are therefore the most statistically limited. The last two lepton+jets final states together correspond to approximately 30% of the branching fraction. However, these channels face the largest potential backgrounds.
3 Backgrounds to Top Quark Searches
Top quark production is an extremely rare process in collisions; its cross section of less than 100 pb can be compared with the total cross section of over 50 mb (almost nine orders of magnitude difference). Since the total cross section is dominated by “soft” QCD interactions, the top quark cross section can be more fairly compared with the cross section for other high production processes, such as inclusive production (20 nb), production (2 nb) and and production (10 and 5 pb, respectively). These processes are the sources of the most severe background to production.
It is necessary to control these backgrounds so that one can be sensitive to a top quark signal. All the channels listed in Eqs. (4) involve an energetic charged electron or muon, and one or more energetic neutrinos. The requirement of these two signatures in the final state using the D0/ and CDF lepton identification systems are sufficient to adequately control the backgrounds associated with jets that might satisfy the lepton ID criteria. The remaining backgrounds are dominated by physics processes that generate real leptons in the final state.
In the case of the dielectron and dimuon modes, the single largest background comes from Drell-Yan production (including and ). This is controlled by requiring a neutrino signature as well as additional jet activity. The single largest physics background in the final state comes from decay, which can be similarily reduced by the requirement of a neutrino signature and additional jets.
The single largest physics background to lepton+jets final states come from inclusive production where additional jets are produced via initial and final state radiation [19]. The intrinsic rate for this background depends strongly on the multiplicity requirements placed on the jet candidates, as shown in Table 1 where the observed +jet production cross section is presented as a function of jet multiplicity and compared with a QCD Monte Carlo prediction [20].
| Jet Multiplicity | (pb) | (pb) |
|---|---|---|
| 0 | ||
| 1 | ||
| 2 | ||
| 3 | ||
| 4 |
One can see from these rates that this background can overwhelm a signal. More stringent kinematic cuts can be applied to reject the +jet events, taking advantage of the fact that the final states, on average, generate higher bosons and additional jets. Alternatively, since the final state has two quark jets in it, the requirement that one or more jets are consistent with arising from the fragmentation and decay of a quark will preferentially reduce the +jets background. Both of these techniques have been employed.
4 The Tevatron Collider
The Tevatron Collider is a 6 km circumference proton-antiproton storage ring that creates collisions at a centre-of-mass energy of 1.8 TeV. In its current configuration, the collider operates with six bunches of protons and six bunches of counter-rotating antiprotons that are brought into collision at two intersection points in the ring named B0 and D0. The B0 and D0 interaction regions house the CDF and D0/ detectors, respectively.
The Tevatron embarked on a multi-year collider run starting in December 1992. The first stage of the run, known as Run IA, continued till August 1993, at which time approximately 30 had been delivered to each interaction region. The second stage, Run IB, commenced in August 1994 and by February 1995 the collider had delivered an additional 80 to each interaction region. The maximum luminosity of the Collider during this period was , and has been steadily rising.
Run IB run ended in February 1996, with a total of delivered to each interaction region.
5 The D0/ and CDF Experiments
The D0/ and CDF detectors have been designed to trigger and record the high collisions that result when two partons in the system undergo a hard scatter. Both instruments detect electrons, muons, neutrinos and quark and gluon jets using a set of complementary subdetectors. However, they accomplish this common goal in rather different ways.
5.1 The D0/ Detector
The D0/ detector was designed with the philosophy that a uniform, hermetic, highly-segmented calorimeter should form the core of the detector [21]. A cut-away view of the detector is shown in Fig. 2. The D0/ calorimeter employs a uranium absorber up to nine interaction lengths thick and a liquid argon readout system. This provides excellent hermeticity and uniformity, except perhaps in the transition region between the barrel and endcap cryostats. The overall resolution of the D0/ calorimeter is
| (5) | |||||
| (6) |
where is measured in GeV.
A muon system consisting of charged particle detectors and 1.9 Tesla toroidal magnets located outside the calorimeter provides good muon identification. This system identifies muon candidates in the region using sets of muon tracking chambers consisting of proportional drift tubes located interior and exterior to the large toroidal magnetic field. The deflection of the muon candidates in the magnetic field provides a momentum measurement with an accuracy of
| (7) |
where is the muon momentum measured in .
Vertex, central and forward drift chambers provide charged particle detection in the interval . The tracking system does not incorporate a magnetic field, as the presence of a magnetic coil would degrade calorimeter performance.
5.2 The CDF Detector
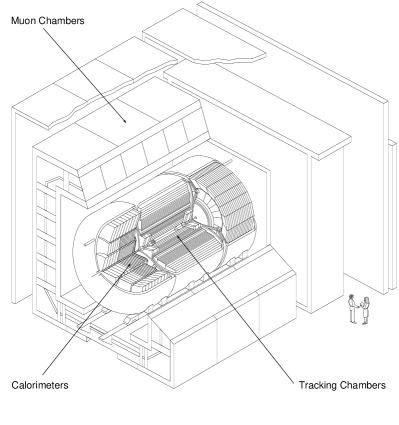
The CDF detector [22] consists of a high-precision tracking system in a 1.4 T solenoid magnetic field, surrounded by a hermetic highly-segmented calorimeter, as shown in Fig. 3. The tracking system consists of three independent devices arranged coaxial to the beam line. A 4-layer silicon-strip detector (SVX) with inner and outer radii of 3.0 and 7.9 cm provides of order 40 precision on the impact parameter of individual charged track trajectories extrapolated to the beam line. A set of time projection chambers (VTX) instrument the tracking region between 12 and 22 cm in radius, providing high-precision tracking in the - plane. An 84-layer drift chamber (CTC) detects charged particles in the region between 30 and 132 cm from the beamline. Together, these detectors measure particle transverse momentum to a precision given by
| (8) |
for particles with .
The central calorimeter (CEM and CHA) instruments the region , and is comprised of projective towers of size radians. Each tower is made of a sandwich of Pb or Fe plates interleaved with scintillator. A Pb sandwich 25 radiation lengths thick is used to measure electromagnetic shower energies. An iron-scintillator sandwich approximately 5 interaction lengths thick is used to detect hadronic showers. Plug and Forward calorimeters (PEM, PHA, FEM and FHA) instrument the region , and consist of similar absorber material. The showers in this region are detected with proportional wire chambers as they provide for a more radiation-resistant detector system. The presence of a solenoid magnet and a significant amount of material in front of the calorimeter leads to some compromise in calorimeter performance. The overall resolution of the CDF calorimeter is
| (9) | |||||
| (10) |
Planar drift chambers (CMU, CMP and CMX) located outside the calorimeter volume detect muons penetrating the calorimeter absorber, but precise muon momentum and direction come from the associated charged track detected in the inner tracking system. The central muon system is able to detect muons within the pseudorapidity interval . A forward muon system (FMU) consisting of large toriodal magnets surrounded by drift chambers and scintillator counters detect muons in the rapidity region .

5.3 Triggering and Data Acquisition
Pair production of standard model top quarks and their subsequent decay into either the dilepton or lepton+jets mode yields a signature that is relatively straightforward to trigger on. Both detectors employ multi-level trigger systems where at each level more information is brought together to form a decision. The trigger requirement of at least one energetic electron or muon is the primary tool used in identifying online a sample of top quark candidate events that are subsequently studied offline.
The requirement of at least one high electron or muon in both CDF and D0/ is imposed efficiently in the trigger. The production of leptons above a transverse energy of 15 GeV is dominated in both experiments by and quark production, and by inclusive boson production. For example, in CDF, the inclusive electron trigger is implemented with the following requirements:
-
1.
The level 1 trigger demands that at least one calorimeter trigger cell with has GeV of electromagnetic energy.
-
2.
The level 2 trigger demands that there be a charged track candidate pointing at an electromagnetic energy cluster, and requires that the cluster properties be consistent with those of an electromagnetic shower.
-
3.
The level 3 trigger requires the presence of an electromagnetic cluster associated with a charged track reconstructed using the standard offline algorithms. Further quality cuts on the properties of the electromagnetic shower are also made.
These reduce the overall cross section of candidate events to approximately 50 nb, of which approximately 30% is comprised of real electrons. For comparison, the rate of in this sample is of order 1 nb. The efficiency of this trigger for isolated electrons with GeV is %.
As another example, the D0/ detector triggers on a sample of inclusive muon candidates by using a two level decision process:
-
1.
The level 1 trigger demands the presence of a charged track stub in the muon toroidal spectrometer with a .
-
2.
The level 2 trigger demands a high quality muon candidate consisting of a muon candidate in the muon system matched to a charged track observed in the central tracking system. The central track candidate must be reconstructed in all 3 dimensions, must be consistent with coming from the event interaction and must have greater than 5 or 8 , depending on the specific muon trigger.
The efficiency of this trigger is estimated to be %.
Both experiments employ inclusive electron and muon triggers, as well as triggers that identify smaller samples of events useful to the top search. Since the backgrounds to the dilepton sample are relatively small, it is convenient to identify the candidate events immediately in the trigger so that they can be analysed as soon as possible. A high- dilepton trigger requiring at least two electron or muon candidates is therefore employed to flag these candidates immediately. The cross section for this trigger is only a few nb.
At a luminosity of , a trigger cross section of 300 nb corresponds to an event rate of 6 Hz, which can be comfortably recorded and analyzed. Note, however, that even with a cross section of 10 nb, the total data sample for an integrated luminosity of 50 will consist of 500 000 events, with each event comprised of order 200 kbytes of information.
5.4 The Run IA and IB Datasets
The Tevatron Collider started up after a three year shut-down in fall 1992, and continued running through the summer of 1993. As this was the D0/ detector’s first collider run, it was remarkable that the collaboration was able to successfully use 40-50% of the collisions for their physics studies. The CDF collaboration gathered of data during this period.
From the start of Run IB in 1994 to February 1995, the Tevatron Collider had delivered over 100 of collisions to each detector. The D0/ and CDF collaborations had recorded and analysed of this data by this date, giving the the two collaborations total Run I datasets of 50 and 67 , respectively.
In between Run IA and IB, both collaborations made incremental improvements to their detectors. The D0/ detector’s muon trigger was improved and various detector subsystems were modified with the goal of improving overall robustness and efficiency. The CDF collaboration replaced the original 4-layer SVX detector with a mechanically identical device that used newer, radiation-hard silicon strip wafers, and employed an AC-coupled readout design. The new detector, known as the SVX’, has much better signal-to-noise and is fundamentally better understood.
5.5 Event Reconstruction
A schematic of a event being produced in a collision and decaying into the final state partons is shown in Fig. 4 Given the large number of partons that arise from the decay of the system, each detector is required to reconstruct with good efficiency high energy electrons, muons and the jets resulting from the fragmentation of high energy quarks, and to tag the presence of one or more neutrinos by the imbalance of total transverse energy in the collision.
High energy electrons and muons are identified in both detectors by the charged track left in the central tracking systems, and by the behaviour of the leptons in the calorimeters and muon identification systems outside the calorimeters. Electrons will generate an electromagnetic shower in the calorimeter, with a lateral and longitudinal shower profile quite distinct from the shower intitiated by a charged hadron. Muons are readily identified as they generally pass unimpeded through the calorimeter and are detected outside the calorimeters as charged particles that point back to the particle trajectory in the central tracker. The CDF electron and muon reconstruction algorithms have efficiencies of % and % for leptons from boson decays. The D0/ electron reconstruction has an efficiency of %. These efficiencies are quoted for electron and muon candidates that have already passed the trigger requirements discussed earlier.
Neutrinos can only be detected by requiring that they have sufficient transverse energy that the total measured energy flow sum to a value inconsistent with zero. In practical terms, this energy flow vector is known as missing transverse energy (). Note that we cannot use the imbalance in energy flow along the beamline in this case as one can expect a significant imbalance due to the differing momentum of the partons in the proton and antiproton that collide to produce the system. The resolution in is driven by both the uniformity of the calorimeter and its inherent energy resolution. D0/ has a missing transverse energy resolution in each transverse coordinate of
| (11) |
where the summation gives the total scalar transverse energy observed in the calorimeter. CDF’s transverse energy resolution is approximately 15-20% worse, which has a modest impact on its neutrino detection ability.
Jets are constructed in both detectors as clusters of transverse energy within a fixed cone defined in - space [23]. The size of this cone is determined by the competing requirements of making it large enough to capture most of the energy associated with the fragmentation of a quark or gluon, and yet small enough that it doesn’t include energy associated with nearby high energy partons or from the “underlying” event. The latter effect in itself contributes on average approximately 2 GeV per unit in - space, and the fluctuations in this degrades the jet energy resolution (the size of this effect depends on the rate of multiple interactions). Monte Carlo (MC) calculations using a variety of models for quark fragmentation and underlying event assumptions, as well as studies of the underlying events have indicated that a jet cluster cone size substantially smaller than the traditional - radii of 0.7 or 1.0 employed in QCD studies is required. The CDF analysis employs a cone radius of 0.4 in its top quark search, whereas the D0/ collaboration has chosen to work with a cone radius of 0.5.
The requirement that most if not all daughters are reconstructed is not sufficient to reject all backgrounds to production. There are other kinematical variables that discriminate between and background events, most of them taking advantage of the fact that heavy top quark production will generate final state daughters that are on average quite energetic. This motivates the use of a variable called defined as
| (12) |
where the sum is over all the jets and the leading electron cluster (in those channels where at least one electron is required). This variable is used by the D0/ collaboration in both their dilepton and lepton+jets analysis, and its effectiveness in improving the signal-to-noise in the dilepton and lepton+jets channels is illustrated in Fig. 5. The CDF collaboration has recently reported the results of a top analysis using a similar variable [24].

An additional kinematic variable known as aplanarity [25] () has been employed by the D0/ collaboration. This, as its name suggests, is a measure of how spherical a candidate event is: events are expected to have larger values of than the corresponding physical backgrounds.
The final tool used in the reconstruction of events is the identification or “tagging” of jets that arise from the quarks. There are two techniques employed by the collaborations. The first takes advantage of the fact that bottom hadrons decay semileptonically into electrons or muons about 20% of the time. D0/ and CDF therefore search the interior of each jet cone for a muon candidate. CDF also searches for low-energy electron candidates that can be associated with the jet cluster. Because there are two quarks in each decay, the efficiency of this soft lepton (SLT) tagging scheme ranges from 10-15%. The second technique is used exclusively by CDF and takes advantage of the long-lived nature of bottom hadrons and the SVX (or SVX’) detector. A seach is performed for several charged tracks detected in the SVX that form a secondary vertex a significant distance from the primary interaction. The efficiency of this tagging scheme depends crucially on the performance of the SVX/SVX’. It is estimated that over 40% of all decays will have the presence of at least one SVX tag.
6 The Dilepton Top Quark Search
6.1 Dilepton Data Selection
The dilepton decay modes are the cleanest channel in which one would expect to observe a heavy top quark. They suffer from the relatively small total branching fraction of into these modes (a total of 4%), and from the presence of two neutrinos in the final state that are not individually observable.
The dilepton searches break down into three separate channels, the , and final states. The CDF analysis requires two isolated lepton candidates, each with and with . The candidates must satisfy standard lepton quality requirements that ensure high efficiency and high rejection from energetic, isolated charged hadrons. There are 2079 candidates, 2148 candidates and 25 candidates after these kinematical cuts. The large and candidate samples are the result of and Drell-Yan production, as can be seen by examining the invariant mass () distribution of the dilepton system. This background is removed by rejecting those events with
| (13) |
This leaves 215, 233 and 25 candidate events in the , and channels, respectively.
In addition, the events are required to have GeV and at least two jet clusters with GeV and , since events are expected to have two energetic neutrinos and a quark and anti-quark in the final state. This still leaves a background in the and sample from Drell-Yan production where the signal arises from an accompanying jet that is mismeasured. The distributions of the azimuthal opening angle between the missing transverse energy vector and the closest jet or charged lepton candidate in the event versus the missing transverse energy for each jet multiplicity are shown in Figs. 6 and 7 for the and channels, respectively. There is a clear cluster of events at small -jet opening angles that extend to higher in the (and ) samples that results from the remnant Drell-Yan contamination in the samples. The same enhancement is not present in the sample, which has no Drell-Yan contamination. A stiffer cut requiring at least 50 GeV of missing transverse energy is imposed on those events that have -jet opening angles less than . The same region is occupied preferentially by backgrounds from in the sample so it is also removed.


This leaves a total of 7 candidate CDF events, 5 in the channel and two in the channel. No dielectron events survive the selection. One of the events has an energetic photon candidate with a invariant mass consistent with that of a boson. Although the expected background from radiative decay is only 0.04 events, the candidate is removed from the sample in order to be conservative.
The D0/ analysis requires two high leptons; both leptons are required to have in the channel, in the channel, and for the electron (muon) in the channel. A cut requiring at least 20 GeV and 25 GeV is placed on the and channels, respectively (no requirement is placed on candidate events). The selection requires at least two jets with corrected transverse energy with . Finally, and candidate events are required to have GeV and events are required to have GeV.
This leaves a total of 3 dilepton candidate events in the D0/ dataset. There are 2 events, no events, and 1 event. The integrated luminosities corresponding to these three channels is , and , respectively. The number of observed events expected from production is shown in Table 2.
| Mass () | D0/ | CDF |
|---|---|---|
| 150 | 2.4 | 6.2 |
| 160 | 2.0 | 4.4 |
| 170 | 1.6 | 3.0 |
| 180 | 1.2 | 2.4 |
6.2 Dilepton Backgrounds
The number of dilepton events observed by CDF and D0/ is consistent with the rate expected from production for a top quark mass of order 140 to 150 . It is necessary to accurately estimate the number of events expected from standard model background processes in order to interpret these event rates.
The most serious potential background comes from boson production followed by the decay . The leptons then decay leptonically leaving the dilepton signature and missing energy from the four neutrinos. The rate of this background surviving the selection criteria can be accurately estimated using the observed boson kinematics in the dielectron and dimuon channels and simulating the decay of the leptons. Other standard model sources of dileptons are divector boson production, and production and Drell-Yan production. Most of these are either very small (e.g., the backgrounds from and production) or can be estimated reliably from collider data (e.g. heavy quark production). Jets misidentified as leptons are a background source that also can be accurately estimated using the data. CDF uses the strong correlation between fake lepton candidates and the larger energy flow in proximity to the candidate. D0/ employs similar techniques to estimate this background.
The estimated background rates in the three channels are listed in Table 3 and total to and for the CDF and D0/ analyses, respectively. In both cases, there is an excess of observed candidate events above the expected backgrounds.
| Background | CDF | D0/ |
|---|---|---|
| Drell Yan | ||
| Fake or | ||
| Heavy quarks | ||
| Total |
The significance of this observation can be quantified in a number of ways. One method is to ask how likely this observation is in the absence of production (the null hypothesis). The answer to this is an exercise in classical statistics [26], where one convolutes the Poisson distribution of expected background events with the uncertainty in this expected rate. The significance of the CDF observation is then ; the significance of the D0/ observation is .
In themselves, each analysis cannot rule out the possibility that the observed events may be due to background sources. Taken together, however, they make the background-only hypothesis very unlikely.‡‡‡‡‡‡ One cannot simply multiply the two significances together. To combine these observations, one could define a single statistic (like the total number of observed events in both experiments) and then model the fluctuations of this variable in the case of the null hypothesis. This would give a larger probability of a background hypothesis than the product of the two probabilities. The obvious next step is to seek independent confirmation.
6.3 B Tagging in the Dilepton Sample
If the dilepton sample has a contribution from production, it is reasonable to search for evidence that two quarks are being produced in association with the dilepton pair and neutrinos.
The CDF collaboration has examined these events for such indications using the tagging algorithms described in detail in the following section. Three of the six events have a total of five tagged jets, three with SLT tags and two with SVX tags. CDF estimates that only 0.5 events with tags would be expected from non- standard model sources, whereas one would expect 3.6 tags if the events arose from the expected mixture of background and production. The data are certainly consistent with the hypothesis, and motivate a detailed study of the other potential channels.
7 The Lepton+Jets Top Quark Search
Both collaborations begin their lepton+jets analysis from a data sample dominated by inclusive production. They require events with significant and a well-identified, high transverse momentum electron or muon. D0/ requires the presence of an isolated electron with GeV, and GeV to identify an inclusive sample, and an isolated muon with and GeV to identify a sample. CDF requires a candidate event to have GeV and a charged lepton candidate in the central detector with and . The transverse mass for the resulting candidate events, defined as
| (14) |
where is the azimuthal opening angle between the charged lepton and the vector, has a distribution with a clear Jacobian peak, as illustrated by the CDF data shown in Fig. 8.

7.1 The D0/ Lepton+Jets Search
7.1.1 The D0/ Kinematic Analysis
The production of bosons accompanied by additional jets form the largest single background in the lepton+jets search. However, there are significant differences in the kinematics of the partons in the and +jets final state that can be used to differentiate between these processes. For example, the distribution is compared for the and +jets final state in Fig. 5(b). One sees that this variable provides significant separation between signal and background with only a modest loss of signal.
The D0/ collaboration defines a candidate sample by requiring that GeV, that there be at least four jets in the final state with GeV and , and that the aplanarity of the event . This leaves 5 jet events and 3 jet events in the sample. They expect to observe events from production in this sample for a top quark mass of 180 .
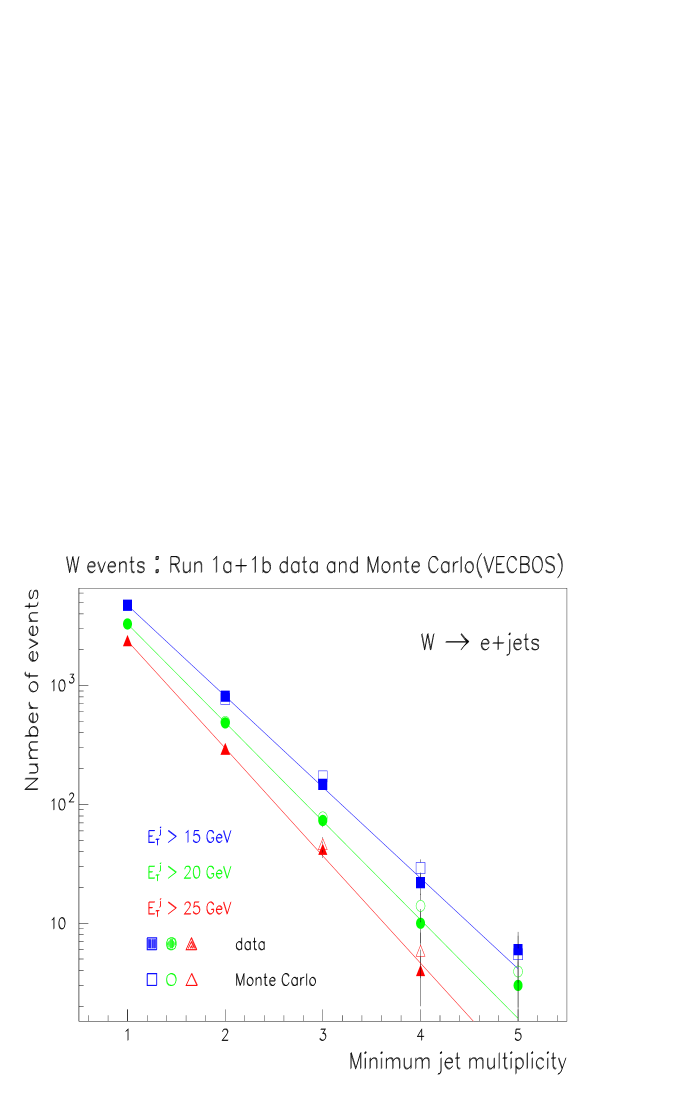
The backgrounds to production in this sample are dominated by the inclusive +jets process. In order to estimate the size of this background, one can use the rate of observed events in the , , and jet sample and extrapolate that to the number of events in the jet sample. It is expected that the ratio of jet events to jet events will be constant given the same jet requirements[19] when the and aplanarity cuts are removed. This prediction can be tested using the jets, and jet samples where one expects to see little contribution. The results of this test, shown in Fig. 9, confirm that this ratio remains constant.
The D0/ collaboration then applies the and aplanarity cuts and uses the relative efficiency of these cuts on signal and the jets background to extract the number of events in the sample and the number of background events that remain. The D0/ collaboration estimates the size of the background in their jet sample to be events. There is a clear excess of observed events above the predicted background.
7.1.2 B Tagging in the D0/ Sample
D0/ has performed a separate analysis requiring that one of the jets also be consistent with a quark semileptonic decay. This study is complementary to the D0/ kinematical analysis, and does not depend on the jet-scaling arguments to estimate the backgrounds.
D0/’s excellent muon identification capability makes it possible to tag hadrons by searching for the decay . Because there are two jets in each signal event, the fraction of tagged events will be twice the semileptonic branching fraction of hadrons times the efficiency for identifying muons. D0/ studies show that the use of standard muon identification requirements applied to candidates with result in a tagging efficiency for jet events of %. This is relatively insensitive to the actual top quark mass, rising slowly as a function of .
“Fake” tags are expected to arise from real muons resulting from heavy quark (, ) semileptonic decay and decays-in-flight of and mesons. This would imply that the fake rate per jet should be relatively independent of the number of jets in a given event, or the topology of the jets in the event. The D0/ collaboration has measured the expected background rate for their tagging scheme using a large sample of events coming from their inclusive jet triggers. Since the jets in these events are expected to arise predominantly from light quarks and gluons, they form a good sample to estimate the probability of incorrectly tagging a light quark or gluon jet. This leads to an over-estimate of the background from light quark jets, as some of the jets in this inclusive jet control sample will have and quarks in them, albeit at a low rate. These studies show that the tag rate is between 0.005 and 0.010 per jet, and rises slowly with the of the jet. Detailed Monte Carlo calculations using a full detector simulation verify this result. Based on this study, D0/ expects that % of the and jet background events will be tagged. With this fake rate, tagging provides an order of magnitude improvement in signal-to-noise in this sample.
The D0/ collaboration use a less stringent jets selection when also requiring a quark tag in order to optimise the signal-to-noise of this analysis. The events are required to have GeV, and the jet multiplicity requirement is relaxed to demand at least three jets with GeV. In addition, the aplanarity cut is dropped altogether, and in the case of the electron + jets channel, the cut is relaxed to require GeV. There are 3 events in the +jet and +jet channels that survive these requirements, whereas only and events are expected from background sources, respectively. As in the dilepton and lepton + jets channels, a excess of candidate events over background is observed.
7.2 The CDF Counting Experiment
The CDF collaboration has performed an analysis of their lepton+jets data similar to that reported for the Run IA dataset [11]. The analysis avoids making stringent kinematical cuts that could result in large systematic uncertainties, and takes advantage of the presence of two quarks in the signal events to control the expected backgrounds.
Starting from the inclusive boson sample, the CDF analysis requires at least three jets with GeV and . This results in 203 events, with 164 and 39 events in the and jet samples, respectively. The backgrounds estimated to make the largest contribution to this sample come from real boson production, from standard model sources of other isolated high leptons (such as boson production), from and quark semileptonic decays and from events where the lepton candidate has been misidentified. Most of the non- boson backgrounds have lower , and are characterised by lepton candidates that are not well isolated from other particles in the event. The correlation between this additional energy flow and in the event allows one to directly measure this background fraction. This results in an estimate for the background from sources of non-isolated lepton candidates of %. The background rates from sources that produce isolated lepton candidates have been estimated using data and Monte Carlo calculations. These background estimates are summarised in Table 4.
| Background | Fraction of Sample (%) |
|---|---|
| , Production | |
| Fake Leptons, Conversions, | |
| Total |
7.2.1 Secondary Vertex Tagging
The CDF detector has the unique capability of detecting quarks by reconstructing the location of the quark’s decay vertex using the SVX detector. A schematic of the decay topology for a bottom hadron is shown in Fig. 10. The charged particle trajectories are reconstructed in the CTC and then extrapolated into the SVX detector to identify the track’s hits in the silicon strip detector.
The quality of the reconstructed SVX track is determined by the number of SVX coordinates found for the track and the accuracy of each coordinate. The algorithm to reconstruct secondary vertices considers all tracks above a transverse momentum of 1.5 that have an impact parameter relative to the primary vertex , where is the estimated uncertainty in the impact parameter measurement for the track. The algorithm first looks for vertices formed by three tracks, making relatively loose quality cuts on each of the tracks. A vertex is accepted if a fit requiring the three tracks to come from a common point is acceptable. Any remaining high-quality tracks with large impact parameter are then paired up to look for two-track vertices. A jet containing a secondary vertex found in this way that has a positive decay length is considered SVX tagged (the sign of the decay length is taken from the dot product of the displacement vector between the primary and secondary vertices, shown as in Fig. 10, and the vector sum of the momenta of the daughter tracks).

The efficiency of this SVX tagging algorithm has been measured using a large sample of inclusive electron and candidates, where the heavy quark contents in these samples have been independently estimated. This efficiency agrees with that obtained using a full detector simulation; the ratio of the measured efficiency to the efficiency determined using the detector simulation is .
The quark SVX tags not arising from production come from track combinations that for some reason result in a fake secondary vertex (mistags) and from real sources of and quarks in jet events. One way of estimating the mistag rate is to note that the rate of these fakes must be equal for those secondary vertices located on either side of the collision vertex as determined by comparing the displacement vector of the secondary vertex with the momentum vector of the tracks defining the secondary vertex (positive and negative tags, respectively). The rate of real and quarks not arising from production can be estimated using theoretical calculations and comparing these with observed rates in other channels.
The mistag probability has been measured using both samples of inclusive jets and the inclusive electron and dimuon samples. The probability of mistagging as a function of the number of jets in the event and the transverse energy of the jet is shown in Fig. 11, based on the inclusive jet measurements where I have plotted both the negative and positive tag rates. The negative tag rate is perhaps the best estimate of the mistag rate, since one expects some number of real heavy quark decays in this sample to enhance the positive tag rate. The mistag rate per jet measured in this way is , and is lower than the positive tag rate measured in the inclusive jet sample (), as expected from estimates of heavy quark production in the inclusive jet sample.
To account for all sources of background tags, the number of tagged events expected from sources of real heavy quark decays (primarily and final states) is determined using a Monte Carlo calculation and a full simulation of the detector. The sum of this “physics” tag rate and the mistag rate then gives an estimate of the total background to production. This estimate can be checked by using the positive tag rate in inclusive jet events as a measure of the total non- tag rate in the jet events. This gives us a somewhat higher background rate, due primarily to the expected larger fraction of and quarks in the inclusive jet sample compared to the jet events.

The efficiency for finding at least one jet with an SVX tag in a signal event is calculated using the ISAJET Monte Carlo programme [27] to generate a event, and then applying the measured tagging efficiencies as a function of jet to determine how many reconstructed quark jets are tagged. The SVX tagging efficiency, i.e. the fraction of jet events with at least one SVX-tagged jet, is found to be , making this technique a powerful way of identifying candidate events.
7.2.2 Soft Lepton Tagging
The CDF collaboration developed the original lepton-tagging techniques to search for quarks in production [28], requiring the presence of a muon candidate in proximity to one of the jets. The collaboration has enhanced these techniques by extending the acceptance of the muon system and by searching for electron candidates associated with a jet cluster. In both cases, it is optimal to allow for relatively low energy leptons (down to ’s as low as 2 ), so this technique has become known as “soft lepton tagging.” A candidate jet cluster with a soft lepton candidate is considered to be SLT tagged.
The efficiency of this tagging technique depends on the ability to identify leptons in the presence of additional hadrons that come from the fragmentation of the quark and the decay of the resulting quark system. Muons are identified by requiring a charged track in the CTC that matches a muon track stub. Electron candidates are defined by an electromagnetic shower in the calorimeter with less than 10% additional energy in the hadronic calorimeter towers directly behind the shower, a well-reconstructed track in the CTC that matches the position of the shower and shower profiles consistent with those created by an electron. The overall efficiency for finding at least one SLT tag in a event is , and is not a strong function of the top quark mass.
The rate at which this algorithm misidentifies light quark or gluon jets as having a soft lepton is determined empirically by studying events collected by requiring the presence of at least one jet cluster. The mistag rate for muon tags varies between 0.005 and 0.01 per charged track, and rises slowly with the energy of the jet. The mistag rate for electrons also depends on the track momentum and how well isolated it is from other charged tracks; it typically is of order 0.005 per track. Fake SLT tags where there is no heavy flavour semileptonic decay is expected to be the dominant source of background tags in the sample, due to the larger SLT fake rates as compared to the SVX mistag rates.
7.2.3 Tagging Results in the CDF Lepton+Jets Sample
The SVX and SLT tagging techniques have been applied to the jet sample as a function of the number of jets in the event, and the expected number of mistags has been calculated for each sample. This provides a very strong consistency check, as the number of observed tags in the jet and jet samples should be dominated by background tags; the fraction in these two event classes expected from production is less than 10% of the total number of candidate events.
The number of candidate events and tags is shown in Table 5. There is good agreement between the expected number of background tags and the number of observed tags for the jet and jet samples. However, there is a clear excess of tags observed in the jet sample, where we observe 27 and 23 SVX and SLT events, respectively, and expect only and SVX and SLT background tags. The excess of SVX tags is particularly significant, with the probability of at least this number of tags arising from background sources being . The excess of SLT tags is less significant because of the larger expected background. The probability that at least 23 observed SLT tags would arise from background only is and confirms the SVX observation.
| Sample | SVX bkg | SVX tags | SLT bkg | SLT tags |
|---|---|---|---|---|
| W+1 jet | 40 | 163 | ||
| W+2 jet | 34 | 55 | ||
| W+ jet | 27 | 23 |
It is interesting to note that if we attribute the excess number of SVX tags in the jet sample to production, we would expect approximately 10 jet tagged events resulting from production. This is in good agreement with the excess of observed tags () in this sample, and corroborates the hypothesis that the excess in the jet sample is due to the process.
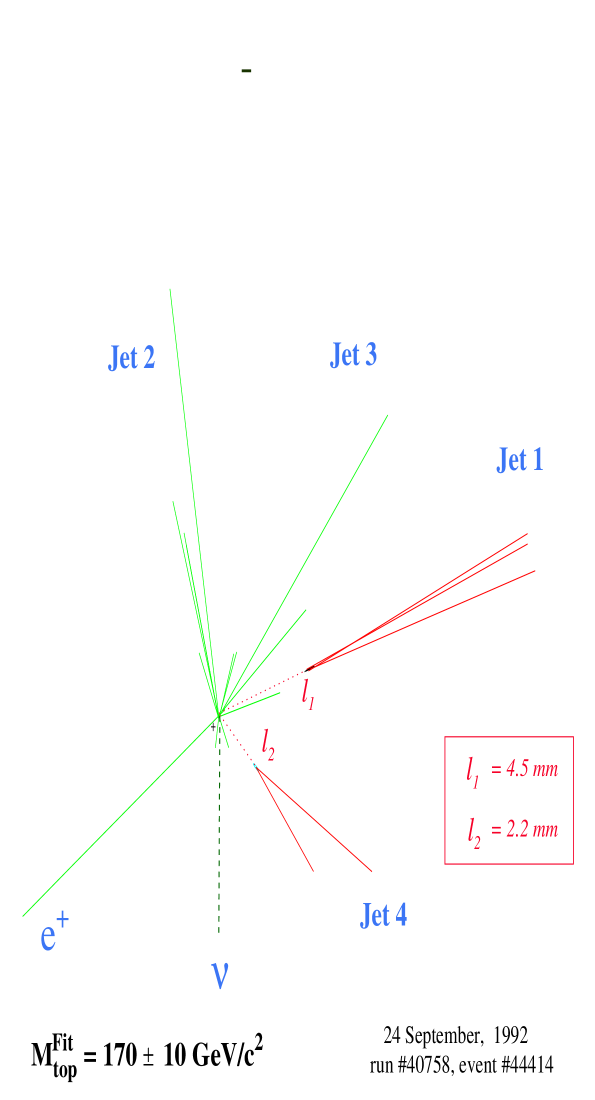
A striking feature of the tagged sample is the number of events with two or more tagged jets. The 27 SVX tags are found in 21 events, so that there are 6 SVX double tags. There are also six SVX tagged events that have SLT tags. We would expect less than one SVX-SVX double tag and one SVX-SLT double tag in the absence of production, whereas we would expect four events in each category using the excess of SVX tags to estimate the production cross section. A schematic of one of the SVX double tagged events is shown in Fig. 12, where the tracks reconstructed in the SVX detector are displayed, along with the jets and lepton candidates they are associated with. These observations strengthen the interpretation of the CDF sample.
7.3 Summary of Counting Experiments
The results of the lepton+jets counting experiments performed by D0/ and CDF are summarised in Table 6. Both collaborations observe an excess of events in all the channels in which one can reasonably expect evidence for the top quark. Many of the channels demonstrate correlated production of bosons with quarks – exactly what we would expect from decay.
| Sample | Background | Observed |
|---|---|---|
| CDF Dileptons | 6 | |
| D0/ Dileptons | 3 | |
| Lepton + Jets (D0/ Kinematics) | 8 | |
| Lepton + Jets (D0/ B Tagging) | 6 | |
| Lepton + Jets (CDF SVX tags) | 27 | |
| Lepton + Jets (CDF SLT tags) | 23 |
Taken together, this is overwhelming evidence that the two collaborations are observing phenomena that within the context of the standard model can only be attributed to pair production of top quarks.
8 Measurement of Top Quark Properties
In order to further test the interpretation that top quark production is responsible for the excess in the dilepton and lepton+jets channels, both collaborations have measured the rate of top quark production and identified a subset of their candidate lepton+jet events where it is possible to directly measure the mass of the top quark.
These measurements allow us to test the standard model prediction for the cross section as a function of the top quark mass. The initial evidence for top quark production published by CDF [11] implied a top quark production cross section almost two standard deviations above the theoretically predicted value. Moreover, other standard model measurements, and in particular those performed at LEP, constrain the top quark mass. It is important to directly verify that these predictions agree with the top quark mass inferred from the Collider data.
The CDF and D0/ Collaborations have also begun other studies of top quark properties that can be inferred from the Collider data. These include aspects of both top quark decay and production, and I discuss their status in the following subsections.
8.1 The Top Quark Cross Section
The acceptance of the D0/ and CDF top quark searches depend on the top quark mass. We can therefore infer the production cross section as a function of the top quark mass given the number of observed events in each channel.
For a data sample with integrated luminosity , if we observe candidate events in a particular channel and we expect background events, then the maximum likelihood solution for the cross section of the process combining all channels is
| (15) |
where is the acceptance for the search. This assumes that the observed number of events has a Poisson distribution and that uncertainties on the acceptance can be ignored. The latter restriction can be relaxed by numerically solving for the maximum likelihood solution allowing for uncertainties in and , and any correlations in the acceptances.
The CDF collaboration has performed a preliminary measurement of the cross section using the SVX tagged sample. This is the single most significant measurement and can be performed only knowing the SVX tagging efficiency and background rates. The addition of the SLT sample and the dileptons into the cross section measurement requires a knowledge of the efficiency correlations in the samples and is work in progress. The acceptance was determined using the ISAJET Monte Carlo programme, and found to be . The uncertainties associated with this acceptance calculation are listed in Table 7. The expected background in the 21 tagged events is events.§§§§§§ The previous estimate of the expected SVX background tags assumed that there was no contribution from production to the 203 events in the jet sample prior to tagging.
| Source | Uncertainty (%) |
|---|---|
| Lepton ID and Trigger | 10 |
| Initial State Radiation | 7 |
| Jet Energy Scale | 6.5 |
| Tagging Efficiency | 12 |
The resulting cross section determined from the SVX sample is pb for a nominal top quark mass of 175 . This is approximately one standard deviation lower than the cross section determined in the Run IA CDF data. It is in good agreement with the theoretically predicted value of pb for the same top quark mass.
The D0/ collaboration estimates the cross section using the information from all the channels they have studied. They also perform a background subtraction and then correct for the acceptance, channel by channel. They determine pb, for a top quark mass of 200 . This value doubles to pb if one assumes a top quark mass of 160 . The top quark mass dependence of the D0/ cross section is illustrated in Fig. 13.

The CDF and D0/ estimates are in reasonable agreement with each other, although both have large uncertainties. A strong test of the lowest order calculation for and next-to-leading order corrections will have to wait for substantially more statistics.
8.2 The Top Quark Mass
The top quark mass can be determined directly by correlating the kinematics of the observed partons in the final state. The sensitivity of this measurement depends on the amount of “missing” information in the events, and the inherent resolution of the detectors to jets and missing energy. The lepton jet events offer the possibility of fully reconstructing the system provided one assumes that the missing transverse energy arises from the undetected neutrino, and that four of the jets come from the and quarks and the two quarks from the decay.
Perhaps the most serious complication to this procedure is the difficulty of associating final state jet clusters with the partons from the decay. The jets are only approximate measures of the initial state parton, and there is often not a 1-to-1 correspondence between partons resulting from the decay and observed jets. This is due to gluon radiation that can cause one parton to be observed as two jet clusters, and overlap of jet clusters, where two partons merge into a single jet cluster. To complicate matters further, additional partons are produced by initial and final state radiation, so the number of observed jet clusters may readily exceed four.
The number of combinatorial possibilities for assigning partons to jets in the case where only four jets are observed is twelve (we only have to identify the two jets associated with the decay and not have to permute these two). If we can identify one of the jets as arising from a bottom quark, the number of possible assignments reduces to six. Any technique that reconstructs the decay in this mode has to reduce the effect of these combinatorial backgrounds on the expected signal.
8.2.1 CDF Mass Analysis
The CDF collaboration measures the top quark mass by selecting a sample of lepton+jet events with at least four jets, and then making the parton-jet assignment that best satisfies a constrained kinematic fit. The fit inputs are the observed jet momentum vectors, the momentum vector for the charged lepton, the transverse energy vector for the neutrino and the vector sum of the momentum of the unassigned jets in the event. The uncertainties in these quantities are determined from the measured response of the detector. The fit assumes that the event arises from the process
The fit constrains the and decay daughters to have an invariant mass equal to the mass and constrains the and the to have the same mass. The unknown recoil system is observed in the detector as unassociated jets and the “unclustered” energy in the calorimeter, i.e. the energy not associated with a jet. Only the four highest jets are considered, reducing the possible combinations at the cost of some degradation in top quark mass resolution (in those cases where the daughter jets are not the four highest jets in the event).
Formally, there are two degrees of freedom in the fit when we take into account the number of constraints and the number of unmeasured quantities. A function including the uncertainties in the measurements is minimised subject to the kinematic constraints for each possible parton-jet assignment. The -tagged jets in the event are only allowed to be assigned to the or quarks. Prior to the fit all jet energies are corrected in order to account for detector inhomogeneities and the effect of energy flow into and out of the jet clustering cone. The parton assignment that produces the lowest is selected for the subsequent analysis. The event is rejected if the minimum is greater than 10. Parton assignments that result in a top quark mass greater than 260 are also rejected as the experiment is not expected to have any sensitivity to top quark masses of that magnitude.
Monte Carlo studies have demonstrated that this procedure identifies the correct parton-jet assignment about 40% of the time. The top quark mass resulting from the fit in those cases is shown in Fig. 14 along with the mass distribution for all lepton + jet events for a sample created assuming a top quark mass of 170 . From a single event, one is able to measure the top quark mass to an accuracy of when one makes the correct assignment. However, the full distribution shows that the fitting and parton assignment procedure retains much of this mass information even in those cases where the incorrect parton assignment has been made.

Starting with the 203 jet events, the CDF collaboration selects a subset of events that have at least one additional jet with GeV and . The requirements on the fourth jet are less stringent than the first three jets in order to enhance the efficiency for detecting all four jets from the decay. There are 99 such events in the CDF sample prior to requiring a -tagged jet, and 88 of these pass the cut on the best jet-parton assignment and kinematic fit. The additional requirement of at least one SVX or SLT-tagged jet leaves 19 events.
The background of non- events in this sample is estimated in the same manner used in the cross section analysis. One assumes that the 88 event sample is a mixture of background and signal, and then applies the known background tag rates to determine how many of the non- events would be tagged. This results in a estimated background in the 19 events of events. This background is expected to be a combination of real +jet events and events where an energetic hadron fakes the lepton signature. Studies of the +jet events, candidate events where the lepton is not well-isolated and +jet Monte Carlo events show that the resulting top quark mass distribution for these different background events are all similar. The CDF collaboration therefore uses the +jet Monte Carlo sample to estimate the background shape in the top quark mass distribution.
The resulting top quark mass distribution is shown in Fig. 15. One sees a clear peak around 170-180 with relatively long tails. The dotted distribution represents the shape of the non- backgrounds, normalised to the estimated background rate. The top quark mass is determined by performing a maximum likelihood fit of this distribution to a linear combination of the expected signal shape determined by Monte Carlo calculations for different top quark masses and the background. The background rate is constrained by the measured rate of non- events in the sample. The negative log-likelihood distribution for this fit is shown in the inset in Fig. 15. It results in a top quark mass of .

Since the fit constrains the invariant mass of the jets assigned to be the boson daughters to the boson mass, one can only test the consistency of this assignment by first relaxing this constraint and then examining the dijet invariant mass distribution. I show this in Fig. 16 for the jet events that satisfy the selection criteria without the imposition of the dijet mass constraint. The comparison with the expected distribution from the combination of background events and signal is quite good. However, one should keep in mind the rather low statistics and the large expected mass resolution. This distribution will become a very important calibration tool when larger statistics samples become available.

The largest systematic uncertainties in this measurement arise from uncertainties in the modelling of gluon radiation in jets in the final state, absolute jet energy scale, variations in fitting procedures, and the shape of the non- background. A number of other potential sources of uncertainty have been studied, and have been found to contribute a total of to the total systematic uncertainty. A summary of these uncertainties is given in Table 8, and total to .
| Source | Uncertainty () |
|---|---|
| Final State Gluon Radiation | 7.7 |
| Absolute Jet Energy Scale | 3.1 |
| Variations in Fit Procedures | 2.5 |
| Shifts Resulting from Tagging Biases | 2.4 |
| Monte Carlo Statistics | 3.1 |
| Non- Mass Distribution Shape | 1.6 |
| Miscellaneous Effects | 2.0 |
One can quantify the significance of the shape of the mass distribution by performing an unbinned Kolmogorov-Smirnov test. The probability that the observed mass distribution could arise from purely background sources is . This test is conservative in that it only compares the shape of the background with the observed data. Other measures of significance can be used. For example, one can define a relative likelihood for the top+background and background-only hypotheses and then ask how often a background-only hypothesis would result in a relative likelihood as significant as that observed. This test gives a probability for a background fluctuation of less than . However, it is more model-dependent as it assumes a specific shape for the non-background hypothesis.
8.2.2 The D0/ Mass Measurement
The D0/ collaboration estimates the top quark mass using their sample of lepton + jet events. In their analysis, they select 4-jet events by requiring that all jets have a corrected transverse energy GeV with . They also require the events to have GeV and to have aplanarity . They find 14 events that satisfy these requirements.
They then perform a fit of the observed kinematics in each event to the hypothesis, requiring that the mass of the assumed system equal the mass of the system making all possible parton-jet assignments in the final state. As in the CDF technique, they only consider the four highest jets, and only fits with are considered acceptable. There are 11 events that have at least one configuration that gives an acceptable fit. For each event, they assign a top quark mass by averaging the top quark mass from the three best acceptable fits for that event, weighting the mass from each fit with the probability from the fit. The resulting histogram of the invariant mass of the three-parton final state (the hypothesised top quark) is shown in Fig. 17(a). They performed the same analysis on a “looser” data sample of 27 events, where the and aplanarity requirements were removed. This yields similar results, as shown in Fig. 17(b), although with significantly larger backgrounds. The mass distribution shows an enhancement at a three-parton invariant mass around 200 , as expected from production (shown as the higher mass curve in both plots). The corresponding mass distribution expected from the QCD jet background is shown in Fig. 17(a)-(b) as the dashed curve at lower mass. It peaks at small values of three-parton invariant mass and together the combined background and signal hypothesis model the data well.
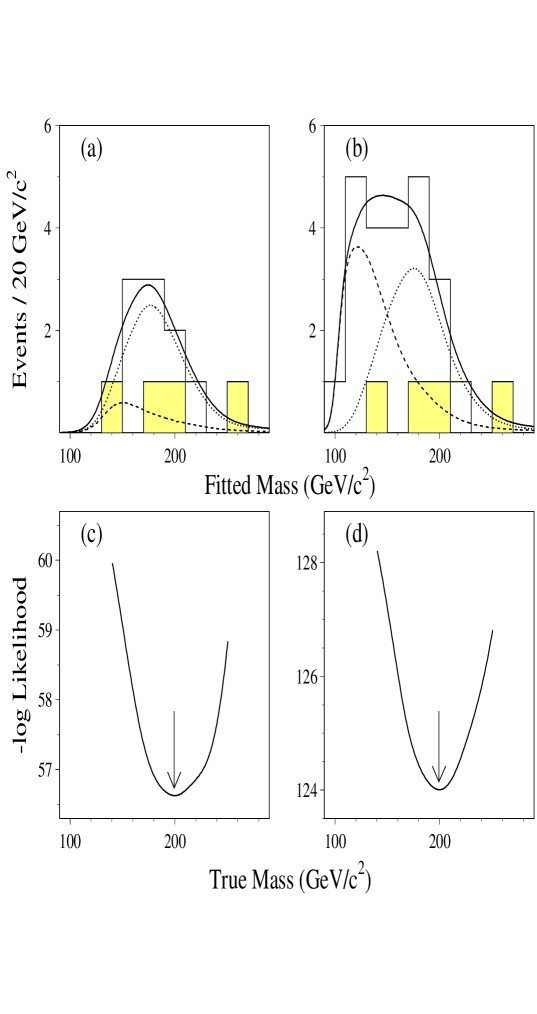
The mass distribution obtained using the looser selection is fit to a combination of signal and background, yielding a top quark mass of
| (17) |
where the two uncertainties are statistical and systematic, respectively. A similar fit to the mass distribution using the 11 event sample results in a consistent result, but with larger statistical uncertainties. The negative log-likelihood distributions for the fits to the standard and loose selection are shown in Fig. 17(c) and (d), respectively. The systematic uncertainty is dominated by the sensitivity of this analysis to the D0/ jet energy scale.
8.3 Top Quark Decays
The standard model predicts that the top quark will decay via a - interaction into the final state 100% of the time. It is important to confirm this prediction as various extensions to the standard model differ on the predicted phenomenology of top quark decays. There are effectively two separate predictions that should be tested:
-
1.
The decay proceeds via the standard model charged current.
-
2.
The top quark always decays to a quark.
It is useful to address these two predictions separately as they involve different aspects of the standard model, namely the assumption that there is only one current involved in the top quark decay and on our understanding of the vertex.
In the context of the standard model, the GIM mechanism is responsible for suppressing all flavour-changing neutral currents (FCNC). This has been experimentally tested in the strange and bottom quark sector, where limits on FCNC decays are quite stringent.[29] An extension to the top quark sector is therefore an important verification of this fundamental aspect of the electroweak interaction. The standard model does allow top quark charged current decays to either or a quarks, but only via the mixing of the quark mass eigenstates as parametrised by the Cabibbo-Kobayashi-Maskawa (CKM) matrix elements or . If we assume that there are only three generations and that the CKM matrix is unitary, then the 90% CL limits on these two elements are [30]
| (18) |
This predicts top quark branching fractions to and quarks of less than 0.3%. However, if we relax the condition of unitary and/or allow for a larger number of quark generations, then the strict limits on and no longer apply, and the possibility exists for large top quark decay rates to these lighter quarks.
There are a number of standard model extensions that predict decay modes not involving a transition mediated by a boson [31]. The most obvious candidates are the flavour-changing neutral decays such as or . Such models therefore result in decays that violate both standard model predictions. There are also models that predict decay modes that always yield a quark in the final state, but involve a transition mediated by something other than the boson. A popular example of this is the decay , where is a charged Higgs boson. Since the decay modes of the are in principle quite different from those of the , this would result in a different rate of lepton+jet and dilepton final states coming from the system.
8.3.1 Top Quark Branching Fraction
The measurement of top quark branching fractions is currently limited by the rather small number of detected events, and by the large uncertainty in the top quark production cross section. The most sensitive measures of the top quark branching fraction that do not depend on a knowledge of the are the relative rate of single to double quark tags in lepton+jet events, and the relative rates of zero, single and double quark tags in dilepton events. The relative rate of zero quark tags in lepton+jet events is not helpful in this case as this sample is contaminated with a large fraction of non- background.
These relative rates are sensitive to
| (19) |
The fractions of zero, single and double tagged events can be related to by the expressions
| (20) | |||||
where is the tagging efficiency. These can be solved for to obtain the expressions
| (21) | |||||
| (22) |
where the first expression is applicable to both the lepton+jets and dilepton event samples, and the second applies to the dilepton sample only.
These relative rates of tagged events are most efficiently combined by using a maximum likelihood technique to determine . The likelihood function that combines the CDF data from each channel is shown in Fig. 18 as a function of . The function peaks near unity, but has a large width that results from the limited statistics of the sample. From this distribution, one determines that
| (23) |
where the systematic uncertainty is dominated by the uncertainty in tagging efficiency.

Since is a ratio involving three CKM matrix elements, we can convert this measurement into a statement about by assuming, for example, the limits on and quoted in Eq. 18. This results in
| (24) |
which is in agreement with the standard model expectation, albeit with large uncertainties. The result is most directly interpreted as implying or .
8.3.2 Other Aspects of Top Quark Decays
The poor statistics of the D0/ and CDF samples limit the detail with which one can study other aspects of top quark decays. However, I would like to mention two specific studies that are currently underway, though results are not yet available.
The - nature of the charged current results in the prediction that the decay will result in bosons that are longitudinally polarised, that is, they will be produced with helicity aligned transverse to their momentum vector. This arises from the large top quark mass, as the fraction of longitudinal polarisation is given by
| (25) |
One will, with sufficient statistics, be able to extract this helicity information from the angular distribution of the charged or neutral lepton helicity angle measured in the lab frame that arises from the leptonic decay of the boson.[32]
One can also test for FCNC top decays by searching for evidence of or bosons in final states such as
| (26) | |||||
which would arise if there was an appreciable FCNC top quark decay rate. These final states are essentially free of backgrounds,[33, 34] so that the searches will be limited by the branching ratios and the integrated luminosity.
8.4 Top Quark Production Properties
QCD calculations predict that top quarks should be produced with a relatively soft distribution and in the central pseudorapidity region. Extensive theoretical studies have been done of heavy quark production, and the theoretical uncertainties in the QCD predictions are quite modest. Although there has been some theoretical concern about the number and spectrum of additional jets arising from QCD radiation and higher-order processes, the general consensus is that these standard model uncertainties do not have a large effect on the production kinematics of top quarks.
However, there has been speculation that new physics beyond the standard model could have an influence on the production properties of the system [35, 36]. There are in principle a large number of ways that such effects could be observed, which range from deviations from QCD in the production cross section to new particle resonances that couple strongly to the system and therefore influence the kinematics of the final state.
The statistics of the CDF and D0/ samples limit our ability to exclude such anomolous effects, but one study illustrates how much we can learn from the Tevatron samples. A resonance coupling to the system (such as a heavy neutral gauge boson, or a ) could result in an enhanced production cross section and be directly observed as an enhancement in the invariant mass distribution.[35] The observed invariant mass distribution from CDF is shown in Fig. 19, and is compared with what one would expect to observe if such a boson does exist in Fig. 20. Note that this phenomena is predicted to strongly enhance the total production cross section for boson masses of order 500 or less. These data have been used to exclude at the 95% CL the existence of a with mass less than . This limit only takes into account statistical uncertainties; however, it is expected to be relatively insensitive to the systematic uncertainties that have not yet been fully characterised.


9 Future Top Quark Studies
9.1 Hadron Collider Development
Our current studies of the top quark system are based entirely on the top quark samples that have been collected at the Fermilab Tevatron Collider. With approximately 100 of integrated luminosity, these samples are going to remain our only direct data on the top quark for the next three years.
The next Tevatron Collider run, known as Run II, is scheduled to begin in 1999 and will give us at least an order of magnitude improvement on the statistics of Run I. This will be achieved with the construction of the Main Injector, a new synchotron that will replace the Tevatron’s Main Ring as the accelerator and injector for the Collider, and the construction of a new source. The Main Injector will allow significant increases in the maximum proton density that can be accomodated during acceleration and will provide a much larger acceptance of particles into the Tevatron Collider. In addition, the bunch spacing in the Tevatron Collider will be reduced from the current 3.0 s to 396 ns and ultimately to 132 ns. The Tevatron maximum collision energy will also be increased by 10% to 2.0 TeV by improving the capability of the cryogenic systems.
These improvements will yield an instantaneous luminosity of , an order of magnitude increase from Run I operating conditions. Over a period of four years, the facility is expected to provide each experiment with a data sample of 2 fb-1, a factor of 20 increase in integrated luminosity over Run I. The increase in centre of mass energy results in a 30% increase in the yield, so an overall factor of 25 in produced top quark pairs is therefore expected.
The next step in top quark studies at hadron colliders will involve the Large Hadron Collider (LHC) currently under construction at CERN and scheduled for turn-on around 2004. The LHC, ultimately operating at TeV, will allow very high statistics studies due to the much larger production cross section and the much larger luminosity. The increased collision energy results in a production cross section of 1 nb, or a factor of 100 increase over the Run II production cross section. Even at relatively low initial luminosities of to , the LHC will be producing top quarks at rates between 100 to 1000 times higher than the Tevatron during Run II. Although one has to take care in making direct comparisons due to the significantly more complex interactions that take place at the LHC, it is clear that this machine will have an enormous impact on what we will learn about the top quark.
I will briefly examine the top quark physics prospects of these two facilities in the following sections. A more detailed discussion of top quark physics prospects at the Tevatron is available[37].
9.2 Tevatron Studies
The Run II top quark studies will benefit from both the much larger time-integrated luminosities made possible by the Main Injector and significant improvements in both the D0/ and CDF detectors. Both collaborations are upgrading their charged particle detection systems by replacing all their subdetectors with new devices designed with the Run I experience in mind and optimised for Run II operating conditions. The D0/ detector will now incorporate a superconducting solenoid magnet that will allow momentum analysis of charged particles, and both detectors will have enhanced silicon vertex tracking detectors that provide tracking coverage of virtually the entire luminous region. The collaborations are making other significant improvements in lepton identification systems, both for the detection of the high leptons from the decay of bosons produced in events and the detection of the soft leptons from quark decay.
9.2.1 Top Quark Event Yields
In order to estimate the expected number of reconstructed events, I have used the observed CDF yields of lepton+jet and dilepton events in Run I and taken into account the following effects:
-
•
Run II will provide a factor of 20 increase in integrated luminosity.
-
•
The SVX tagging efficiency will be improved by approximately a factor of 2 due to the increase in acceptance of the SVX subdetector to cover the entire luminous region at the interaction point.
-
•
The soft lepton tagging efficiencies will be improved by of order 10% by extending the technique into the pseudorapidity region .
With these assumptions, the expected yield of different categories of events are shown in Table 9. The uncertainties on these yields are relatively large and difficult to quantify. Although they are based on the observed Run I event yields, the expected improvement factors in tagging efficiency are based on extrapolations and detector simulations. However, they do form a relatively concrete basis on which to estimate the impact that the Run II data samples will have on top physics.
I have included in this table the predicted yields of the jet samples as well. With the given signal event yields, we are in a regime where the control of systematic uncertainties arising from detector effects and background uncertainties becomes essential to further improve the physics measurements. The jets data provides one of the key calibration samples as it constrains the theoretical models used to characterise the jets background to top production.
I will conservatively assume an integrated luminosity for Run II of 1 fb-1 for the following discussion, although many of the results will scale in a straight-forward manner with the assumed size of the data sample.
| Channel | 1 fb-1 | 10 fb-1 |
|---|---|---|
| Tagged jets | 600 | 6000 |
| Double tagged jets | 300 | 3000 |
| Tagged Dilepton events | 100 | 1000 |
| jet events | 200 | 2000 |
9.2.2 Run II Top Quark Cross Section
A more precise measurement of the top quark cross section is a good test of our understanding of perturbative QCD calculations. In addition, various extensions of the standard model predict that this cross section would be enhanced and therefore could be an indication of “new” physics.
The current uncertainties in are dominated by the low statistics in the dilepton and lepton+jets signal samples. For Run II, these statistical uncertainties are expected to fall to of order 5% or better. The systematic uncertainties will therefore limit the measurement as these are currently at the level of 30-40%. However, it is possible to control most of these uncertainties as they arise from tagging efficiencies, the background estimates and the integrated luminosity measurements. For example, the tagging efficiencies can be obtained directly from the data using the rate of single to double-tagged lepton+jet events. I therefore expect these uncertainties to scale with the integrated luminosity.
I believe the systematic uncertainties will be limited, in fact, by how well we can measure the integrated luminosity in Run II. It is not clear that we will be able to determine this quantity to better than of order 3%, and I would therefore argue that this sets the “floor” on the systematic uncertainties on any absolute cross section measurements. If we expect that the other systematic uncertainies then scale with the number of observed candidate events, this implies an overall systematic uncertainty of %.
With this assumption, the overall uncertainty in the cross section measurement could be of order 9%, which is considerably less than the current uncertainties of 15-20% on the standard model predictions.
9.2.3 Top Mass Measurement
We can conservatively estimate how well we can measure the top quark mass in Run II by extrapolating the uncertainties on the Run I mass measurements using the jet sample.
Monte Carlo calculations have shown that the statistical uncertainty on will scale as expected like , where is the observed number of events in the sample. This assumes that the relative background rates will remain the same, a reasonable hypothesis since they are dominated by the intrinisic physics rates and not instrumentation effects. One therefore can expect a statistical uncertainty on of .
The control of the systematic uncertainties becomes the single most important aspect of this measurement. The largest source of systematic uncertainty relates to the measurement of the jet energies of the quarks and quarks from the boson hadronic decays. Perhaps the most fundamental calibration tool is the observed signal in the dijet invariant mass distribution. However, independent calibrations can be performed by studying the balancing of observed energies in jet and jet events. With these studies, one can reasonably expect to reduce the systematic uncertainties arising from jet energy scales to of order 5 GeV in the Run I data set. Since this calibration is driven by the size of the jet and jet samples, one can assume that this uncertainty will scale statistically, resulting in a contribution to the systematic uncertainty of 1-2 .
The other uncertainties that effect the current mass measurement together total 6-7 and should also scale statistically. Note that the largest contributions come form the understanding of the background shapes and the biases introduced by the tagging techniques. We would therefore predict that these would reduce to of 1.5-2.0 in a 1 fb-1 data sample. If we combine these together in quadrature, we arrive at a top quark mass systematic uncertainty of approximately 2.5 , which is still larger than the expected statistical uncertainty. Further reductions in the systematic uncertainty are possible by, for example, using the double-tagged samples instead of just the single-tagged events. These data have an intrinsically better top quark mass resolution due to the reduced combinatorial background, and have a much smaller background due to the requirement of the second tag.
Even without these expected improvements, the top quark mass uncertainty will be , when we combine both systematic and statistical uncertainties in quadrature. With the expected improvement in the boson mass measurement in Run II, we will have a very powerful test of the consistency of the standard model. This is illustrated in Fig. 21, where we plot the expected top quark mass versus the boson mass for various Higgs boson masses.
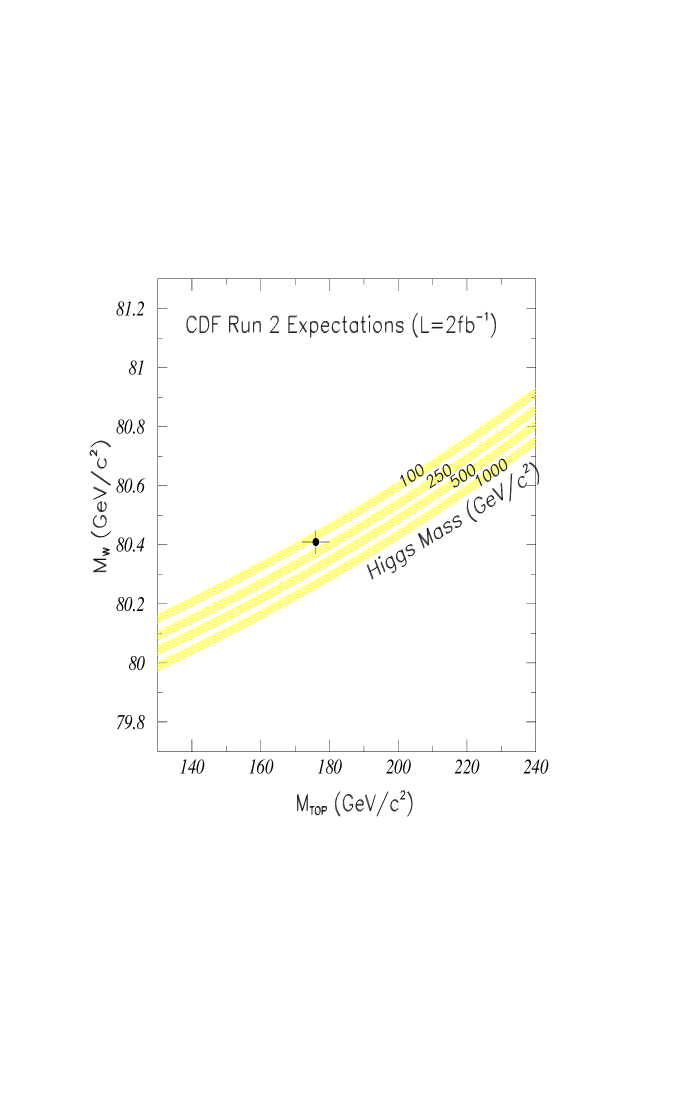
9.2.4 Top Quark Decays
The top quark branching fraction for the decay are most directly measured using the rates of tagged quarks in both the lepton+jets and dilepton channels. The current statistical uncertainties on is set by the % uncertainty on the rate of tagged jet events. This uncertainly will scale as , where is the number of tagged events. Thus, given the extrapolated event yields, we can expect the statistical uncertainties on the tagging rates in the lepton+jets and dilepton samples to fall to of order % and %, respectively.
The systematic uncertainties in these tagging rates are dominated by the uncertainty in the tagging efficiency . In Run II, each experiment will have on the order of meson semileptonic decays that will provide a high statistics sample of relatively pure decays that can be used to study the efficiencies of the various tagging techniques. With such large control samples, it is reasonable to expect that the systematic uncertainty on will scale with integrated luminosity.
With these assumptions, a simple Monte Carlo calculation predicts that one should be able to measure the branching fraction with a precision of %. As noted earlier, however, the constraint this places on depends on the values that and can take on. If we assume the same range of values as given in Eq. 18, a Monte Carlo calculation combining both the lepton+jets and dilepton tagging fractions would allow us to constrain at 90% CL. This constraint should also scale with luminosity so it will continue to improve with additional data. Although this limit is not as stringent as that obtained if one assumes unitarity of the CKM matrix, it is an important test of the assumption that only 3 quark generations couple to the electroweak force.
With the larger Run II statistics, it will also be possible to make more precise measurements of the detailed structure of the vertex. For example, the - nature of the current involved in the decay predicts that the decay will result in bosons that are longitudinally polarised. One will be able to extract this helicity information from the angular distribution of the charged or neutral lepton helicity angle measured in the lab frame.[32] Monte Carlo studies[37] indicate that this fraction can be measured to of order 3% or better. This will make this a good test of the nature of the charged current decay. Any anomolous couplings are likely to become evident on the basis of this measurement.
Searches for anomolous top quark decays will also be possible. For example, assuming that the final state is not background limited, then a naïve calculation can be made assuming approximately 50% detection efficiency for the from the decay or . The efficiency for detecting the +jet final state relative to the 3 jet final state resulting from the decay would be . With the expected lepton+jet event yields, we would be sensitive to as small as 0.3%. Limits on decays mediated by bosons would suffer by a factor of due to the necessary requirement of a dilepton decay of the boson. These assume that the final states are not background limited at this sensitivity, an assumption that is difficult to test with the current data samples.
9.2.5 New Physics Searches
The search for new physics will continue at the Tevatron Collider during Run II, and the sensitivity of the system will only continue to improve with the increased event yields.
As one example of this, I show in Fig. 22 the expected invariant mass distribution after 1 fb-1 of running, assuming the existence of a boson with a mass of 800 . A clear signal is visible over the standard model prediction. One would be able to exclude the existence of such an object up to masses of order 1 during Run II.

There are other speculations about new physics that will be addressed by studies of top production in Run II. The production of single top quarks via the process is a direct way of measuring the partial width and searching for anomolous couplings between the top quark and the electroweak bosons.
These are only an example of the topics that will be addressed, but they demonstrate that the Tevatron during Run II will continue to be an exciting place to study top quark phenomenology.
9.3 LHC Studies
There have been many comprehensive studies performed of the potential for top quark physics at the much higher centre-of-mass energy afforded by the LHC. However, most of these studies are now dated as they were completed prior to the discovery of top. Not only does our current understanding of the properties of the top quark (most notably its mass) make many of these studies irrelevant, both the D0/ and CDF collaborations have taken enormous steps forward in understanding how to select and study candidate events in a hadron collider environment and these are not reflected in the previous studies.
For example, the earlier SSC and LHC studies [38] had concluded that a precise measurement of the top quark mass would be difficult given the large combinatorial backgrounds and the difficulty of performing a reliable jet energy calibration. These studies had concluded that top quark mass measurements with a precision of order 2-3 were possible with very large data samples. We now expect to acheive this level of precision at the Tevatron with the Run II data samples.
However, I note that the LHC will produce pairs at an enormous rate. Even at a luminosity of , the LHC will be producing of order 6000 pairs per day. Roughly speaking, an LHC experiment will be able to collect the same number of top events in one full day of running that would require a year’s worth of data collection at the Tevatron. This will give an LHC experiment an enormous advantage in statistical power over the comparable Tevatron study. It is therefore reasonable to expect that most of the studies that I have discussed here will become very quickly systematics limited.
As a concrete example of this, the uncertainty in the top quark mass measurement will still be dominated by the systematic uncertainties in establishing the calorimeter energy scale. Although the in situ calibration of the calorimeter using the observed invariant mass distribution will provide a good calibration signal, the calibration of the jet energy scales may become one of the limiting factors. Uncertainties arising from the additional “gluon” jets in the events will also remain, though they can be reduced by requiring, for example, two tags and only considering lepton+4 jet events. The ultimate precision of an LHC mass measurement is difficult to quantify, but it is reasonable to expect that it can be reduced to of order 1 or perhaps less. At this level, the top quark mass is no longer expected to be the limiting factor in testing the consistency of the standard model.
The very large statistics samples available at the LHC make it possible to search for rare top quark decays. However, such a search will only be possible if the rare decay mode yields a sufficiently unique signature. For example, a signal for the rare decay may ultimately be limited by the standard model process where the associated produced partons are or quark candidates. One can expect that the sensitivity of an LHC study will be at least an order of magnitude better than the corresponding Tevatron limit, but this is purely speculation as a detailed study taking into account potential backgrounds and signal efficiencies has not been performed.
10 Conclusions
The hadron collider environment has proved to be quite successful in discovering the top quark and beginning to elucidate its properties. However, these initial Tevatron studies of the top quark are currently statistics limited. Both the D0/ and CDF collaborations have now completed data collection for Run I and have event samples with sensitivities of approximately 100 . With these data, both collaborations will be able to improve the statistical uncertainties on the top quark cross section and mass, and they are currently involved in additional studies that will reduce the systematic uncertainties in these measurements.
The CDF and D0/ collaborations’ preliminary estimates of the top quark mass, (CDF) and (D0/), make it the heaviest known fermion in the standard model. The observed rate of events is consistent with standard model predictions, and make it the rarest phenomena observed in proton-antiproton annihilations. The very preliminary studies of top quark production and decay properties have yielded results that are consistent with the standard model predictions. However, additional analyses are underway and results from the full Run I data set will yield further insights on the properties of this unique fermion. Because of the massiveness of this fermion, it will be a unique probe into the physics of the standard model and what lies beyond this theory.
The Tevatron will continue to have a monopoly on direct studies for the next eight years. Run II, starting in 1999, will provide samples at least 20 times larger than those available in Run I, and will allow the first “high statistics” studies of the top quark. However, the LHC will be the ultimate hadron collider for top quark studies, as most of the standard model measurements will rapidly become systematics limited at this machine. In all, the future of top quark studies at hadron colliders looks very promising indeed.
Acknowlegements
I would like to thank the members of the D0/ and CDF collaborations who kindly provided me with details of their respective analyses. I note that the research reported here would not have been successful without the excellent support of the staff of the Fermilab National Accelerator Laboratory and the institutions involved in this research. I would also like to acknowledge the organisers of the SLAC Summer Institute for their success in arranging such a stimulating and enjoyable meeting.
Support for this work from the National Sciences and Engineering Research Council of Canada is gratefully acknowledged.
References
-
[1]
S. L. Glashow, Nucl. Phys. 22, 579 (1961);
S. Weinberg, Phys. Rev. Lett. 19, 1264 (1967);
A. Salam, in Elementary Particle Theory, edited by N. Svartholm (Almquist and Wiksells, Stockholm, 1968), p. 367. - [2] S. W. Herb et al., Phys. Rev. Lett. 39, 352 (1977).
-
[3]
D. Buskulic et al. (ALEPH Collaboration), Phys. Lett. B335, 99 (1994);
M. Acciari et al. (L3 Collaboration), Phys. Lett. B335, 542 (1994);
P. Abreu et al. (DELPHI Collaboration), Z. Phys. C65, 569 (1995);
G. Alexander et al. (OPAL Collaboration), CERN-PPE/95-179 (1995). - [4] R. Ammar et al. (CLEO Collaboration), Phys. Rev. D49, 5701 (1994).
- [5] Review of Particle Properties, Phys. Rev. D50, 1304 (1994).
-
[6]
D. Decamp et al. (ALEPH Collaboration),
Phys. Lett. B236, 511 (1990);
O. Adriani et al. (L3 Collaboration), Phys. Lett. B313, 326 (1993);
P. Abreu et al. (DELPHI Collaboration), Phys. Lett. B242, 536 (1990);
M. Z. Akrawy et al. (OPAL Collaboration), Phys. Lett. B236, 364 (1990);
G. S. Abrams et al. (MARK II Collaboration), Phys. Rev. Lett. 63, 2447 (1989);
I. Adachi et al. (TOPAZ Collaboration), Phys. Lett. B229, 427 (1989);
S. Eno et al. (AMY Collaboration), Phys. Rev. Lett. 63, 1910 (1989);
H. Yoshida et al. (VENUS Collaboration), Phys. Lett. B198, 570 (1987). -
[7]
F. Abe et al. (CDF Collaboration), Phys. Rev. Lett. 74,
341 (1995);
F. Abe et al. (CDF Collaboration), Phys. Rev. Lett. 73, 220 (1994);
C. Albajar et al. (UA1 Collaboration), Phys. Lett. B253, 503 (1991);
J. Alitti et al. (UA2 Collaboration), Phys. Lett. B276, 365 (1991). - [8] J. F. Gunion, H. E. Haber, G. Kane and S. Dawson, The Higgs Hunter’s Guide (Addison-Wesley, New York, 1990); S. L. Glashow and E. E. Jenkins, Phys. Lett. B196, 233 (1987).
- [9] F. Abe et al. (CDF Collaboration), Phys. Rev. Lett. 73, 2667 (1994).
- [10] S. Abachi et al. (D0/ Collaboration), Phys. Rev. Lett. 72, 2138 (1994).
-
[11]
F. Abe et al. (CDF Collaboration), Phys. Rev. Lett. 73,
225 (1994);
Phys. Rev. D50, 2966 (1994). -
[12]
F. Abe et al. (CDF Collaboration), Phys. Rev. Lett. 74, 2626 (1995);
S. Abachi et al. (D0/ Collaboration), Phys.Rev. Lett. 74, 2632 (1995). -
[13]
D. O. Carlson and C.-P. Yuan, Phys. Lett. B306, 386 (1993);
T. Stelzer and S. Willenbrock, “Single Top Quark Production via ,” DTP/95/40, ILL-(TH)-95-30 (1995). -
[14]
P. Nason, S. Dawson and R. K. Ellis, Nucl. Phys. B303, 607 (1988);
W. Beenakker, H. Kuijf and W. L. van Nerven, Phys. Rev. D40, 54 (1989);
G. Altarelli, M. Diemoz, G. Martinelli and P. Nason, Nucl. Phys. B308, 724 (1988). -
[15]
E. Laenen, J. Smith and W. L. van Neerven, Nucl. Phys. B369,
543 (1992);
E. Laenen, J. Smith and W. L. van Neerven, Phys. Lett. B321, 254 (1994). - [16] E. Berger and H. Contopanagos, Phys. Lett. B361, 115 (1995); S. Catani, M. L. Mangano, P. Nason and L. Trentadue, “The Top Cross Section in Hadronic Collisions,” CERN-TH/96-21 (1996).
- [17] S. Frixione, M. Mangano, P. Nason and G. Ridolfi, Phys. Lett. B351, 555 (1995).
- [18] See, for example, P. Azzi, invited talk at XXXIst rencontres de Moriond (QCD session), March 23-30, 1996, CDF/PUB/TOP/PUBLIC/3679 (1996).
- [19] F. A. Berends, W. T. Giele, H. Kuijf and B. Tausk, Nucl. Phys. B357, 32 (1991).
- [20] F. Abe et al. (CDF Collaboration), Phys. Rev. Lett. 70, 4042 (1993).
- [21] S. Abachi et al. (D0/ Collaboration), Nucl. Instrum. Methods A350, 73 (1994).
- [22] F. Abe et al. (CDF Collaboration), Nucl. Instrum. Methods Phys. Res. A 271, 387 (1988).
-
[23]
Details of the CDF and D0/ jet cluster algorithms are provided
in:
F. Abe et al. (CDF Collaboration), Phys. Rev. D45, 1448 (1992).
S. Abachi et al. (D0/ Collaboration), FERMILAB-PUB-95-020-E, July 1995, submitted to Phys. Rev. D. - [24] F. Abe et al. (CDF Collaboration), FERMILAB-PUB-95-149-E, June 1995. Submitted to Phys. Rev. Lett.
- [25] See, for example, V. D. Barger and R. J. N. Phillips, “Collider Physics,” Addison-Wesley Publishing Co. (1987), p. 281.
- [26] Review of Particle Properties, L. Montanet et al., Phys. Rev. D50, 1278 (1994).
- [27] F. Paige and S. D. Protopopescu, BNL Report No. 38034, 1986 (unpublished).
- [28] F. Abe et al. (CDF Collaboration), Phys. Rev. Lett. 68, 447 (1992); Phys. Rev. D45, 3921 (1992).
- [29] Review of Particle Properties, L. Montanet et al., Phys. Rev. D50, 1229 (1994).
- [30] Review of Particle Properties, L. Montanet et al., Phys. Rev. D50, 1315 (1994).
- [31] H. Fritzsch, Phys. Lett. B224, 423 (1989).
-
[32]
G. Kane, C.-P. Yuan and G. Ladinsky, Phys. Rev. D 45, 124 (1992);
M. Jezabek and J. H. Kuhn, Phys. Lett. B329, 317 (1994). - [33] F. Abe et al. (CDF Collaboration), Phys. Rev. Lett. 74, 1936 (1995).
- [34] F. Abe et al. (CDF Collaboration), Phys. Rev. Lett. 74, 1942 (1995).
- [35] C. T. Hill, Phys. Lett. B345, 483 (1995).
- [36] See, for example, B. Holdom and M. V. Ramana, Phys. Lett. B353, 295 (1995).
- [37] D. Amidei et al., “The TeV2000 Report: Top Physics at the Tevatron,” CDF/DOC/TOP/PUBLIC/3265 and D0/ Note 2653, 1996 (unpublished).
-
[38]
See, for example, D. Froidevaux, “Top Quark Physics at LHC/SSC,”
CERN/PPE/93-148, published in ’93 Electroweak Interactions
and Unified Theories, Ed. J. Tran Thanh Van, Editions Frontieres
(1993) 509-526;
W. W. Armstrong et al. (ATLAS Collaboration), “ATLAS Technical Proposal,” CERN/LHCC/94-43 (1994);
D. Denegri et al. (CMS Collaboration), CERN-PPE-95-183 (1995);
E. L. Berger et al. (SDC Collaboration), “SDC Technical Design Report,” SDC-92-201 (1992).