A Compact Gas Čerenkov Detector with Novel Optics
Abstract
We discuss the design and performance of a threshold Čerenkov counter for identification of charged hadrons. The radiator is pressurized gas, which is contained in thin-walled cylindrical modules. A mirror system of novel design transports Čerenkov photons to photomultiplier tubes. This system is compact, contains relatively little material, and has a large fraction of active volume. A prototype of a module designed for the proposed CLEO III detector has been studied using cosmic rays. Results from these studies show good agreement with a detailed Monte Carlo simulation of the module and indicate that it should achieve separation of pions and kaons at the 2.5-3.0 level in the momentum range 0.8-2.8 GeV/c. We predict performance for specific physics analyses using a GEANT-based simulation package.
I Introduction
The identification of stable charged hadrons at momenta above 1 GeV/c is difficult to accomplish, particularly in a colliding beam environment where spatial limitations constrain detector design. This problem has received increased attention in the past few years in the context of flavor-dependent processes (e.g. violation) in decays of mesons, where pions and kaons must be identified with high efficiency and accuracy. To study such processes in collisions at the (4S) resonance will require devices which can provide identification for particles with momenta up to GeV/c.
Presented here is a design for a particle identification (PID) device based on the Čerenkov effect, working mainly in the threshold mode with a radiator of pressurized gas. The detector concept is generally applicable in situations with moderately high rates and low particle multiplicities. It has been applied here to the proposed CLEO III detector[1], an upgrade to the CLEO II detector at the Cornell Electron Storage Ring, and some of the detector parameters reflect our accommodation of constraints imposed by the existing system. Specifically, the radial gap available for a PID device was fixed at 20 cm, between the main tracking chamber (at a radius of 82 cm) and the calorimeter. In addition, it was prescribed that the PID device should comprise no more than 0.12 radiation lengths of material, so as to have a minimal impact on the performance of the CsI calorimeter. We first discuss the overall approach used to arrive at a design, including development of components and tests needed to establish validity. A description of a working prototype and tests with cosmic rays follows. Finally, results from these tests are used to tune a Monte Carlo simulation, which is then used to evaluate the performance of a full-scale system in the proposed CLEO III detector[1] for physics analyses in symmetric collisions in the region (10 GeV).
II Detector Design
A threshold Čerenkov counter has several advantages over other PID devices. Its readout can be simple and the number of channels few. The response time is intrinsically fast, and timing and pulse height calibration requirements are minimal. These features make the offline software requirements rather simple. Furthermore, such a device may be included in the trigger.
Design considerations are dominated by the need to maximize photon detection efficiencies, because the absolute number of photons produced by Čerenkov radiation is relatively small. It is also desirable to restrict the material thickness of the detector and to minimize inactive volume within the central region. Other considerations include ability to operate in high magnetic fields, robustness, cost, and personnel requirements.
As is described below, the index of refraction required for the desired threshold limits the choice of radiator to pressurized gases or silica Aerogel [2]. We pursued the possibility of pressurized gas because it has better transparency, particularly at shorter wavelengths, where the Čerenkov spectrum is concentrated. Another advantage of gas is that there is some flexibility to vary the threshold through adjustments of the gas pressure. The high transparency enables the design of a long cylindrical detector module, in which radiated light is transported up to 2 meters before being detected. The modules may thus be arranged to span the central solid angle of a collider detector, and are sufficiently large that the number of readout channels required is small, of order 100. This system can be made conservatively, relying only on readily available components and proven technologies. More specific aspects of the design are discussed below.
A Radiator
In many detector systems, and specifically in this case, hadrons with momenta below 0.8 GeV/c are readily identified through measurements of specific ionization (dE/dx) in tracking devices, so that the desired range of operation for an additional PID device is in the region above 0.8 GeV/c. To provide good identification at 0.8 GeV/c we select an index , which places the pion threshold at 0.70 GeV/c. The kaon threshold for this index is 2.45 GeV/c, which is near the kinematic limit for products of decay in the rest frame of (4S) events.
For Čerenkov photons to be detected, the radiator must transmit them, and the photodetector must be sensitive to them. For a system sensitive to photons with energies between and (in eV), a particle traveling with speed a distance (in cm) through a medium with refractive index produces
| (1) |
detectable photons, where is the Čerenkov angle. The most effective device for detection of individual photons is still the conventional photomultiplier tube, which maintains a high quantum efficiency for wavelengths below 600 nm and may detect photons with wavelengths below 200 nm if the window is made of a medium transparent to them, such as quartz. Sensitivity to shorter wavelengths is desirable, as the Čerenkov spectrum is more concentrated in that region. However, because many common impurities absorb strongly at wavelengths below 200 nm, the practical range for detection is 200-600 nm (2.1-6.2 eV). In this range, in a material with index , 1 GeV/c pions radiate 30 Čerenkov photons/cm, while 2.8 GeV/c pions radiate 60 photons/cm. If the detector system is able to count the number of photons, some separation of pions and kaons can be maintained even above the kaon threshold; only 11 photons/cm are emitted by 2.8 GeV/c kaons. Thus, pions and kaons at momenta in the range 0.8-2.8 GeV/c produce Čerenkov signals which should be readily distinguishable from each other.
The selection of Čerenkov gases at our chosen index is limited, as many either liquefy under pressure at room temperature before reaching the target index or require undesirably high pressures. Sulfur Hexafluoride (SF6) satisfies our criteria. At an absolute pressure of 20 atmospheres, its room-temperature index of refraction is . Its inertness, non-flammability, and previous use as radiator [3, 4] make it an attractive candidate for this application. Ethane (C2H6) is an alternative which reaches the same index at somewhat higher pressure but has a longer radiation length. The higher pressure required, in combination with its flammability, dissuaded us from pursuing ethane for this design.
For pathlengths up to 1 atmm (1 m pathlength at 1 atm), SF6 is known to have excellent transparency to light with wavelengths above 190 nm[4]. However, because this application requires good transparency over a pathlength of 20 atmm, we performed an independent measurement using a McPherson 218 0.3 m scanning monochromator illuminated by a deuterium lamp. The monochromator was made to scan through wavelengths from 200 nm to 350 nm. The resulting beam traversed 1 meter of gas contained in a pressure vessel with sapphire end windows and was detected in an EMI-Gencom RFI/B-214 solar-blind photomultiplier tube. The anode current of the photomultiplier, which is proportional to the intensity of the transmitted light, was converted to a DC voltage by a Keithley 440 picoammeter, digitized by an AR-B3001 ADC plug-in card (Acrosser Technologies, Inc.), and read out at 0.25 nm intervals. The wavelength scanning and data acquisition of this system were controlled by a personal computer (IBM AT286 equivalent).
Two grades of SF6 were studied, instrument (99.99% pure) and ultra-pure (99.996%). As a baseline reference we used ultra-pure nitrogen (99.9999%), which has a transparency comparable to vacuum. For a pathlength of 1 atmm, both grades of SF6 were found to be as transparent as nitrogen above 200 nm, in agreement with [4]. Each gas scan was therefore normalized to its own 1 atm baseline rather than to nitrogen, reducing substantially the systematic error from variables such as changes in alignment between gas fills or drifting of electronic calibrations over time.
The gas vessel was initially filled with SF6 at the maximum pressure delivered by the cylinder (20 atm) and allowed to stabilize [5]. Scans were then taken at different pressures by releasing gas successively until the ambient pressure was reached, at which point a scan was taken to act as the baseline for that set of measurements. The resulting transmission efficiencies as a function of wavelength are shown in Figure 1. 20 atmm of both instrument and ultrapure SF6 were found to have transparencies comparable to 1 atmm nitrogen, down to 320 nm. However, at shorter wavelengths, the instrument grade is more transparent than the ultra-pure, confirming the results in [6]. More than 90% of light down to 240 nm is transmitted by the instrument grade, dropping to 72% by 200 nm as Rayleigh scattering becomes more prevalent. Although it is not known to this group why the lower purity gives better performance, it has the fortuitous result of greatly reducing the cost of the gas needed for this detector.
B Pressure module
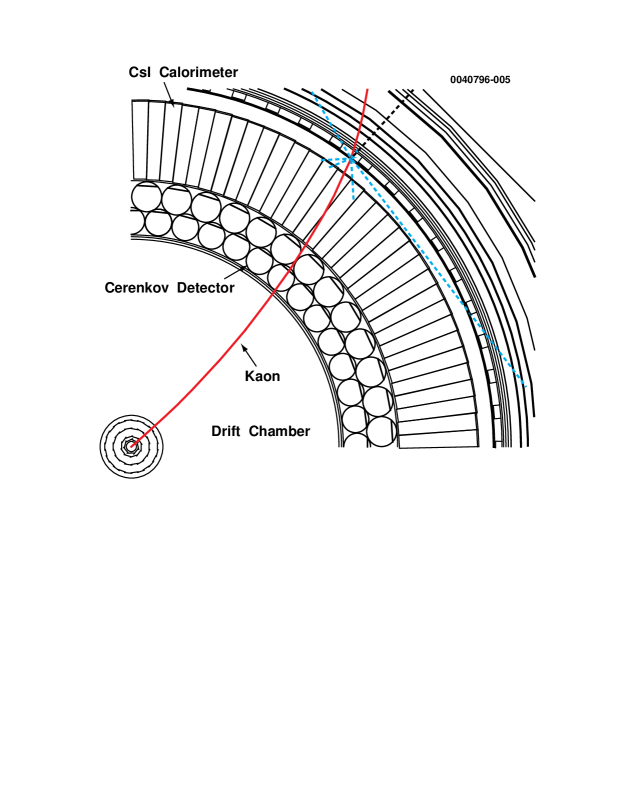
The pressure vessel is designed with a cylindrical shape to insure the required mechanical strength with minimum wall thickness. Within each module, photons are transported via reflections off mirrored surfaces to the tube ends, where they enter a transparent window and are collected by photomultipliers. The vessel itself should be composed of a strong, low- material to minimize the number of radiation lengths of material penetrated by particles.
In designing a device for CLEO III we envision modules with 10 cm diameter and 2 m length. Two close packed layers, arranged in a barrel, surround the interaction point just outside the central tracking chamber (Figure 2). An economical option for the tube material is aluminum. A 0.1 cm wall thickness is within the limits prescribed for CLEO III and is adequate from the point of view of safety. The hoop stress for this design is about 1 Pa, while Al tubes of grade 7075-T6 will maintain their strength to about 5 Pa, providing a five-fold safety factor. Other materials considered include carbon fiber and beryllium. These could reduce the material thickness but were not studied fully.
C Optics
The relatively small diameter and long transport distance of the envisioned module place severe constraints on the optical design. To obtain good collection efficiency, photons should experience no more than 4-5 reflections before reaching the photomultiplier, as reflectivities in the ultraviolet region can be expected to be at best. The simple option of placing a smooth cylindrical reflecting liner in the pressure vessel works remarkably well for tracks which are moderately angled toward the tube ends, at polar angles of 65∘ or less (). We used a mylar sheet, 0.076 mm thick and coated with a thin film of Al and a MgF2 overcoating[7], which was rolled and placed inside the tube. Measurements on one sample indicate that its reflectivity at normal incidence ranges from 76–80% at 200 nm to approximately 90% at 600 nm.
For tracks in the central region, at polar angles of 65∘ to 115∘, the simple cylindrical mirror does not transport sufficient light. Monte Carlo simulations show that the efficiency for transporting photons to either end of the tube drops from 30% at 65∘ to zero at 90∘. To improve this situation we have developed a specialized reflector for the central region. It is designed to redirect a large fraction of the photons such that they exit the region before encountering another mirror surface and are then able to reach the end of the module with just one or two additional reflections. This reflector has a faceted surface with a sawtooth-shaped cross section (Figure 3). Each facet is a planar strip with a width of order 1 mm [8], oriented such that an incoming photon produced by a particle from the interaction point is reflected toward the end of the tube, as shown in Figure 4. This faceted mirror system extends parallel to the beam line, 0.61 m to either side of the interaction point ( m to m), is about 5 cm wide, and faces the beam line.
The optimal combination of facet orientations varies with the polar angle of the incident particle. Our design incorporates ten different mirror sections, each with area cm2 and a different combination of angles (Table I). The facets reflecting photons toward the nearer phototube make an angle with respect to the axis, while those reflecting photons toward the more distant PMT make an angle , as shown in Figure 3. The optimal values of and as a function of depend on the tube length, its radius, the perpendicular distance to the interaction point, and the reflectivity as a function of wavelength. A Monte Carlo simulation was used to find a set of discrete angles for the ten sections spanning m 0.61 m.
Once a photon reaches the end of the tube, it may need to be funneled to a smaller area in order to be delivered to a photocathode; affordable PMT’s have typical photocathode diameters of 3.8 or 6.4 cm. In addition, a PMT cannot survive a high pressure environment, and must therefore be located outside the pressure vessel. The light is delivered to the PMT through a quartz window which serves as pressure barrier, UV-transparent window, and light funnel. For this test the window was made of Corning excimer grade quartz, in the shape of a simple truncated cone, with an inner face slightly smaller than the diameter of the tube (9.7 cm), an outer face matching the photocathode (6.4 cm diameter), and a thickness of 3.8 cm. The conical side wall was coated with aluminum. This window works in two ways: because of the change in index of refraction, rays that come in at large angles of incidence refract to smaller angles, thereby aligning their trajectories more parallel to the axis of the tube; secondly, many of the photons striking the mirrored conical wall are directed into the PMT. Monte Carlo studies of photon transport predict that such a window is about 65% efficient in transmitting photons from the inner face of the window to the photocathode.
To minimize transmission loss, the windows of the pressure module and the PMT must be coupled to each other by an index matching fluid. Using the monochromator apparatus described in section II A, we compared transmission of light through the window with and without each of four recommended coupling greases, General Electric Viscasil, Oken 626A, Dow Corning Q2-3067, and Shinetsu. Of the four, only the General Electric Viscasil performed well. It improved transmission through the window down to 220 nm and gave diminishing efficiency at lower wavelengths, dropping to 80% at 200 nm. The other three did not transmit light efficiently below 270nm (less than 40% transmission).
D Photomultipier
In many experimental configurations, the PID detector is located in a strong magnetic field. In such cases, conventional photomultiplier tubes cannot function, and it is necessary to use a specialized photodetector which is able to operate in such an environment. We tested one such PMT, a Hamamatsu R3386 “fine mesh” tube [9], to evaluate its suitability for this application.
For our Čerenkov detector the primary concern is resolution, particularly at low light levels; loss of gain may in principle be recovered with additional amplifiers. Signal resolution in conventional PMT’s is determined mainly by photoelectron counting statistics, as well as the quantum efficiency of the photocathode. In fine mesh tubes the resolution is complicated because the dynodes are partially transparent (50%), yielding anomalously shaped distributions at low intensities. In fact, a single photoelectron signal will not show a well-defined peak, due to this partial transparency[10].
To evaluate the Hamamatsu R3386, we set up a test system to deliver calibrated light pulses to the PMT and then to measure the gain and resolution of the output. A BNC light pulser was used to deliver up to several hundred photons, and pulse height spectra were recorded using a LeCroy qVt and a Canberra multichannel analyzer. The light output of the pulser was calibrated using a Hamamatsu R2059 “photon counting” photomultiplier tube. The fractional width of the R2059 was found to be (, where is the number of photoelectrons, in agreement with expectations for a “photon counting” PMT.
The gain and resolution of the R3386 were then measured in and out of the CLEO II solenoid’s 1.5 Tesla magnetic field. For this test the axis of the PMT was oriented parallel to the field. The high voltage on the R3386 was varied in the range 1200-2000 V at 0 T, and 2500-2700 V at 1.5 T, such that all measurements could be carried out within the same range of signal heights. The gains and widths at 0 T were extrapolated to the higher voltage region for comparison with the data at 1.5 T. Separate measurements in 0 T at the higher voltages were used to confirm that the extrapolations were reasonable. For signals of three or more photoelectrons delivered to the R3386 in the absence of a magnetic field, a clear peak was visible. The fractional width of the signal was found to be equal to . In the 1.5 T field the gain was found to be reduced by a factor of . This corresponds to a mean loss of 31% in multiplication at each of the sixteen stages of the R3386. The width of the signal was measured to be . The responses to a mean signal of 10 photoelectrons are shown in Figure 5 for magnetic fields of 0 T and 1.5 T.
We conclude that the R3386 is suitable for use in our detector but that it is important to take into account the broadening of the signal distribution in predicting identification efficiencies. In our detector simulation the photomultiplier was modeled by broadening the delivered photon signal by 35%. This is somewhat wider than what we have observed, and should therefore give a conservative assessment of feasibility for this detector.
E Electronics
The electronics to read out this detector needs to satisfy only modest demands. The number of channels is low, 200 or less, so that cost is not an issue. Resolutions of ns on timing and 5% on pulse height are adequate, and the required dynamic range is three decades.
If the system is to operate in a high magnetic field, preamplification of the phototube signal is required, as the gain of the fine mesh PMT may be as low as . For a gain of , a single photoelectron will result in signal charge of 1.6 fC on the anode. If this charge is spread over 5 ns, it gives a current amplitude of 0.32A. A preamplifier gain of 30 mV/A is needed to translate this into a 10 mV signal. The noise at the output should be less than 1 mV. These criteria are nearly satisfied by the LeCroy TRA4402, which provides a gain of 25 mV/A with an input noise 65 nA RMS (1.6 mV at the output). There are other amplifiers which have input noise current more than a factor of 3 lower than this [11], which should easily meet the requirements.
III Prototype Tests
A Optics
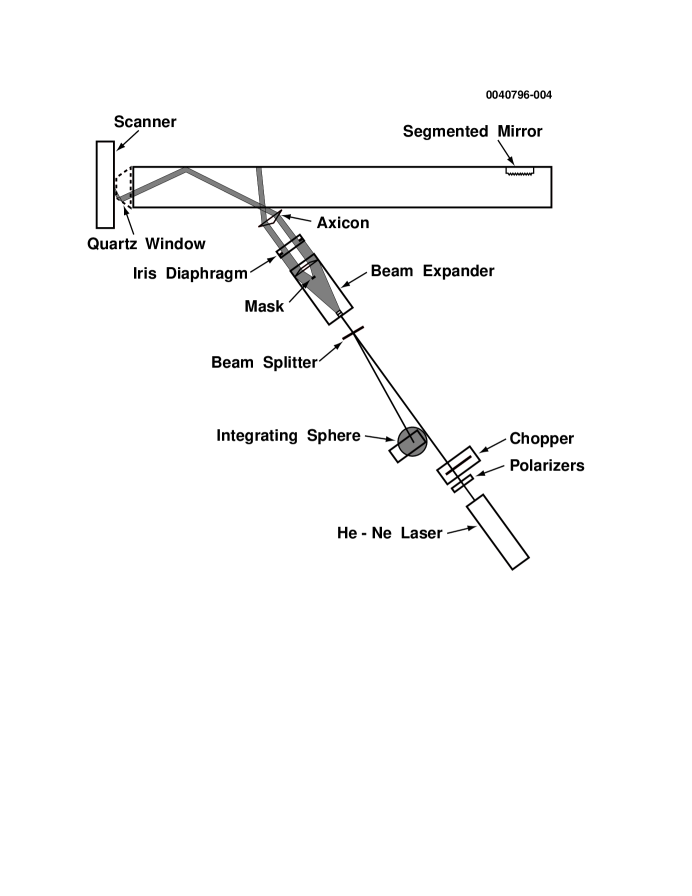
To explore the design parameters and to verify the simulation of this complicated optical system, we set up a model of a tubular module with a laser configured to simulate Čerenkov radiation. The model tube was half length, 10 cm in diameter, and lined with aluminized Mylar D-1 overcoated with MgF2[7]. The simulated radiation, an annular “cone” of laser light, entered the tube through one of several ports along its length. The light was produced with an opening angle of 7.9∘, to simulate the radiation from a 1 GeV/c pion.
To produce the conical distribution, the monochromatic beam from a green HeNe laser was first transported through a beam expander with adjustable mask and iris diaphragm to generate an annular beam of parallel rays. This beam was then directed onto an axicon, which transformed the beam into an annular cone of light. The location for the origin of the simulated radiation was adjusted by varying the mask position in the beam expander, and the path length over which the radiation was emitted was set by the iris diaphragm. This radiation pattern differed from real Čerenkov light in two ways: it did not have the correct spectral distribution or polarization. A schematic of the beam and apparatus is shown in Figure 6.
One end of the tube was equipped with an array of photodiodes attached to a movable stage that could scan the entire area of the end of the tube. The source intensity was measured by shining the cone directly onto the photodiode array. The transport efficiency is then the ratio of light intensity detected at the end of the tube to the intensity of the source. To correct for temporal fluctuations in laser power, a fraction of the beam was extracted via a pellicle beam splitter and monitored during all measurements. To measure its intensity in a manner insensitive to spatial fluctuations, the extracted beam was directed into an integrating sphere, where it was diffusely scattered from an inner wall coated with highly reflective white paint and detected in a photodiode placed out of the beam’s path.
In our first test, we injected the simulated Čerenkov light at several angles, each at the position along the tube corresponding to that expected from particles in an actual colliding beam experiment. A 3.0 cm thick plain quartz disk was placed before the detector array to simulate a thick transparent endplate. The light intensity was measured over the entire cross section of the tube, and the results were compared to expectations from the simulation. The measured transport efficiency as a function of angle is shown in Figure 7, with predictions calculated by the same Monte Carlo simulation used to design the faceted mirror. The agreement between the measured and simulated efficiencies is excellent. It varies from zero for a polar angle of 90∘ to 88% for incidence at 43∘, positions corresponding to the center and end of the tube, respectively.
In a detector module the efficiency is further reduced by the fact that even the larger PMT photocathode (6.4 cm diameter) covers only 40% of the total cross sectional area of the tube. Thus, with a plain window and the large photocathode, only about 40% of the photons reaching the window would strike the photocathode. This yield can be raised to around 65% by using the conical window discussed earlier. Data taken with the conical window, shown as triangles in Figure 7, are in agreement with this prediction.
Finally, several 55 cm2 prototype sections of the faceted mirror were produced commercially[12]. A single section, designed for placement at polar angles near 90∘, was inserted near the far end of the tube. A particle at 90∘ was simulated and the delivered light measured with each of the two windows in place. The transport efficiency was found to be (222)% for the plain window. The simulation predicts a value of (231)%, in good agreement with the measurement. These values imply an efficiency of around 8% for delivery to a 6.4 cm diameter photocathode. For the conical window the corresponding efficiency was measured to be (132)%. In a detector module, photons produced by tracks incident at a 90∘ polar angle are reflected equally by the faceted mirrors to both ends of the tube, so the total transport efficiency with the conical window will be 26%.
B Detector module
To verify several critical aspects of the design, we constructed one half-length module to serve as a prototype (Figure 8). A 1 m long, 10 cm diameter stainless steel tube was lined with aluminized Mylar D-1 overcoated with MgF2 [7]. Two prototype sections of the faceted mirror were placed inside the tube near one end, corresponding to the center of a full-length module, and the endplate was blackened to eliminate extraneous reflections. Placed at the other end of the tube was a Hamamatsu R4143Q photomultiplier with quartz window,***This PMT is not what would be used in a final design, since it does not have the fine-mesh dynode structure. viewing the pressurized gas through the mirrored conical quartz window, described earlier. The PMT was optically coupled to the quartz window using General Electric Viscasil.
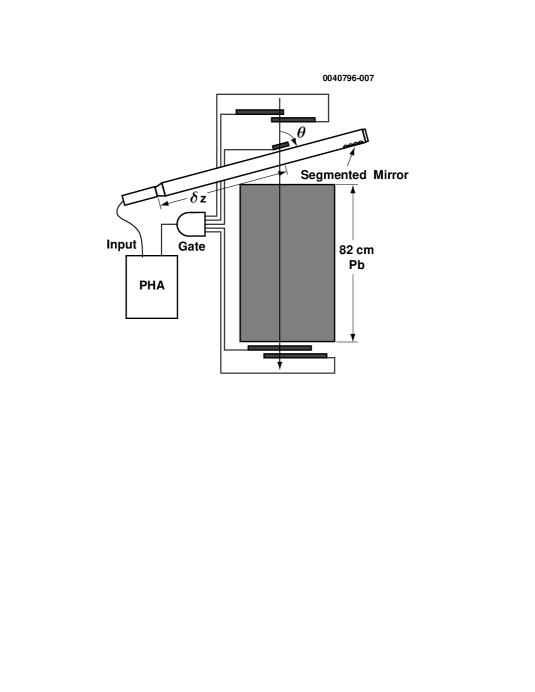
To study the response of this prototype module to energetic particles, we constructed a cosmic ray telescope, using plastic scintillators to trigger on muons with momentum above 1 GeV/c. Three small scintillators above the module insured that the cosmic rays passed directly through the desired region of the gas. An 82 cm thick absorber of lead was placed directly below the prototype, and two larger scintillators were placed under the lead. To trigger all five scintillators in coincidence, a cosmic ray muon would need not only to pass through the prototype at the desired position and angle, but also to have sufficient momentum to penetrate the lead, at least 1.0 GeV/c. The prototype was supported on a U-channel which pivoted about a steel rod such that its angle with respect to the vertical axis and its position along the tube axis could be easily modified. A schematic view of the cosmic ray test configuration is shown in Figure 8. The photomultiplier signal from the prototype was amplified by a Hewlett Packard 5582A linear amplifier and delivered to a Canberra 750Plus series pulse height analyzer. The gate for the signal was 4 s wide, generated in an EG&G 416A gate generator by a five-fold coincidence of the scintillators. The measured signal was calibrated by operating the photomultiplier with its face covered, such that the observed signal corresponded to single photoelectron noise.
The Čerenkov light yields were studied for cosmic rays at many positions along the length of the module. In one set of readings, the incidence angle and position were varied simultaneously to reproduce those expected of particles entering the actual detector. This set consisted of the following combinations of polar angle () and distance from the window (): (a) , =35 cm, (b) , =50 cm, (c) , =65 cm, and (d) , =75 cm. In the final detector, there would be a faceted mirror module at each of the settings (b), (c) and (d), but in this test none was employed.
These test configurations were duplicated in a Monte Carlo simulation, where particles penetrate the prototype and generate Čerenkov photons at the expected rate, distributed at the expected angles and energies. Each photon then propagates through the gas volume and is absorbed or reflected at each mirrored surface encountered with a wavelength-dependent probability based on the measured reflectivity. A photon reaching the front face of the end window may be either reflected from the quartz or transmitted. After entering the quartz, a photon is reflected back out the front face, absorbed by the mirrored wall, or transmitted to the photocathode. Once the photon enters the photocathode, the manufacturer’s tabulation of its quantum efficiency is used to determine whether a photoelectron is produced.
The data were compared with the Monte Carlo predictions, and simulation parameters were adjusted until agreement was achieved. We found that excellent agreement was obtained if the reflectivity of the liner in the simulation was adjusted upward by approximately 1% over all wavelengths. Since the reflectivity used originally as input to the simulation was measured on an earlier sample than the liner in the prototype, it is possible that an improvement was made. Figure 9 shows one set of data with its prediction from the tuned simulation.
After verifying agreement between the simulation and data without the faceted mirror, we aligned the prototype module horizontally, in an orientation corresponding to a polar angle of 90∘. For each of several positions, a faceted mirror section was placed such that Čerenkov photons would strike it and be directed toward the PMT. The mirror and trigger were set up such that cosmic rays entered at average distances of 45 cm, 57 cm, 73 cm, and 90 cm from the PMT. It is important to note that only the 90 cm position corresponds to a physical situation if the module were installed around an interaction region.
In this configuration, because the area of a faceted mirror section is comparable to that of the trigger counters, the raw data include events where most of the light misses the faceted section. To account for such events, each test was repeated with the mirror section covered with black paper, and the resulting spectrum was normalized to the number of triggers and subtracted directly from the raw data collected with the mirror section uncovered. The results are in good agreement with our simulation, if the reflectivity of the mirror sections is taken to be about 0.65 times that of the reflective liner. The sections used here were the first replicas to be produced from a master. It is expected that with a better understanding of the replication process, the reflectivity of the faceted mirrors would increase substantially.
Results for the 90 cm position are shown in Figure 10. The agreement between data and Monte Carlo is excellent, giving us confidence that the simulation is a reasonable representation of the prototype and that the critical parameters of this system are well understood. In the final system, the light collected from charged particles penetrating near the center of the detector module would be approximately doubled, as the module would be approximately twice as long and would be instrumented with PMT’s at both ends.
IV Simulation Studies for CLEO III
To evaluate the effectiveness of the full detector system for physics results, the Monte Carlo simulation described in the previous section was incorporated into the CLEO III GEANT-based [13] package. It was then used to study two specific physics problems in annihilation events in the region: (1) separation of modes and , and (2) extraction of from a large background of .
This simulation includes track curvature due to the magnetic field, interactions at the various detector interfaces, splashback from interactions in the CsI electromagnetic calorimeter, and the performance of the fine mesh PMT in a magnetic field. The signal for each module is derived by summing the outputs from both PMT’s. Since a track almost always traverses two modules, the net signal is the sum of outputs from two to four PMT’s. The noise rate of the fine mesh PMT is of the order of 1 KHz above the 0.5 p.e. level, and the event gate in CLEO is estimated to be in the 100 ns range; this implies that there is no significant noise contribution when the outputs of more than one PMT are summed.
First, single and tracks were generated with momenta in the range 0.8-3.0 GeV/c and polar angles between 45∘ and 135∘ (this angular region is set by the active volume of the detector). As an example, we show in Figure 11 the expected photoelectron yield for pions and kaons of momenta 1.0 and 2.5 GeV/c and polar angle between 85∘ and 95∘. At 2.5 GeV/c the kaons are slightly above threshold. Beyond the expected signal, it is seen that a small fraction of kaons produce a substantial false signal due to an interaction in the material before the detector, which may produce a pion or delta ray which is above threshold. To be identified as pions (kaons), we require the photoelectron yield to be above (below) a certain value. The cut values are different for pions and kaons and are functions of the track momentum and polar angle. To reduce the rate of false identifications due to interactions, we require alignment between the projected track and the shower centroid as measured in the calorimeter. The degree of alignment required is in the range 1.7∘-2.3∘ and depends primarily on the track momentum. It is chosen such that 80% of pions pass it. In Table II we show the net pion efficiency, , and kaon fake rate, , where the cuts have been optimized by maximizing , which is proportional to the ratio of signal to background (S/B). At momenta 2.5-2.8 GeV/c, S/B ranges from about 30 to 60, depending on the angle of the track; this translates roughly to 2.5 separation. Combining this information with measurements of specific ionization in the drift chamber will increase the separation to above 3 [14].
Using the criteria developed from simulations of single and tracks, we studied some specific decay modes in fully simulated events. The efficiencies presented below are due only to particle identification, since all other efficiencies, such as geometric cuts, kinematic cuts, lepton identification, and isolation of tracks to eliminate multiple hits, cancel to first order for this evaluation.
We have studied the two decays and , where each mode poses the most serious background for the other and the two branching fractions are thought to be comparable. If we choose pulse height cuts by maximizing S/B, we find that the PID efficiency for detecting the final state is , whereas the background from the state is . If instead, we wish to detect , then the efficiency is and the background from the final state is . These efficiencies imply a rejection ratio of at least 1/20, which corresponds to a separation of 2.5. The S/B for the two modes are different because kaons have a long tail at high photoelectron yields, while pions do not have a similar tail at low yields. Further separation between the two samples can be achieved by using dE/dx information [14] from the drift chamber and the kinematic quantity .
We also studied the decay , a Cabbibo-suppressed decay where there is a large background from the unsuppressed decay . In this case, cuts were optimized by maximizing S2/(S+B), where the mode was assumed to have a rate 15 times smaller than the mode. We selected mesons produced with momenta above 1.9 GeV/c, and with or polar angle between 45∘ and 135∘. The resulting efficiencies for detecting the pion in and fake rates from kaons in are presented in Table III. These results indicate a S/B of about 20. It is clear that, even after allowing for the higher rate for , the final sample is enriched with the signal decay. This is much better than the current CLEO II performance[15], where the final sample is dominated by background from events. Additional signal enhancement may be achieved through kinematic requirements and measurements of specific ionization[14].
V Conclusion
It has been demonstrated that a simple, compact gas threshold Čerenkov counter which utilizes commercially produced photodetectors can provide hadron identification in the momentum region 1-3 GeV/c. The design described here can be implemented as is, with the development of a mechanical design. Possible improvements requiring some further development include better quality reflective liners and faceted mirrors, optimized design of the quartz window, and use of low- materials such as carbon fiber or beryllium in the tubes to reduce the thickness of material. In addition, continuing improvements in photodetection technology are beginning to yield devices with better operating characteristics, e.g., higher quantum efficiency, than the fine mesh PMT studied here[16].
Although this detector was developed for implementation in the CLEO III detector, it could be used in a much broader set of applications. Because of its speed and the low number of readout channels, it can be used in most settings with moderately high rate and low particle multiplicities. By using multiple layers and varying gas pressures, this design can be applied to all particles with momenta above 1 GeV/c, up to 10 GeV and above. These are difficult regions in which to achieve hadron identification, and the detector presented here does so simply and at moderate cost.
VI Acknowledgments
Thanks are due for assistance provided by colleagues in the CLEO collaboration, to Brian Heltsley for assistance with incorporating our Monte Carlo into the CLEO III GEANT environment, to Jim Alexander for providing funds for materials from his NSF-PYI award, and to the High Energy Physics group at the University of California, Santa Barbara, for use of equipment. We thank Karl Berkelman and the Laboratory of Nuclear Studies, Cornell University, for providing laboratory space and material for conducting this research. Jim McCormick of Hamamatsu Corp. is gratefully acknowledged for providing us with a fine mesh photomultiplier tube for test purposes. Jon E. Sollid of Sollid Optics, Inc., is acknowledged for providing valuable advice on the design and for finding sources for many of the optical components critical to our tests.
This research was funded by the U.S. National Science Foundation, the U.S. Department of Energy, and Vanderbilt University.
REFERENCES
- [1] The CLEO III Detector Status Report, CBX95-96, Laboratory of Nuclear Studies, Cornell University.
- [2] T. Hasegawa et al., Nucl. Inst. and Meth. A342 (1994) 383; I. Adachi et al., Nucl. Inst. and Meth. A355 (1995) 386.
- [3] J. H. Atkinson and V. Perez-Mendez, Rev. Sci. Inst. 30 (1959) 864.
- [4] E. L. Garwin and A. Roder, Nucl. Inst. and Meth. 93 (1971) 593.
- [5] Since the operating pressure is very close to the liquification point of SF6, transmission immediately after filling was poor. Once stable, transmission was observed to remain constant over periods of greater than one week.
- [6] Y. Tomkiewicz and E. L. Garwin, Nucl. Inst. and Meth. 114 (1974) 413.
- [7] The liner used in the tests was coated by Hyperfine Inc., Colorado.
- [8] According to our simulation, the facet strips may be as wide as 3 mm without undue loss of signal. The larger width is desirable for reducing the cost associated with fabricating master forms for the mirrors but increases the net thickness of the mirror. The 1 mm width in our design was chosen as a compromise between thickness and cost.
- [9] A. Sawaki et al., IEEE Trans. Nucl. Sci. NS-31, 1 (1984) 442; M. D. Rousseau et al., IEEE Trans. Nucl. Sci. NS-30, 1 (1983) 479; H. Kume et al., IEEE Trans. Nucl. Sci. NS-32, 1 (1985) 355; S. Suzuki et al., IEEE Trans. Nucl. Sci. NS-33, 1 (1986) 377.
- [10] R. Enomoto et al., Nucl. Inst. and Meth. A332 (1993) 129.
- [11] P. Jarron and M. Goyot, Nucl. Inst. and Meth. 226 (1984) 156.
- [12] The faceted mirrors were constructed and coated by Sollid Optics, Inc., New Mexico.
- [13] R. Brun et al., GEANT 3.15, CERN DD/EE/84-1.
- [14] In CLEO II pions and kaons of momenta less than 0.8 GeV/c can be separated by better than 3.0, and those above 2 GeV/c or so can be separated by 1.5-2.0. It is expected that CLEO III performance will be similar.
- [15] F. Butler et al. (CLEO), Phys. Rev. D 52 (1995) 2656.
- [16] Private communication with J. McCormick, Hamamatsu Corp.


| interval (m) | polar angle (degrees) | (degrees) | (degrees) |
|---|---|---|---|
| 0.00 - 0.05 | 88.4 | 37.5 | 37.5 |
| 0.05 - 0.11 | 84.9 | 32.0 | 41.0 |
| 0.11 - 0.15 | 81.8 | 29.0 | 42.0 |
| 0.15 - 0.21 | 78.7 | 26.0 | 43.0 |
| 0.21 - 0.26 | 75.4 | 23.0 | 44.0 |
| 0.26 - 0.32 | 72.1 | 20.0 | 45.0 |
| 0.32 - 0.38 | 68.7 | 18.0 | 46.0 |
| 0.38 - 0.45 | 65.2 | 16.0 | 47.0 |
| 0.45 - 0.53 | 61.4 | 14.0 | 48.0 |
| 0.53 - 0.61 | 57.7 | 12.0 | 49.0 |
| Momentum (GeV/c) | |||
|---|---|---|---|
| () | () | () | |
| 0.8 | 54.0 (0.65) | 70.8 (0.90) | 62.8 (1.35) |
| 1.0 | 54.0 (0.25) | 72.1 (1.40) | 61.9 (1.10) |
| 1.2 | 59.6 (0.20) | 71.2 (0.80) | 62.4 (0.80) |
| 1.6 | 59.9 (0.87) | 70.6 (1.15) | 62.7 (1.20) |
| 2.0 | 54.6 (0.65) | 70.3 (1.50) | 61.1 (0.85) |
| 2.5 | 37.6 (1.05) | 71.6 (1.30) | 61.2 (0.95) |
| 2.8 | 36.3 (1.10) | 42.2 (1.55) | 28.3 (0.90) |
| 3.0 | 36.5 (2.15) | 32.1 (1.30) | 33.5 (3.50) |
| Track momentum (GeV/c) | Efficiency, | Fake rate, |
|---|---|---|
| 0.8-1.0 | 70.7% | 4.6% |
| 1.0-1.2 | 67.3% | 4.5% |
| 1.2-1.6 | 71.3% | 2.6% |
| 1.6-2.0 | 74.3% | 4.1% |
| 2.0-2.8 | 71.1% | 2.9% |
| 2.8-3.0 | 46.8% | 4.4% |
| 0.8-3.0 |