Measurement of the Boson Mass
Abstract
A measurement of the mass of the boson is presented based on a sample of 5982 decays observed in collisions at = 1.8 TeV with the DØ detector during the 1992–1993 run. From a fit to the transverse mass spectrum, combined with measurements of the boson mass, the boson mass is measured to be .
pacs:
PACS numbers: 14.70.Fm, 12.15.Ji, 13.38.Be, 13.85.QkThe parameters of the gauge sector of the electroweak Standard Model [3] can be taken to be the fine structure constant, the Fermi constant, and the mass of the boson, , all measured to a precision better than 0.01%. Higher order calculations then relate the mass of the boson, , and the weak mixing angle, , to these three parameters, the heavy fermion masses, and the Higgs boson mass. Within the Standard Model, a direct measurement of thus constrains the allowed region for the top quark and Higgs masses. Alternatively, a precision measurement of the mass, when combined with other measurements of , provides a test of the Standard Model. The mass of the boson has been measured recently in a number of experiments [4]. We present here a new precision measurement.
We have analyzed a sample of decays resulting from collisions at = 1.8 TeV. This sample, which corresponds to an exposure of 12.8 pb-1, was collected with the DØ detector during the 1992–1993 run at the Fermilab Tevatron collider. Two components of the detector [5] are most relevant to this analysis. The central tracking system is used to reconstruct charged particle tracks and the interaction vertex. A central and two end uranium liquid-argon calorimeters measure the energy flow over a pseudorapidity range [6].
Both and decays are used in the analysis. The electrons from these decays tend to be isolated and of high transverse momentum, . At the trigger level [7], candidates were required to have an electromagnetic (EM) energy cluster with transverse energy 20 GeV and to have missing transverse energy 20 GeV. Here , with the sum extending over all calorimeter cells. candidates were required to have two EM energy clusters, each with GeV.
Offline selection criteria were imposed on the EM energy cluster of each electron candidate. The transverse and longitudinal shower profiles of the cluster were required to be consistent with those expected for an electron [8]. The energy leakage of the cluster into the hadronic compartment of the calorimeter was required to be less than 10%. The isolation criterion of the cluster was satisfied by requiring the total energy within a cone of radius [9], centered on the electron direction, but outside the EM core of the shower (), to be to be less than 15% of the energy in the EM core. A spatial match of the cluster with a central detector track was required. Electrons with cluster position in the region between the cryostats or within 10% of the boundary of a calorimeter module in the central region were eliminated from the data sample.
Having found events with well-identified, isolated electrons and for bosons the required , kinematic constraints were imposed on the data. The ’s of each electron in events and of the electron and neutrino in events were required to exceed 25 GeV. The neutrino was equated to the . In addition, the transverse momentum of the boson, had to be less than 30 GeV/c. These selection criteria yielded 7234 events with the electron in the central calorimeter (), 366 events with both electrons in the central calorimeter, and 281 events with one electron in the central and one in an end calorimeter ().
Since the longitudinal component of the neutrino momentum is not measured, the invariant mass cannot be reconstructed. Rather, the mass of the boson is extracted from the distribution in transverse mass, defined as , where is the angle between the electron and neutrino transverse momenta. The electron direction is defined using the centroid of the calorimeter cluster and the weighted average of the positions of the hits on the track. The uncertainty in determining this angle leads to an uncertainty of on . Since the absolute energy scale of the EM calorimeter is not known with the required precision, the ratio of the measured and masses and the world average mass [10] were used to determine the boson mass. The module-to-module calibration of the central EM calorimeter was determined to a precision of 0.5%. The energy resolution of the central EM calorimeter has been parametrized for this analysis as , with in GeV. The sampling term of was measured in a test beam; the constant term of was determined directly from the observed width of the resonance. The uncertainty in the EM energy resolution contributes a 70 MeV/c2 uncertainty on .
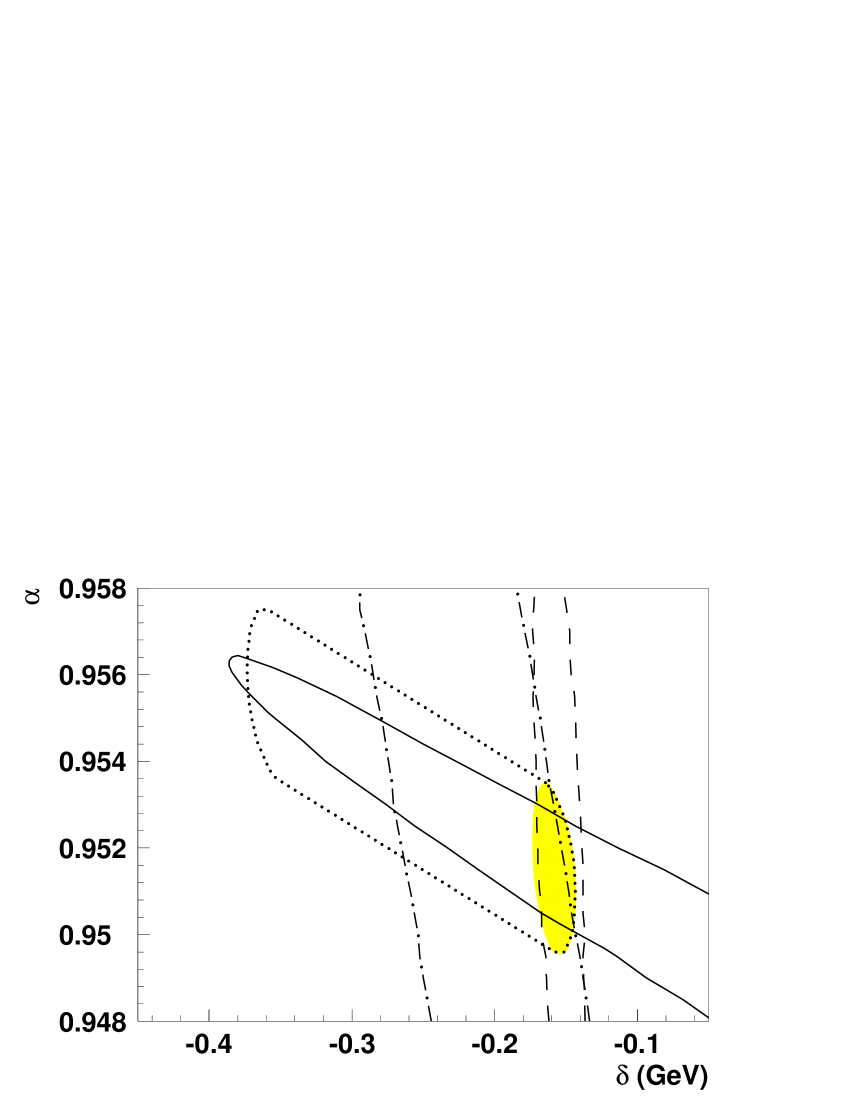
The EM energy scale of the central calorimeter was determined by comparing the masses measured in , , and decays to their known values [10, 11]. If the electron energy measured in the calorimeter and the true energy are related by , the measured and true mass values are, to first order, related by . The variable depends on the decay topology and is given by , where is the opening angle between the two decay products and and are their measured energies. Figure 1 shows the constraints on the parameters and obtained independently from the , the , and the data. When combined, these three constraints limit and to the shaded elliptical region. Test beam measurements allow for a small nonlinear term in the energy response, which affects both and and alters the ratio largely through the effect on as shown by the dotted line in Fig. 1.
Using the measured masses for the observed resonances, the energy scale factor determined is and the offset is GeV, where the asymmetric errors are due to possible nonlinearities. The measured offset is consistent with that determined from test beam data, and has been confirmed by a detailed Monte Carlo study of energy loss in the central detectors. The dependence of the measured ratio of the mass to mass on and may be estimated from
It should be noted that the mass is insensitive to if . The uncertainty on the absolute energy scale results in an uncertainty on of 160 MeV/c2, of which 150 MeV/c2 is due to the statistics of the data sample.
The mass is obtained from an unbinned maximum-likelihood fit of the data to distributions in , generated as a function of at 100 MeV/c2 intervals by a fast Monte Carlo simulation. This Monte Carlo models both the production and decay of the vector bosons and the detector response, and relies heavily on experimental data for input. It starts with the double differential production cross section in and rapidity calculated at next to leading order [12] using the MRSA parton distribution functions (pdf) [13]. The mass of the boson is generated with a relativistic Breit-Wigner line shape, skewed by the mass dependence of the parton luminosity. In the simulation, the boson width has been fixed to its measured value, [7]. The uncertainty on results in an uncertainty of 20 MeV/c2 on . The decay products are then generated in the rest frame with an angular distribution respecting the polarization of the . Radiative decays are generated at according to [14].
After generation of the kinematics of the event at the four-vector level, the resolutions of the detector are incorporated and the energy scales are set. Minimum bias (MB) events are used to model the underlying event, mimicking the debris in the event due to spectator parton interactions and the pile-up associated with multiple interactions, and including the residual energy from previous beam crossings. The relative response of the hadronic and EM calorimeters is established by studying events. To ensure an equivalent event topology between the and events, decays in which one electron is in the end calorimeter are included in this study. The transverse momentum balance in events is given by , where is the underlying event contribution and is the transverse momentum of the recoil to the vector boson. One finds for the average assuming , where is the transverse momentum of the measured from the two electrons. The cross term on the right hand side averaged to zero since the underlying event vector is randomly distributed with respect to the recoil system. Figure 2 shows the distribution of versus . The data shows a linear relation between the EM and hadronic energy scale, and yields . The intercept yields the magnitude of the underlying event vector, , consistent with the value obtained from MB events. The uncertainty on due to the uncertainty on the hadronic energy scale is 50 MeV/c2.
The recoil against the vector boson is modeled by a single jet. The transverse momentum of the is scaled by and smeared using a resolution of 0.80/, as obtained from our dijet events. The uncertainty on the jet resolution gives a 65 MeV/c2 uncertainty on . The event is superimposed onto MB events, which simulates the underlying event. The luminosity profile of these MB events is chosen such that the mean number of interactions per crossing is the same as for the data.
The modeling of the recoil and underlying event are verified and constrained by comparing the of the obtained from the two electrons, , to that obtained from the rest of the event: . To minimize the contribution from the electron energy resolution, the vector sum of these two quantities is projected along the bisector of the two electron directions. Since is randomly oriented and has a magnitude , the width of the distribution is sensitive to the underlying event contribution while the mean is largely unaffected. The of the distribution is . The sensitivity of the width of this distribution to the mean number of MB events that mimic the underlying event is determined by varying the number of MB events in the Monte Carlo. The number of MB events preferred by the data is , consistent with one. The uncertainty on from the underlying event model is 60 MeV/c2.
The energy underlying the electron was obtained from events by measuring the energy deposited in a region of the calorimeter the same size as the electron cluster but rotated away from the electron in azimuth. On average, the underlying event adds to the energy of central electrons and results in an uncertainty on of 35 MeV/c2.
Detector and reconstruction biases were also modeled in the Monte Carlo simulation. In radiative decays, , the mass does not reconstruct to the mass unless the photon is clustered with the electron. Also, radiative decays in which the photon is radiated near, but not fully within, the electron cluster can distort the cluster shape causing the electron to fail the shower shape cuts. The same considerations apply to radiative decays and these effects do not cancel completely in the ratio of the masses. Similarly, the recoil system may affect the electron identification, especially if it is close to the electron. A measure of the event selection biases, due to electron shape and isolation cuts, is obtained by studying the projection of the momentum recoiling against the along the electron direction: . An inefficiency in would cause a kinematic bias for the decay products. The efficiency as a function of has been determined from the data using the energy in a cone around the electron, which is used to select isolated electrons. The efficiency was verified using decays. For values of there is an inefficiency of approximately 10%. The error on resulting from the uncertainty in the efficiency is .
The QCD jet background in the sample was determined from an independent jet data sample to be . Inclusion of this background shifts the mass by +33 MeV/c2. The background from events in which one electron is not identified has been estimated, using ISAJET [15], to be %. Its effect on is negligible. The uncertainty in the amount of background, and its distribution in transverse mass, gives an uncertainty on of 35 MeV/c2. The 1.3% irreducible background due to was included in the Monte Carlo simulation. All other sources of background are negligible.
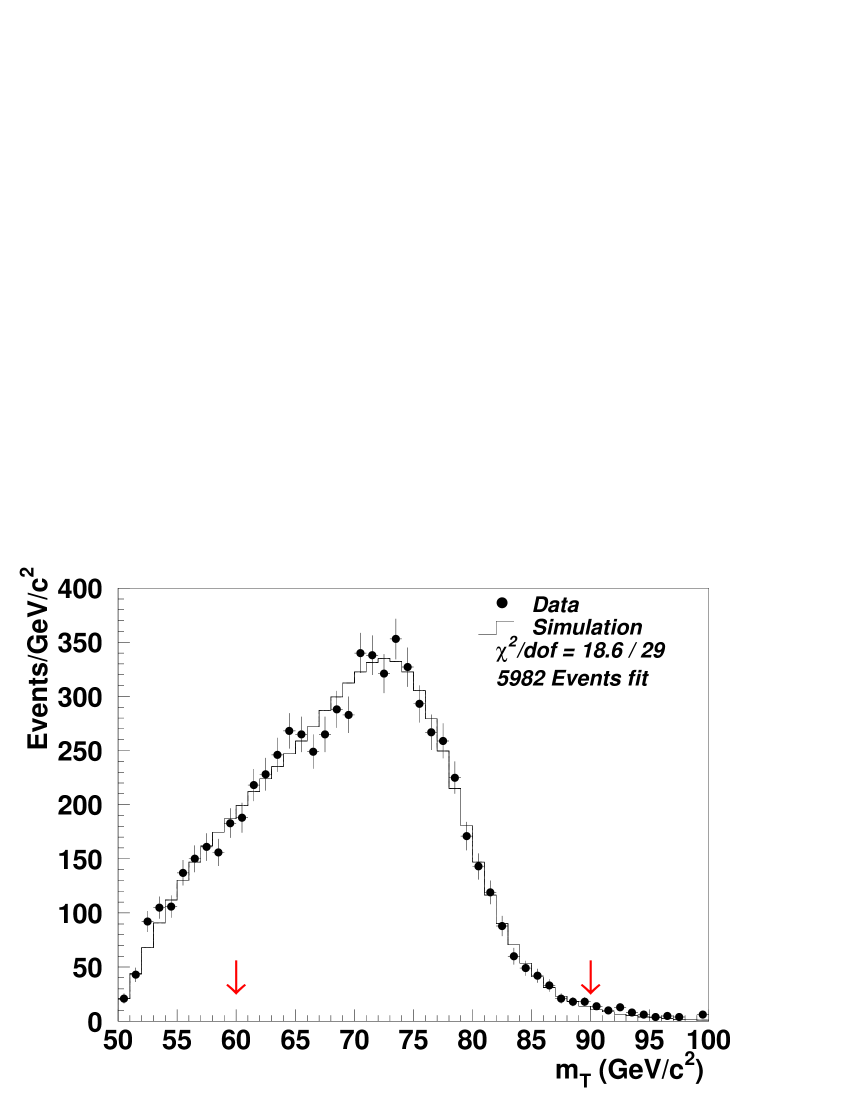
The distribution in and the Monte Carlo line shape corresponding to the best fit are shown in Fig. 3. The mass, extracted from a fit of the 5982 events in the range GeV/c2, is GeV/c2. Table I lists the uncertainties in the measurement, which used the MRSA pdf. As a consistency check, a fit to the distribution in the range GeV/c2 was performed to extract the mass. This fit results in a mass lower than when measured from the distribution. The statistical error on this fit is .
The largest systematic uncertainty, beyond those mentioned above, is due to the modeling of the spectrum and the pdf’s. The correlation between the pdf’s and the distribution has been addressed. To study the uncertainty, parametrizations of the CTEQ3M pdf were obtained [16] incorporating all available data and with the charge asymmetry [17] data points moved coherently by one standard deviation, resulting in a maximum allowed range of pdf’s. The parameters governing the nonperturbative part of the spectrum [18] were varied simultaneously, as constrained by our measured spectrum. The resulting variation in the spectrum leads to an uncertainty of 65 MeV/c2 on .
In conclusion, a new measurement of the mass from a fit to the transverse mass spectrum of decays has been presented. The mass is measured to be GeV/c2, where all errors have been added in quadrature.
We thank the staffs at Fermilab and the collaborating institutions for their contributions to the success of this work, and acknowledge support from the Department of Energy and National Science Foundation (U.S.A.), Commissariat à L’Energie Atomique (France), Ministries for Atomic Energy and Science and Technology Policy (Russia), CNPq (Brazil), Departments of Atomic Energy and Science and Education (India), Colciencias (Colombia), CONACyT (Mexico), Ministry of Education and KOSEF (Korea), CONICET and UBACyT (Argentina), and the A.P. Sloan Foundation.
REFERENCES
- [1] Visitor from IHEP, Beijing, China.
- [2] Visitor from Univ. San Francisco de Quito, Ecuador.
- [3] S. Weinberg, Phys. Rev. Lett. 19, 1264 (1967); S.L. Glashow, Nucl. Phys. 22, 579 (1968); A. Salam, in Elementary Particle Theory, ed. by N. Svartholm (Almquist and Wiksell, Sweden, 1968), p. 367; S.L. Glashow, J. Illiopoulos and L. Maiani, Phys. Rev. D 2, 1285 (1970); M. Kobayashi and M. Maskawa, Prog. Theor. Phys. 49, 652 (1973).
- [4] J. Alitti et al. (UA2 Collaboration), Phys. Lett. B276, 354 (1992); F. Abe et al. (CDF Collaboration), Phys. Rev. Lett. 65, 2243 (1990), Phys. Rev. D 43, 2070 (1991); F. Abe et al. (CDF Collaboration), Phys. Rev. Lett. 75, 11 (1995), F. Abe et al. Phys. Rev. D52, 4784 (1995).
- [5] S. Abachi et al. (DØ Collaboration), Nucl. Instr. and Methods A338, 185 (1994).
- [6] Pseudorapidity is defined as where is the polar angle with respect to the proton beam.
- [7] S. Abachi et al. (DØ Collaboration), Phys. Rev. Lett. 75, 1456 (1995).
- [8] For more details, see S. Abachi et al. (DØ Collaboration), Phys. Rev. D 52, 4877 (1995).
- [9] is defined as where and are calculated from the center of the calorimeter cells with respect to the () position of the electromagnetic shower.
- [10] We used = 91.1884 0.0022 GeV/c2, from P. Renton, “Precision Tests of Electroweak Theories,” Lepton-Photon Conference, Beijing, P.R. China (1995), OUNP-95-20.
- [11] The reference mass values used are = 3.09688 0.00004 GeV/c2 and = 0.1350 0.0006 GeV/c2, Particle Data Group, L. Montanet et al., Phys. Rev. D 50, 1173 (1994).
- [12] G. Ladinsky and C.-P. Yuan, Phys. Rev. D 50, 4239 (1994).
- [13] A.D. Martin, R.G. Roberts and W.J. Stirling, Phys. Rev. D 50, 6734 (1994) and Phys. Rev. D 51, 4756 (1995).
- [14] F. A. Berends and R. Kleiss, Z. Phys. C27, 365 (1985).
- [15] F. Paige and S. Protopopescu, BNL Report no. BNL38034 (1986, unpublished), release 6.49.
- [16] H.L. Lai, et al., Phys. Rev. D 51, 4763 (1995).
- [17] F. Abe et al., (CDF Collaboration), Phys. Rev. Lett. 74, 850 (1995).
- [18] The parametrization of the spectrum is most sensitive to variations of the parameter in the nonperturbative function (see [12]). The range for as limited by our data was where .
| Uncertainty | MeV/c2 |
|---|---|
| Statistical | 140 |
| Energy scale | 160 |
| Statistical | 150 |
| systematics | 35 |
| Calorimeter low energy nonlinearities | 25 |
| Other systematics | 165 |
| Electron energy resolution | 70 |
| Jet energy resolution | 65 |
| pdf’s, spectrum | 65 |
| Underlying event model | 60 |
| Relative hadronic and EM energy scale | 50 |
| Electron angle calibration | 50 |
| Energy underlying electron | 35 |
| Backgrounds | 35 |
| Radiative decays | 20 |
| efficiency | 20 |
| Trigger efficiency | 20 |
| width | 20 |
| Fitting error | 5 |
| Total | 270 |