Study of Charged–Current ep𝑒𝑝ep Interactions
at Q2>200GeV2superscript𝑄2200superscriptGeV2Q^{2}>200\,{\rm Ge}\kern-1.0pt{\rm V}^{2} with the ZEUS Detector at HERA

ZEUS Collaboration

Deep inelastic charged–current reactions have been studied in e+psuperscript𝑒𝑝e^{+}p and epsuperscript𝑒𝑝e^{-}p collisions at a center of mass energy of about 300GeV300GeV300\,{\rm Ge}\kern-1.0pt{\rm V} in the kinematic region Q2>200GeV2superscript𝑄2200superscriptGeV2Q^{2}\mathchar 318\relax 200\,{\rm Ge}\kern-1.0pt{\rm V}^{2} and x>0.006𝑥0.006x\mathchar 318\relax 0.006 using the ZEUS detector at HERA. The integrated cross sections for Q2>200GeV2superscript𝑄2200superscriptGeV2Q^{2}\mathchar 318\relax 200\,{\rm Ge}\kern-1.0pt{\rm V}^{2} are found to be σe+pν¯X=30.3pb-4.2+5.5-2.6+1.6subscript𝜎superscript𝑒𝑝¯𝜈𝑋30.3superscriptsubscriptsuperscriptsubscriptpb2.61.64.25.5\sigma_{e^{+}p\to{\overline{\nu}}X}=30.3\,{}^{+5.5}_{\mathchar 512\relax 4.2}\,{}^{+1.6}_{\mathchar 512\relax 2.6}\,{\rm pb} and σepνX=54.7pb-9.8+15.9-3.4+2.8subscript𝜎superscript𝑒𝑝𝜈𝑋54.7superscriptsubscriptsuperscriptsubscriptpb3.42.89.815.9\sigma_{e^{-}p\to\nu X}=54.7\,{}^{+15.9}_{\mathchar 512\relax{\phantom{0}}9.8}\,{}^{+2.8}_{\mathchar 512\relax 3.4}\,{\rm pb}. Differential cross sections have been measured as functions of the variables x𝑥x, y𝑦y and Q2superscript𝑄2Q^{2}. From the measured differential cross sections dσ/dQ2𝑑𝜎𝑑superscript𝑄2d\sigma/dQ^{2}, the W𝑊W boson mass is determined to be MW=79GeV7+84+4subscript𝑀𝑊79superscriptsubscriptsuperscriptsubscriptGeV4478M_{W}=79\,{}^{+8}_{-7}{}^{+4}_{-4}\,{\rm Ge}\kern-1.0pt{\rm V}. Measured jet rates and transverse energy profiles agree with model predictions. A search for charged–current interactions with a large rapidity gap yielded one candidate event, corresponding to a cross section of σe+pν¯X(Q2>200GeV2;ηmax<2.5)=0.8±0.7+1.80.1pb\sigma_{e^{+}p\to{\overline{\nu}}X}(Q^{2}\mathchar 318\relax 200\,{\rm Ge}\kern-1.0pt{\rm V}^{2};\eta_{\rm max}<2.5)=0.8\,{}_{-0.7}^{+1.8}\,\pm 0.1\,{\rm pb}.

The ZEUS Collaboration

M. Derrick, D. Krakauer, S. Magill, D. Mikunas, B. Musgrave, J.R. Okrasinski, J. Repond, R. Stanek, R.L. Talaga, H. Zhang
Argonne National Laboratory, Argonne, IL, USA p

M.C.K. Mattingly
Andrews University, Berrien Springs, MI, USA

P. Antonioli, G. Bari, M. Basile, L. Bellagamba, D. Boscherini, A. Bruni, G. Bruni, P. Bruni,
G. Cara Romeo, G. Castellini1, L. Cifarelli2, F. Cindolo, A. Contin, M. Corradi, I. Gialas, P. Giusti, G. Iacobucci, G. Laurenti, G. Levi, A. Margotti, T. Massam, R. Nania, F. Palmonari, A. Pesci, A. Polini, G. Sartorelli, Y. Zamora Garcia3, A. Zichichi
University and INFN Bologna, Bologna, Italy f

C. Amelung, A. Bornheim, J. Crittenden, R. Deffner, T. Doeker4, M. Eckert, L. Feld, A. Frey5, M. Geerts, M. Grothe, H. Hartmann, K. Heinloth, L. Heinz, E. Hilger, H.-P. Jakob, U.F. Katz, S. Mengel6, E. Paul, M. Pfeiffer, Ch. Rembser, D. Schramm7, J. Stamm, R. Wedemeyer
Physikalisches Institut der Universität Bonn, Bonn, Germany c

S. Campbell-Robson, A. Cassidy, W.N. Cottingham, N. Dyce, B. Foster, S. George, M.E. Hayes,
G.P. Heath, H.F. Heath, D. Piccioni, D.G. Roff, R.J. Tapper, R. Yoshida
H.H. Wills Physics Laboratory, University of Bristol, Bristol, U.K. o

M. Arneodo8, R. Ayad, M. Capua, A. Garfagnini, L. Iannotti, M. Schioppa, G. Susinno
Calabria University, Physics Dept.and INFN, Cosenza, Italy f

A. Caldwell9, N. Cartiglia, Z. Jing, W. Liu, J.A. Parsons, S. Ritz10, F. Sciulli, P.B. Straub, L. Wai11, S. Yang12, Q. Zhu
Columbia University, Nevis Labs., Irvington on Hudson, N.Y., USA q

P. Borzemski, J. Chwastowski, A. Eskreys, Z. Jakubowski, M.B. Przybycień, M. Zachara, L. Zawiejski
Inst. of Nuclear Physics, Cracow, Poland j

L. Adamczyk, B. Bednarek, K. Jeleń, D. Kisielewska, T. Kowalski, M. Przybycień, E. Rulikowska-Zarȩbska, L. Suszycki, J. Zaja̧c
Faculty of Physics and Nuclear Techniques, Academy of Mining and Metallurgy, Cracow, Poland j

Z. Duliński, A. Kotański
Jagellonian Univ., Dept. of Physics, Cracow, Poland k

G. Abbiendi13, L.A.T. Bauerdick, U. Behrens, H. Beier, J.K. Bienlein, G. Cases, O. Deppe, K. Desler, G. Drews, M. Flasiński14, D.J. Gilkinson, C. Glasman, P. Göttlicher, J. Große-Knetter, T. Haas, W. Hain, D. Hasell, H. Heßling, Y. Iga, K.F. Johnson15, P. Joos, M. Kasemann, R. Klanner, W. Koch, U. Kötz, H. Kowalski, J. Labs, A. Ladage, B. Löhr, M. Löwe, D. Lüke, J. Mainusch16, O. Mańczak, J. Milewski, T. Monteiro17, J.S.T. Ng, D. Notz, K. Ohrenberg, K. Piotrzkowski, M. Roco, M. Rohde, J. Roldán, U. Schneekloth, W. Schulz, F. Selonke, B. Surrow, E. Tassi, T. Voß, D. Westphal, G. Wolf, U. Wollmer, C. Youngman, W. Zeuner
Deutsches Elektronen-Synchrotron DESY, Hamburg, Germany

H.J. Grabosch, A. Kharchilava18, S.M. Mari19, A. Meyer, S. Schlenstedt, N. Wulff
DESY-IfH Zeuthen, Zeuthen, Germany

G. Barbagli, E. Gallo, P. Pelfer
University and INFN, Florence, Italy f

G. Maccarrone, S. De Pasquale, L. Votano
INFN, Laboratori Nazionali di Frascati, Frascati, Italy f

A. Bamberger, S. Eisenhardt, T. Trefzger20, S. Wölfle
Fakultät für Physik der Universität Freiburg i.Br., Freiburg i.Br., Germany c

J.T. Bromley, N.H. Brook, P.J. Bussey, A.T. Doyle, D.H. Saxon, L.E. Sinclair, M.L. Utley, A.S. Wilson
Dept. of Physics and Astronomy, University of Glasgow, Glasgow, U.K. o

A. Dannemann21, U. Holm, D. Horstmann, R. Sinkus, K. Wick
Hamburg University, I. Institute of Exp. Physics, Hamburg, Germany c

B.D. Burow22, L. Hagge16, E. Lohrmann, G. Poelz, W. Schott, F. Zetsche
Hamburg University, II. Institute of Exp. Physics, Hamburg, Germany c

T.C. Bacon, N. Brümmer, I. Butterworth, V.L. Harris, G. Howell, B.H.Y. Hung, L. Lamberti23, K.R. Long, D.B. Miller, N. Pavel, A. Prinias24, J.K. Sedgbeer, D. Sideris, A.F. Whitfield
Imperial College London, High Energy Nuclear Physics Group, London, U.K. o

U. Mallik, M.Z. Wang, S.M. Wang, J.T. Wu
University of Iowa, Physics and Astronomy Dept., Iowa City, USA p

P. Cloth, D. Filges
Forschungszentrum Jülich, Institut für Kernphysik, Jülich, Germany

S.H. An, G.H. Cho, B.J. Ko, S.B. Lee, S.W. Nam, H.S. Park, S.K. Park
Korea University, Seoul, Korea h

S. Kartik, H.-J. Kim, R.R. McNeil, W. Metcalf, V.K. Nadendla
Louisiana State University, Dept. of Physics and Astronomy, Baton Rouge, LA, USA p

F. Barreiro, J.P. Fernandez, R. Graciani, J.M. Hernández, L. Hervás, L. Labarga, M. Martinez, J. del Peso, J. Puga, J. Terron, J.F. de Trocóniz
Univer. Autónoma Madrid, Depto de Física Teóríca, Madrid, Spain n

F. Corriveau, D.S. Hanna, J. Hartmann, L.W. Hung, J.N. Lim, C.G. Matthews25, P.M. Patel, M. Riveline, D.G. Stairs, M. St-Laurent, R. Ullmann, G. Zacek25
McGill University, Dept. of Physics, Montréal, Québec, Canada a,𝑎{}^{a},  b

T. Tsurugai
Meiji Gakuin University, Faculty of General Education, Yokohama, Japan

V. Bashkirov, B.A. Dolgoshein, A. Stifutkin
Moscow Engineering Physics Institute, Mosocw, Russia l

G.L. Bashindzhagyan26, P.F. Ermolov, L.K. Gladilin, Yu.A. Golubkov, V.D. Kobrin, I.A. Korzhavina, V.A. Kuzmin, O.Yu. Lukina, A.S. Proskuryakov, A.A. Savin, L.M. Shcheglova, A.N. Solomin, N.P. Zotov
Moscow State University, Institute of Nuclear Physics, Moscow, Russia m

M. Botje, F. Chlebana, J. Engelen, M. de Kamps, P. Kooijman, A. Kruse, A. van Sighem, H. Tiecke, W. Verkerke, J. Vossebeld, M. Vreeswijk, L. Wiggers, E. de Wolf, R. van Woudenberg27
NIKHEF and University of Amsterdam, Netherlands i

D. Acosta, B. Bylsma, L.S. Durkin, J. Gilmore, C. Li, T.Y. Ling, P. Nylander, I.H. Park,
T.A. Romanowski28
Ohio State University, Physics Department, Columbus, Ohio, USA p

D.S. Bailey, R.J. Cashmore29, A.M. Cooper-Sarkar, R.C.E. Devenish, N. Harnew, M. Lancaster30,
L. Lindemann, J.D. McFall, C. Nath, V.A. Noyes24, A. Quadt, J.R. Tickner, H. Uijterwaal,
R. Walczak, D.S. Waters, F.F. Wilson, T. Yip
Department of Physics, University of Oxford, Oxford, U.K. o

A. Bertolin, R. Brugnera, R. Carlin, F. Dal Corso, M. De Giorgi, U. Dosselli, S. Limentani, M. Morandin, M. Posocco, L. Stanco, R. Stroili, C. Voci, F. Zuin
Dipartimento di Fisica dell’ Universita and INFN, Padova, Italy f

J. Bulmahn, R.G. Feild31, B.Y. Oh, J.J. Whitmore
Pennsylvania State University, Dept. of Physics, University Park, PA, USA q

G. D’Agostini, G. Marini, A. Nigro
Dipartimento di Fisica, Univ. ’La Sapienza’ and INFN, Rome, Italy f𝑓{}^{f}~{}

J.C. Hart, N.A. McCubbin, T.P. Shah
Rutherford Appleton Laboratory, Chilton, Didcot, Oxon, U.K. o

E. Barberis, T. Dubbs, C. Heusch, M. Van Hook, W. Lockman, J.T. Rahn, H.F.-W. Sadrozinski,
A. Seiden, D.C. Williams
University of California, Santa Cruz, CA, USA p

J. Biltzinger, R.J. Seifert, O. Schwarzer, A.H. Walenta
Fachbereich Physik der Universität-Gesamthochschule Siegen, Germany c

H. Abramowicz, G. Briskin, S. Dagan32, A. Levy26
School of Physics, Tel-Aviv University, Tel Aviv, Israel e

J.I. Fleck33, M. Inuzuka, T. Ishii, M. Kuze, S. Mine, M. Nakao, I. Suzuki, K. Tokushuku,
K. Umemori, S. Yamada, Y. Yamazaki
Institute for Nuclear Study, University of Tokyo, Tokyo, Japan g

M. Chiba, R. Hamatsu, T. Hirose, K. Homma, S. Kitamura34, T. Matsushita, K. Yamauchi
Tokyo Metropolitan University, Dept. of Physics, Tokyo, Japan g

R. Cirio, M. Costa, M.I. Ferrero, S. Maselli, C. Peroni, R. Sacchi, A. Solano, A. Staiano
Universita di Torino, Dipartimento di Fisica Sperimentale and INFN, Torino, Italy f

M. Dardo
II Faculty of Sciences, Torino University and INFN - Alessandria, Italy f

D.C. Bailey, F. Benard, M. Brkic, C.-P. Fagerstroem, G.F. Hartner, K.K. Joo, G.M. Levman, J.F. Martin, R.S. Orr, S. Polenz, C.R. Sampson, D. Simmons, R.J. Teuscher
University of Toronto, Dept. of Physics, Toronto, Ont., Canada a

J.M. Butterworth, C.D. Catterall, T.W. Jones, P.B. Kaziewicz, J.B. Lane, R.L. Saunders, J. Shulman, M.R. Sutton
University College London, Physics and Astronomy Dept., London, U.K. o

B. Lu, L.W. Mo
Virginia Polytechnic Inst. and State University, Physics Dept., Blacksburg, VA, USA q

W. Bogusz, J. Ciborowski, J. Gajewski, G. Grzelak35, M. Kasprzak, M. Krzyżanowski,
K. Muchorowski36, R.J. Nowak, J.M. Pawlak, T. Tymieniecka, A.K. Wróblewski, J.A. Zakrzewski, A.F. Żarnecki
Warsaw University, Institute of Experimental Physics, Warsaw, Poland j

M. Adamus
Institute for Nuclear Studies, Warsaw, Poland j

C. Coldewey, Y. Eisenberg32, D. Hochman, U. Karshon32, D. Revel32, D. Zer-Zion
Weizmann Institute, Nuclear Physics Dept., Rehovot, Israel d

W.F. Badgett, J. Breitweg, D. Chapin, R. Cross, S. Dasu, C. Foudas, R.J. Loveless, S. Mattingly, D.D. Reeder, S. Silverstein, W.H. Smith, A. Vaiciulis, M. Wodarczyk
University of Wisconsin, Dept. of Physics, Madison, WI, USA p

S. Bhadra, M.L. Cardy, W.R. Frisken, M. Khakzad, W.N. Murray, W.B. Schmidke
York University, Dept. of Physics, North York, Ont., Canada a

1 also at IROE Florence, Italy
2 now at Univ. of Salerno and INFN Napoli, Italy
3 supported by Worldlab, Lausanne, Switzerland
4 now as MINERVA-Fellow at Tel-Aviv University
5 now at Univ. of California, Santa Cruz
6 now at VDI-Technologiezentrum Düsseldorf
7 now at Commasoft, Bonn
8 also at University of Torino and Alexander von Humboldt Fellow
9 Alexander von Humboldt Fellow
10 Alfred P. Sloan Foundation Fellow
11 now at University of Washington, Seattle
12 now at California Institute of Technology, Los Angeles
13 supported by an EC fellowship number ERBFMBICT 950172
14 now at Inst. of Computer Science, Jagellonian Univ., Cracow
15 visitor from Florida State University
16 now at DESY Computer Center
17 supported by European Community Program PRAXIS XXI
18 now at Univ. de Strasbourg
19 present address: Dipartimento di Fisica, Univ. “La Sapienza”, Rome
20 now at ATLAS Collaboration, Univ. of Munich
21 now at Star Division Entwicklungs- und Vertriebs-GmbH, Hamburg
22 also supported by NSERC, Canada
23 supported by an EC fellowship
24 PPARC Post-doctoral Fellow
25 now at Park Medical Systems Inc., Lachine, Canada
26 partially supported by DESY
27 now at Philips Natlab, Eindhoven, NL
28 now at Department of Energy, Washington
29 also at University of Hamburg, Alexander von Humboldt Research Award
30 now at Lawrence Berkeley Laboratory, Berkeley
31 now at Yale University, New Haven, CT
32 supported by a MINERVA Fellowship
33 supported by the Japan Society for the Promotion of Science (JSPS)
34 present address: Tokyo Metropolitan College of Allied Medical Sciences, Tokyo 116, Japan
35 supported by the Polish State Committee for Scientific Research, grant No. 2P03B09308
36 supported by the Polish State Committee for Scientific Research, grant No. 2P03B09208

a supported by the Natural Sciences and Engineering Research Council of Canada (NSERC)
b supported by the FCAR of Québec, Canada
c supported by the German Federal Ministry for Education and Science, Research and Technology (BMBF), under contract numbers 057BN19P, 057FR19P, 057HH19P, 057HH29P, 057SI75I
d supported by the MINERVA Gesellschaft für Forschung GmbH, the Israel Academy of Science and the U.S.-Israel Binational Science Foundation
e supported by the German Israeli Foundation, and by the Israel Academy of Science
f supported by the Italian National Institute for Nuclear Physics (INFN)
g supported by the Japanese Ministry of Education, Science and Culture (the Monbusho) and its grants for Scientific Research
h supported by the Korean Ministry of Education and Korea Science and Engineering Foundation
i supported by the Netherlands Foundation for Research on Matter (FOM)
j supported by the Polish State Committee for Scientific Research, grants No. 115/E-343/SPUB/P03/109/95, 2P03B 244 08p02, p03, p04 and p05, and the Foundation for Polish-German Collaboration (proj. No. 506/92)
k supported by the Polish State Committee for Scientific Research (grant No. 2 P03B 083 08) and Foundation for Polish-German Collaboration
l partially supported by the German Federal Ministry for Education and Science, Research and Technology (BMBF)
m supported by the German Federal Ministry for Education and Science, Research and Technology (BMBF), and the Fund of Fundamental Research of Russian Ministry of Science and Education and by INTAS-Grant No. 93-63
n supported by the Spanish Ministry of Education and Science through funds provided by CICYT
o supported by the Particle Physics and Astronomy Research Council
p supported by the US Department of Energy
q supported by the US National Science Foundation

1 Introduction

In comparison to fixed target neutrino scattering experiments [1], the HERA ep𝑒𝑝ep collider extends the kinematic region for studying charged–current (CC) deep inelastic scattering (DIS) by about two orders of magnitude in Q2superscript𝑄2Q^{2}. In addition, HERA allows measurements of CC DIS at lower x𝑥x (x<0.01𝑥0.01x<0.01). Here Q2superscript𝑄2Q^{2} is the negative square of the four–momentum transferred between the electron111In the following, “electron” is generically used to denote both electrons and positrons. and the proton, and x𝑥x is the Bjorken scaling variable.

Both the H1 [2] and ZEUS [3] collaborations have previously reported cross section measurements for the process epνeXsuperscript𝑒𝑝subscript𝜈𝑒𝑋e^{-}p\to\nu_{e}X, where X𝑋X denotes the hadronic final state. These investigations, based on the data collected in 1993, established that the Q2superscript𝑄2Q^{2} dependence of the CC cross section is consistent with that of the W𝑊W propagator and that the CC and neutral–current (NC) cross sections have similar magnitude for Q2

>

MW2

>

superscript𝑄2superscriptsubscript𝑀𝑊2
Q^{2}\mathchoice{\mathrel{\vbox{\hbox{$\lower 3.8pt\hbox{$\displaystyle>$}\atop{\raise 1.8pt\hbox{$\displaystyle\sim$}}$}}}}{\mathrel{\vbox{\hbox{$\lower 3.8pt\hbox{$\textstyle>$}\atop{\raise 1.8pt\hbox{$\textstyle\sim$}}$}}}}{\mathrel{\vbox{\hbox{$\lower 3.8pt\hbox{$\scriptstyle>$}\atop{\raise 1.8pt\hbox{$\scriptstyle\sim$}}$}}}}{\mathrel{\vbox{\hbox{$\lower 3.8pt\hbox{$\scriptscriptstyle>$}\atop{\raise 1.8pt\hbox{$\scriptscriptstyle\sim$}}$}}}}M_{W}^{2}
(MWsubscript𝑀𝑊M_{W} denotes the W𝑊W mass). The H1 collaboration has also measured the integrated cross section [4] and the differential cross section dσ/dQ2𝑑𝜎𝑑superscript𝑄2d\sigma/dQ^{2} [5] for e+pν¯eXsuperscript𝑒𝑝subscript¯𝜈𝑒𝑋e^{+}p\to{\overline{\nu}}_{e}X with missing transverse momentum (tsubscriptitalic-P̸𝑡\not{P}_{t}) above 25GeV25GeV25\,{\rm Ge}\kern-1.0pt{\rm V}.

In 1994 ZEUS has collected 2.93pb12.93superscriptpb12.93\,{\rm pb}^{-1} of e+psuperscript𝑒𝑝e^{+}p data and 0.27pb10.27superscriptpb10.27\,{\rm pb}^{-1} of epsuperscript𝑒𝑝e^{-}p data in collisions of 820GeV820GeV820\,{\rm Ge}\kern-1.0pt{\rm V} protons with 27.5GeV27.5GeV27.5\,{\rm Ge}\kern-1.0pt{\rm V} electrons. In order to study both e+superscript𝑒e^{+} and esuperscript𝑒e^{-} induced CC reactions, these data samples have been combined with the 0.55pb10.55superscriptpb10.55\,{\rm pb}^{-1} of epsuperscript𝑒𝑝e^{-}p data taken in 1993 with an electron beam energy of 26.7GeV26.7GeV26.7\,{\rm Ge}\kern-1.0pt{\rm V} [3].

In the quark parton model (including the leading order QCD evolution in Q2superscript𝑄2Q^{2}), the unpolarized e+psuperscript𝑒𝑝e^{+}p and epsuperscript𝑒𝑝e^{-}p charged–current differential cross sections are:222For the current integrated luminosity, any contributions to the CC cross section from hard subprocesses involving 3rdsuperscript3rd3^{\rm rd} generation quarks (b,t𝑏𝑡b,t) can be neglected. In this approximation the relation between quark densitites and CC structure functions is given by F2e+pν¯Xd+s+u¯+c¯proportional-tosuperscriptsubscript𝐹2superscript𝑒𝑝¯𝜈𝑋𝑑𝑠¯𝑢¯𝑐F_{2}^{e^{+}p\to{\overline{\nu}}X}\propto d+s+{\overline{u}}+{\overline{c}}, F2epνXu+c+d¯+s¯proportional-tosuperscriptsubscript𝐹2superscript𝑒𝑝𝜈𝑋𝑢𝑐¯𝑑¯𝑠F_{2}^{e^{-}p\to\nu X}\propto u+c+{\overline{d}}+{\overline{s}}, xF3e+pν¯Xd+su¯c¯proportional-to𝑥superscriptsubscript𝐹3superscript𝑒𝑝¯𝜈𝑋𝑑𝑠¯𝑢¯𝑐xF_{3}^{e^{+}p\to{\overline{\nu}}X}\propto d+s-{\overline{u}}-{\overline{c}} and xF3epνXu+cd¯s¯proportional-to𝑥superscriptsubscript𝐹3superscript𝑒𝑝𝜈𝑋𝑢𝑐¯𝑑¯𝑠xF_{3}^{e^{-}p\to\nu X}\propto u+c-{\overline{d}}-{\overline{s}}.

d2σe+pν¯XdxdQ2=GF22π(MW2MW2+Q2)2i=12[xu¯i(x,Q2)+(1y)2xdi(x,Q2)],superscript𝑑2subscript𝜎superscript𝑒𝑝¯𝜈𝑋𝑑𝑥𝑑superscript𝑄2superscriptsubscript𝐺𝐹22𝜋superscriptsuperscriptsubscript𝑀𝑊2superscriptsubscript𝑀𝑊2superscript𝑄22superscriptsubscript𝑖12delimited-[]𝑥subscript¯𝑢𝑖𝑥superscript𝑄2superscript1𝑦2𝑥subscript𝑑𝑖𝑥superscript𝑄2\frac{d^{2}\sigma_{e^{+}p\to{\overline{\nu}}X}}{dxdQ^{2}}=\frac{G_{F}^{2}}{2\pi}\left(\frac{M_{W}^{2}}{M_{W}^{2}+Q^{2}}\right)^{2}\,\sum_{i=1}^{2}\,\left[x\overline{u}_{i}(x,Q^{2})+(1-y)^{2}\,xd_{i}(x,Q^{2})\right]\;, (1)
d2σepνXdxdQ2=GF22π(MW2MW2+Q2)2i=12[xui(x,Q2)+(1y)2xd¯i(x,Q2)],superscript𝑑2subscript𝜎superscript𝑒𝑝𝜈𝑋𝑑𝑥𝑑superscript𝑄2superscriptsubscript𝐺𝐹22𝜋superscriptsuperscriptsubscript𝑀𝑊2superscriptsubscript𝑀𝑊2superscript𝑄22superscriptsubscript𝑖12delimited-[]𝑥subscript𝑢𝑖𝑥superscript𝑄2superscript1𝑦2𝑥subscript¯𝑑𝑖𝑥superscript𝑄2\frac{d^{2}\sigma_{e^{-}p\to\nu X}}{dxdQ^{2}}=\frac{G_{F}^{2}}{2\pi}\left(\frac{M_{W}^{2}}{M_{W}^{2}+Q^{2}}\right)^{2}\,\sum_{i=1}^{2}\,\left[xu_{i}(x,Q^{2})+(1-y)^{2}\,x\overline{d}_{i}(x,Q^{2})\right]\;, (2)

where uisubscript𝑢𝑖u_{i} and disubscript𝑑𝑖d_{i} are the densities of up–type and down–type quarks of the ithsuperscript𝑖thi^{\rm th} generation in the proton, GFsubscript𝐺𝐹G_{F} is the Fermi coupling constant, and y𝑦y is the fractional energy transfer to the proton in its rest system. The factor (1y)2superscript1𝑦2(1-y)^{2}, which suppresses the quark (antiquark) contribution to the e+psuperscript𝑒𝑝e^{+}p (epsuperscript𝑒𝑝e^{-}p) cross section, is a direct consequence of the V-A𝑉𝐴V\mathchar 512\relax A structure of the weak coupling.

As equations 1 and 2 show, the charged current couples to different quark flavors for e+superscript𝑒e^{+} and esuperscript𝑒e^{-} beams and the valence and sea contributions have very different y𝑦y dependences. In addition, the Q2superscript𝑄2Q^{2} dependence of the cross section allows a measurement of the W𝑊W propagator effect and thus a determination of the W𝑊W mass in the space–like region, complementing the measurements of direct W𝑊W production at pp¯𝑝¯𝑝p\overline{p} colliders [6].

This paper reports on measurements of the integrated and differential cross sections for both e+psuperscript𝑒𝑝e^{+}p and epsuperscript𝑒𝑝e^{-}p CC DIS in the kinematic region Q2>200GeV2superscript𝑄2200superscriptGeV2Q^{2}>200\,{\rm Ge}\kern-1.0pt{\rm V}^{2}. The differential cross sections were measured as functions of x𝑥x, y𝑦y and Q2superscript𝑄2Q^{2}, where the latter dependence was used to determine the W𝑊W mass. The available statistics allowed studies of the hadronic final state at high Q2superscript𝑄2Q^{2} in CC DIS: the jet rates and transverse energy jet profiles were determined and compared to Monte Carlo predictions. The number of events with two jets (plus the proton remnant) directly measures the rate of hard QCD subprocesses.

Recently, diffractive NC DIS has received particular attention [7][10]. These reactions are characterized by an absence of final state particles in a wide rapidity interval between the outgoing proton system (which escapes through the forward beam hole) and the rest of the hadronic final state. Such a rapidity gap results in a quiet region in the forward part of the main detector. Diffractive CC reactions are interesting because they predominantly occur at high Q2superscript𝑄2Q^{2} and also because they provide the possibility to study the flavor content of the states exchanged between proton and W𝑊W boson. A search for events with a rapidity gap in our CC samples yielded one candidate, which will be described in detail. The rate of large rapidity gap CC events was compared to model predictions and to the NC case.

After a brief summary of the experimental setup in section 2, the kinematics and the selection of CC events are described in section 3. The cross section calculations and the evaluation of the systematic uncertainties are outlined in section 4. Finally, section 5 contains the results, which are summarized in section 6.

2 Experimental Setup

In 1994, a total of 153 colliding bunches were stored in the electron and the proton beams of HERA, together with an additional 17 proton and 15 electron non–colliding bunches which were used to study beam induced backgrounds. The r.m.s. bunch length was about 20cm20cm20\,{\rm cm} for protons and 1cm1cm1\,{\rm cm} for electrons, resulting in an event vertex position distribution333The ZEUS coordinate system is right–handed with the Z𝑍Z axis pointing in the proton direction, hereafter referred to as forward, and the X𝑋X axis horizontal, pointing towards the center of HERA. with an r.m.s. width of 12cm12cm12\,{\rm cm} in Z𝑍Z. The typical instantaneous luminosity was 1.51030cm2s11.5superscript1030superscriptcm2superscripts11.5\cdot 10^{30}\,{\rm cm}^{-2}\,{\rm s}^{-1}. The following description refers to the 1994 running period. Details of the 1993 experimental setup and HERA running conditions can be found in [11].

2.1 The ZEUS Detector

A description of the ZEUS detector is available in [12, 13]. The primary components used in this analysis were the uranium–scintillator calorimeter [14] and the central tracking detectors.

The calorimeter is divided into three parts, forward (FCAL) covering the polar angle444The polar angle θ𝜃\theta is defined here with respect to the nominal interaction point. interval 2.6<θ<37superscript2.6𝜃superscript372.6^{\circ}\mathchar 316\relax\theta\mathchar 316\relax 37^{\circ}, the barrel (BCAL, 37<θ<129superscript37𝜃superscript12937^{\circ}\mathchar 316\relax\theta\mathchar 316\relax 129^{\circ}) and rear (RCAL, 129<θ<176.1superscript129𝜃superscript176.1129^{\circ}\mathchar 316\relax\theta\mathchar 316\relax 176.1^{\circ}). The calorimeters are subdivided into towers which subtend solid angles between 0.0060.0060.006 and 0.040.040.04 steradians. Each tower is longitudinally segmented into electromagnetic (EMC) and two hadronic (HAC) sections (one in RCAL). The electromagnetic layer of each tower is further subdivided transversely into four cells (two in RCAL). The total number of cells is 2172, 2592 and 1154 in FCAL, BCAL and RCAL, respectively. Under test beam conditions, the calorimeter has an energy resolution of σE/E=18%/E(GeV)subscript𝜎𝐸𝐸percent18𝐸GeV\sigma_{E}/E\mathchar 61\relax 18\%/\sqrt{E({\rm Ge}\kern-1.0pt{\rm V})} for electrons and σE/E=35%/E(GeV)subscript𝜎𝐸𝐸percent35𝐸GeV\sigma_{E}/E\mathchar 61\relax 35\%/\sqrt{E({\rm Ge}\kern-1.0pt{\rm V})} for hadrons. The time resolution is below 1ns1ns1\,{\rm ns} for energy deposits greater than 4.5GeV4.5GeV4.5\,{\rm Ge}\kern-1.0pt{\rm V}.

Energy which penetrates through the CAL can be measured in the Backing Calorimeter (BAC) which consists of proportional chambers interleaved with the iron plates which form the return yoke of the solenoid [15].555Due to the present limited understanding of the Monte Carlo simulation of energy deposits in the BAC, this component has been used only for systematic checks in this analysis.

The tracking system consists of a vertex detector [16] and a central tracking chamber (CTD) [17] operating in a 1.43T1.43T1.43\,{\rm T} magnetic field parallel to the beam axis. The polar angle region in which the CTD allows accurate momentum measurement is 15<θ<164superscript15𝜃superscript16415^{\circ}\mathchar 316\relax\theta\mathchar 316\relax 164^{\circ}. The transverse momentum resolution for full length tracks is σ(pt)/pt=[0.005pt(GeV)]0.016𝜎subscript𝑝𝑡subscript𝑝𝑡direct-sumdelimited-[]0.005subscript𝑝𝑡GeV0.016\sigma(p_{t})/p_{t}\mathchar 61\relax\left[0.005p_{t}({\rm Ge}\kern-1.0pt{\rm V})\right]\oplus 0.016.

The luminosity was measured by the rate of high energy photons from the process epepγ𝑒𝑝𝑒𝑝𝛾ep\to ep\gamma detected in a lead–scintillator calorimeter [18] located at Z=107m𝑍107mZ=-107\,{\rm m}.

2.2 Trigger Configuration

Data were collected with a three–level trigger system [13]. The first–level trigger conditions used in this analysis were based on electromagnetic energy, transverse energy, and missing transverse energy in the calorimeter. The thresholds were significantly below the corresponding cuts applied in the subsequent selection. The second level trigger rejected backgrounds (mostly p𝑝p–gas interactions and cosmic rays) for which the calorimeter timing was inconsistent with an ep𝑒𝑝ep interaction. Events were accepted as CC candidates if the following conditions were all fulfilled:

  1. 1.

    The missing transverse momentum tsubscriptitalic-P̸𝑡\not{P}_{t} exceeded 9GeV9GeV9\,{\rm Ge}\kern-1.0pt{\rm V} (see equation 3).

  2. 2.

    tsubscriptitalic-P̸𝑡\not{P}_{t} evaluated from all calorimeter cells except those adjacent to the forward beam pipe exceeded 8GeV8GeV8\,{\rm Ge}\kern-1.0pt{\rm V}.

  3. 3.

    Either a track was found in the CTD or at least 10GeV10GeV10\,{\rm Ge}\kern-1.0pt{\rm V} was deposited in the FCAL.

The third–level trigger applied stricter timing cuts and also pattern recognition algorithms to reject cosmic rays.

2.3 Monte Carlo Simulation

Simulated CC DIS events with electroweak radiative corrections were generated using lepto [19] interfaced to heracles [20] via django [21]. The MRSA set of NLO parton density parameterizations was used, which is based on preliminary 1993 F2subscript𝐹2F_{2} measurements by ZEUS and H1 as well as on recent data on W𝑊W asymmetries from CDF and on Drell–Yan cross sections (cf. [22] and the references therein). The latter measurements constrain the difference u¯d¯¯𝑢¯𝑑{\overline{u}}-{\overline{d}}, to which CC reactions are particularly sensitive. The hadronic final state was simulated using the color–dipole model as implemented in ariadne [23] for the QCD cascade and jetset [24] for the hadronization. In addition, MC samples using the meps option of lepto instead of ariadne were generated. Each of the CC MC samples contained about 104superscript10410^{4} events. The results were corrected for radiative effects using these CC MC sets666All kinematic quantities are inferred from the four–momentum of the propagator..

MC samples of NC DIS and photoproduction events were employed to simulate backgrounds to CC DIS. For the NC DIS simulation the same programs were used as for the CC events. Samples of both direct and resolved photoproduction events were generated using both pythia [24] and herwig [25]. Photoproduction of cc¯𝑐¯𝑐c{\overline{c}} and bb¯𝑏¯𝑏b{\overline{b}} pairs was simulated using both pythia and aroma [26].

To calculate efficiencies for diffractive CC interactions the pompyt [27] Monte Carlo program was used. This program is based on the factorizing model of Ingelman and Schlein [28] and assumes a hard quark density in the pomeron which satisfies the momentum sum rule.

All simulated events were passed through a geant based [29] detector simulation and processed with the same analysis programs as the data.

3 Kinematics and Event Selection

In CC ep𝑒𝑝ep reactions the final state neutrino remains undetected. This fact imposed special conditions both for the reconstruction of kinematic variables and for the event selection.

3.1 Kinematic Variables

The kinematics of the interaction epνX𝑒𝑝𝜈𝑋ep\to\nu X are defined by the four–momenta k𝑘k and P𝑃P of the incident electron and proton respectively, and the four–momentum of the final state neutrino (ksuperscript𝑘k^{\prime}) or the final state hadronic system (Psuperscript𝑃P^{\prime}). The four–momentum transfer between the electron and the proton is given by q=kk=PP𝑞𝑘superscript𝑘superscript𝑃𝑃q=k-k^{\prime}=P^{\prime}-P.

In addition to s=(k+P)2𝑠superscript𝑘𝑃2s=(k+P)^{2}, the square of the ep𝑒𝑝ep center of mass energy, three Lorentz invariants are defined in terms of these four–momenta:

  • Q2=q2superscript𝑄2superscript𝑞2\displaystyle Q^{2}=-q^{2}\;, the negative square of the four–momentum transfer,

  • x=Q22qP𝑥superscript𝑄22𝑞𝑃\displaystyle x={Q^{2}\over 2q\cdot P}\;, the Bjorken scaling variable,

  • y=qPkP𝑦𝑞𝑃𝑘𝑃\displaystyle y={q\cdot P\over k\cdot P}\;, the fractional energy transfer to the proton in its rest system.

Neglecting mass terms, these variables are related by Q2=xyssuperscript𝑄2𝑥𝑦𝑠Q^{2}=x\,y\,s.

The Jacquet–Blondel method [30] was used to reconstruct the kinematic variables from the measured missing transverse momentum,

t=(ipXi)2+(ipYi)2,subscriptitalic-P̸𝑡superscriptsubscript𝑖superscriptsubscript𝑝𝑋𝑖2superscriptsubscript𝑖superscriptsubscript𝑝𝑌𝑖2{\mbox{$\not{P}_{t}$}}=\sqrt{\left(\sum_{i}p_{X}^{i}\right)^{2}+\left(\sum_{i}p_{Y}^{i}\right)^{2}}\;, (3)

and the quantity δ𝛿\delta, given by

δ=i(EipZi),𝛿subscript𝑖superscript𝐸𝑖superscriptsubscript𝑝𝑍𝑖\delta=\sum_{i}\left(E^{i}-p_{Z}^{i}\right)\;, (4)

where the sums run over all EMC (HAC) cells with energy deposits Eisuperscript𝐸𝑖E^{i} above 60 MeV (110 MeV) and the pisuperscript𝑝𝑖\vec{p\,}^{i} are the momenta assigned to each calorimeter cell (calculated assuming zero mass and using the geometrical cell center and the measured vertex position). The Jacquet–Blondel estimators of y𝑦y, Q2superscript𝑄2Q^{2} and x𝑥x are given by

yJB=δ2Ee,QJB2=t21yJB,xJB=t2syJB(1yJB),formulae-sequencesubscript𝑦𝐽𝐵𝛿2subscript𝐸𝑒formulae-sequencesubscriptsuperscript𝑄2𝐽𝐵superscriptsubscriptitalic-P̸𝑡21subscript𝑦𝐽𝐵subscript𝑥𝐽𝐵superscriptsubscriptitalic-P̸𝑡2𝑠subscript𝑦𝐽𝐵1subscript𝑦𝐽𝐵y_{JB}={\delta\over 2E_{e}}\;,\qquad Q^{2}_{JB}={{\mbox{$\not{P}_{t}$}}^{2}\over 1-y_{JB}}\;,\qquad x_{JB}={{\mbox{$\not{P}_{t}$}}^{2}\over s\,y_{JB}(1-y_{JB})}\;, (5)

where Eesubscript𝐸𝑒E_{e} is the electron beam energy.

3.2 Selection of Charged–Current Events

The number of CC triggers was about 105superscript10510^{5}, almost entirely due to p𝑝p–gas interactions, cosmic rays, and beam halo muons. After a preselection which required a tracking vertex and stricter timing cuts than at the trigger level, about 6300 e+psuperscript𝑒𝑝e^{+}p and 1500 epsuperscript𝑒𝑝e^{-}p candidates remained (cf. table 1). In the following, we describe the cuts which were applied to extract the CC signal. Table 1 gives the numbers of events remaining after each selection cut, as well as the corresponding efficiencies estimated using the ariadne MC samples.

The following conditions were imposed on all events passing the trigger:

  • t>11GeVsubscriptitalic-P̸𝑡11GeV{\mbox{$\not{P}_{t}$}}>11\,{\rm Ge}\kern-1.0pt{\rm V} was required. The trigger simulation indicated that this cut was sufficiently far above the 9GeV9GeV9\,{\rm Ge}\kern-1.0pt{\rm V} trigger threshold to ensure high trigger efficiency.

  • The events had to have a tracking vertex with |Zvtx|<45cmsubscript𝑍vtx45cm|{Z_{\rm vtx}}|<45\,{\rm cm}, where Zvtx=0subscript𝑍vtx0{Z_{\rm vtx}}=0 at the nominal interaction point. This cut eliminated a large fraction of non–ep𝑒𝑝ep background.

  • tout/t>0.6superscriptsubscriptitalic-P̸𝑡outsubscriptitalic-P̸𝑡0.6{\mbox{$\not{P}_{t}$}}^{\rm out}/{\mbox{$\not{P}_{t}$}}>0.6 was required, where toutsuperscriptsubscriptitalic-P̸𝑡out{\mbox{$\not{P}_{t}$}}^{\rm out} is the net transverse momentum for all calorimeter cells with a polar angle above 9superscript99^{\circ} with respect to the nominal vertex position. This cut rejected p𝑝p–gas and p𝑝p–beampipe collisions, for which tsubscriptitalic-P̸𝑡\not{P}_{t} is concentrated at small polar angles.

  • There had to be at least one reconstructed track originating from the vertex, which had a polar angle between 15superscript1515^{\circ} and 164superscript164164^{\circ} and a transverse momentum exceeding 0.2GeV0.2GeV0.2\,{\rm Ge}\kern-1.0pt{\rm V}. This requirement removed cosmic ray events and p𝑝p–gas interactions with spurious vertices caused by low–energy secondary interactions in the beam pipe.

  • The difference ΔϕΔitalic-ϕ\Delta\phi between the azimuth of the net transverse momentum as measured by the CTD tracks with polar angle between 15superscript1515^{\circ} and 164superscript164164^{\circ}, and the azimuth measured by the calorimeter, was required to fulfill |Δϕ|<1radΔitalic-ϕ1rad|\Delta\phi|<1\,{\rm rad}. This requirement removed overlays of cosmic rays on ep𝑒𝑝ep–interactions.

  • In addition, a pattern recognition algorithm based on the topology of the calorimeter energy distribution was applied to reject cosmic rays and beam halo muons.

Simulation of backgrounds due to NC DIS and photoproduction interactions showed that such events passing the above cuts were concentrated at low tsubscriptitalic-P̸𝑡\not{P}_{t}. The same was found for the non–ep𝑒𝑝ep background. Hence the following additional cuts were applied to events with t<30GeVsubscriptitalic-P̸𝑡30GeV{\mbox{$\not{P}_{t}$}}<30\,{\rm Ge}\kern-1.0pt{\rm V}:

  • yJB<0.8subscript𝑦𝐽𝐵0.8y_{JB}<0.8, which reduced NC DIS background.

  • t/Et>0.4subscriptitalic-P̸𝑡subscript𝐸𝑡0.4{\mbox{$\not{P}_{t}$}}/E_{t}>0.4, where Et=i(pXi)2+(pYi)2subscript𝐸𝑡subscript𝑖superscriptsuperscriptsubscript𝑝𝑋𝑖2superscriptsuperscriptsubscript𝑝𝑌𝑖2E_{t}=\sum_{i}\sqrt{(p_{X}^{i})^{2}+(p_{Y}^{i})^{2}} is the total transverse energy. This cut demanded an azimuthally collimated energy flow and rejected photoproduction and also p𝑝p–gas background.

  • Pttracks/t>0.1superscriptsubscript𝑃𝑡trackssubscriptitalic-P̸𝑡0.1P_{t}^{\rm tracks}/{\mbox{$\not{P}_{t}$}}>0.1, where Pttracks=(jPXtrackj)2+(jPYtrackj)2superscriptsubscript𝑃𝑡trackssuperscriptsubscript𝑗superscriptsubscript𝑃𝑋track𝑗2superscriptsubscript𝑗superscriptsubscript𝑃𝑌track𝑗2P_{t}^{\rm tracks}=\sqrt{\left(\sum_{j}P_{X}^{{\rm track}\,j}\right)^{2}+\left(\sum_{j}P_{Y}^{{\rm track}\,j}\right)^{2}} and j𝑗j runs over all vertex–fitted tracks with polar angle between 15superscript1515^{\circ} and 164superscript164164^{\circ}. This cut effectively tightened the tout/tsuperscriptsubscriptitalic-P̸𝑡outsubscriptitalic-P̸𝑡{\mbox{$\not{P}_{t}$}}^{\rm out}/{\mbox{$\not{P}_{t}$}} requirement (cf. above) and also removed events with additional non–ep𝑒𝑝ep related energy deposits in the calorimeter (mainly cosmic rays).

The resulting sample was visually scanned and 3 non–ep𝑒𝑝ep background events were identified in the e+psuperscript𝑒𝑝e^{+}p sample and removed (all were overlays of muons and p𝑝p–gas reactions). No non–ep𝑒𝑝ep background was found in the epsuperscript𝑒𝑝e^{-}p sample. The distribution in x𝑥x and Q2superscript𝑄2Q^{2} of the final samples of 56 e+psuperscript𝑒𝑝e^{+}p events and 30 epsuperscript𝑒𝑝e^{-}p events is shown in figure 1.

3.3 The Neutral–Current Control Sample

The acceptance corrections and the methods of reconstructing the kinematic variables were based on the MC simulation described in section 2.3. In order to verify the accuracy of the simulation, several systematic checks were performed using a sample777Data collected in 1994 were used. of high–Q2superscript𝑄2Q^{2} NC events selected as follows:

  • As in the CC case (cf. section 2.2), the NC trigger requirements were based on the calorimeter energy deposits. The same timing cuts were applied as for the CC trigger. Photoproduction background was efficiently suppressed by the cut δ>25GeV𝛿25GeV\delta>25\,{\rm Ge}\kern-1.0pt{\rm V} (cf. eq. 4).

  • In the offline NC selection, an electron candidate with at least 10GeV10GeV10\,{\rm Ge}\kern-1.0pt{\rm V} energy had to be identified by a neural–network algorithm using the pattern of the calorimeter energy deposits [31]. The electron had to be isolated (less than 2GeV2GeV2\,{\rm Ge}\kern-1.0pt{\rm V} of energy not associated with the electron in an (η,ϕ)𝜂italic-ϕ(\eta,\phi)–cone888The pseudorapidity η𝜂\eta is defined as ln[tan(θ/2)]𝜃2-\ln[\tan(\theta/2)], where θ𝜃\theta is the polar angle with respect to the proton beam direction, taken from the reconstructed interaction point. of radius R=0.5𝑅0.5R=0.5 centered on the electron direction) and had to have a matching track if it was in the region 20<θ<160superscript20𝜃superscript16020^{\circ}<\theta<160^{\circ}. In addition, the event had to have a reconstructed tracking vertex, and satisfy 35GeV<δ<65GeV35GeV𝛿65GeV35\,{\rm Ge}\kern-1.0pt{\rm V}<\delta<65\,{\rm Ge}\kern-1.0pt{\rm V} and Q2>200GeV2superscript𝑄2200superscriptGeV2Q^{2}>200\,{\rm Ge}\kern-1.0pt{\rm V}^{2}, where Q2superscript𝑄2Q^{2} was reconstructed using the double angle (DA) method [32].

  • For the selected NC events, the track(s) and the calorimeter deposits associated with the electron were deleted from the data, and the reconstruction of the event vertex was repeated.

  • These modified NC events were then processed through the complete CC analysis chain. In order to account for the different cross sections, a weight

    w=dσe+pν¯X/dxdQ2dσe+pe+X/dxdQ2for e+presp.w=dσepνX/dxdQ2dσepeX/dxdQ2for epformulae-sequence𝑤𝑑subscript𝜎superscript𝑒𝑝¯𝜈𝑋𝑑𝑥𝑑superscript𝑄2𝑑subscript𝜎superscript𝑒𝑝superscript𝑒𝑋𝑑𝑥𝑑superscript𝑄2for e+presp.𝑤𝑑subscript𝜎superscript𝑒𝑝𝜈𝑋𝑑𝑥𝑑superscript𝑄2𝑑subscript𝜎superscript𝑒𝑝superscript𝑒𝑋𝑑𝑥𝑑superscript𝑄2for epw={d\sigma_{e^{+}p\to{\overline{\nu}}X}/dx\,dQ^{2}\over d\sigma_{e^{+}p\to e^{+}X}/dx\,dQ^{2}}\quad\hbox{for $e^{+}p$}\qquad\hbox{resp.}\qquad w={d\sigma_{e^{-}p\to\nu X}/dx\,dQ^{2}\over d\sigma_{e^{-}p\to e^{-}X}/dx\,dQ^{2}}\quad\hbox{for $e^{-}p$}

    was assigned to each event, where leading order differential cross sections, evaluated at x𝑥x and Q2superscript𝑄2Q^{2} as reconstructed by the double angle method, were used.

    After the CC selection, 2269 e+psuperscript𝑒𝑝e^{+}p and 167 epsuperscript𝑒𝑝e^{-}p events with Q2>200GeV2superscript𝑄2200superscriptGeV2Q^{2}>200\,{\rm Ge}\kern-1.0pt{\rm V}^{2} remained, where Q2superscript𝑄2Q^{2} was reconstructed as described in section 4.1. The respective sums of weights were 50.850.850.8 and 6.26.26.2.

The control sample was not corrected for the efficiency of the NC event selection, for remaining backgrounds, or for migrations due to mismeasurement of x𝑥x and Q2superscript𝑄2Q^{2}. The distributions of QJB2subscriptsuperscript𝑄2𝐽𝐵Q^{2}_{JB}, xJBsubscript𝑥𝐽𝐵x_{JB}, yJBsubscript𝑦𝐽𝐵y_{JB} and tsubscriptitalic-P̸𝑡\not{P}_{t} agreed sufficiently well with the corresponding CC MC distributions to allow for quantitative checks of the efficiency calculations and correction methods.

4 Cross Section Evaluation

The integrated and differential cross sections were calculated from the observed numbers of events and the integrated luminosity after subtracting the estimated photoproduction background and correcting for detection efficiencies and migrations.

The epsuperscript𝑒𝑝e^{-}p data from 1993 and 1994 were combined by appropriately weighting the 1993 event numbers in each individual bin under consideration. The weights, which account for slight differences in the electron beam energies and in the trigger and detector configurations, were in the range between 0.950.950.95 and 1.051.051.05.

All statistical errors have been evaluated using the observed numbers of events and asymmetric Poisson confidence intervals.

4.1 Reconstruction of Kinematic Variables

Due to the energy loss of the hadrons in inactive material in the central detector, the calorimeter measurement underestimated both tsubscriptitalic-P̸𝑡\not{P}_{t} and δ𝛿\delta. The detector simulation was used to derive corrected values tcorsubscriptsubscriptitalic-P̸𝑡cor{\mbox{$\not{P}_{t}$}}_{\,\rm cor} and ycorsubscript𝑦cory_{\rm cor}, as second–order polynomials of the respective raw values tsubscriptitalic-P̸𝑡\not{P}_{t} and yJBsubscript𝑦𝐽𝐵y_{JB}, where the coefficients for the y𝑦y correction depend on tsubscriptitalic-P̸𝑡\not{P}_{t}. The correction of tsubscriptitalic-P̸𝑡\not{P}_{t} was about 20%percent2020\% at low tsubscriptitalic-P̸𝑡\not{P}_{t}, decreasing to 10%absentpercent10\approx 10\% for t

>

50GeV

>

subscriptitalic-P̸𝑡50GeV
{\mbox{$\not{P}_{t}$}}\mathchoice{\mathrel{\vbox{\hbox{$\lower 3.8pt\hbox{$\displaystyle>$}\atop{\raise 1.8pt\hbox{$\displaystyle\sim$}}$}}}}{\mathrel{\vbox{\hbox{$\lower 3.8pt\hbox{$\textstyle>$}\atop{\raise 1.8pt\hbox{$\textstyle\sim$}}$}}}}{\mathrel{\vbox{\hbox{$\lower 3.8pt\hbox{$\scriptstyle>$}\atop{\raise 1.8pt\hbox{$\scriptstyle\sim$}}$}}}}{\mathrel{\vbox{\hbox{$\lower 3.8pt\hbox{$\scriptscriptstyle>$}\atop{\raise 1.8pt\hbox{$\scriptscriptstyle\sim$}}$}}}}50\,{\rm Ge}\kern-1.0pt{\rm V}
; in y𝑦y, the corrections were highest for y0.1𝑦0.1y\approx 0.1 and low tsubscriptitalic-P̸𝑡\not{P}_{t} (20%absentpercent20\approx 20\%), decreasing with both increasing y𝑦y and increasing tsubscriptitalic-P̸𝑡\not{P}_{t}. The corrected values Q2corsubscriptsuperscript𝑄2cor{Q^{2}}_{\rm cor} and xcorsubscript𝑥corx_{\rm cor} were calculated in terms of tcorsubscriptsubscriptitalic-P̸𝑡cor{\mbox{$\not{P}_{t}$}}_{\,\rm cor} and ycorsubscript𝑦cory_{\rm cor} using equation 5.

The correction was tested using the NC control sample (cf. section 3.3) by evaluating the means and widths of the distributions of δA=(AcorADA)/ADA𝛿𝐴subscript𝐴corsubscript𝐴𝐷𝐴subscript𝐴𝐷𝐴\delta A=(A_{\rm cor}-A_{DA})/A_{DA} for A=Q2,x𝐴superscript𝑄2𝑥A=Q^{2},x or y𝑦y in all intervals of these variables (cf. section 4.2). Typically, the mean values were below 10%percent1010\% for x𝑥x and Q2superscript𝑄2Q^{2} and below 5%percent55\% for y𝑦y; the r.m.s. widths were roughly 20%percent2020\% for x𝑥x, 25%percent2525\% for Q2superscript𝑄2Q^{2}, and 10%percent1010\% for y𝑦y. In the highest x𝑥x and Q2superscript𝑄2Q^{2} bins, these estimates are based on only a few NC events and hence are of limited statistical significance.

4.2 Choice of Intervals

The kinematic ranges of the variables x𝑥x, y𝑦y and Q2superscript𝑄2Q^{2} covered by this analysis are x>0.006𝑥0.006x\mathchar 318\relax 0.006, 0<y<10𝑦10\mathchar 316\relax y\mathchar 316\relax 1 and Q2>200GeV2superscript𝑄2200superscriptGeV2Q^{2}\mathchar 318\relax 200\,{\rm Ge}\kern-1.0pt{\rm V}^{2}. For the measurement of differential cross sections in x𝑥x and Q2superscript𝑄2Q^{2}, equal bins in log(x)𝑥\log(x) and log(Q2)superscript𝑄2\log(Q^{2}) respectively were used (see tables 23 and 4). The y𝑦y range was subdivided in 5 equal intervals. These choices of bins provided roughly equal numbers of events in all intervals and ensured that the intervals were much wider than the experimental resolutions and the systematic shifts described in section 4.1.

4.3 Background Subtraction

The contamination from NC events, estimated using a lepto Monte Carlo sample [19], was negligible. The background from photoproduction processes was determined by applying the selection algorithm to photoproduction events, simulated with herwig, which had transverse energy Et>20GeVsubscript𝐸𝑡20GeVE_{t}>20\,{\rm Ge}\kern-1.0pt{\rm V} (Etsubscript𝐸𝑡E_{t} being determined from the momenta of all final state particles). While the simulated photoproduction events which passed the CC selection all had Et>30GeVsubscript𝐸𝑡30GeVE_{t}>30\,{\rm Ge}\kern-1.0pt{\rm V}, they were concentrated at low tsubscriptitalic-P̸𝑡\not{P}_{t}. The estimated photoproduction contamination in the lowest bins of x𝑥x and Q2superscript𝑄2Q^{2} was 15%similar-toabsentpercent15\sim 15\%.

No event passing the CC selection was found in the MC samples simulating heavy quark photoproduction, yielding an upper limit on the cross section for this background of less than 0.2%percent0.20.2\% of the CC cross section. The heavy quark background is therefore neglected.

No subtraction has been applied for non–ep𝑒𝑝ep background (cosmic and beam halo muons, p𝑝p–gas reactions, and overlays of such events with ep𝑒𝑝ep reactions). This background is negligible after event selection and visual scanning (cf. section 3.2).

4.4 Acceptance Correction and Unfolding

Bin–to–bin migrations and the efficiencies of trigger and selection cuts were taken into account using a bin–by–bin correction method, where the correction factors were calculated from the Monte Carlo simulation described in section 2. Typical acceptance corrections range from 40%percent4040\% to 80%percent8080\%, with an average of about 60%percent6060\% (cf. tables 1 and 2 to 5). The statistical errors of the correction factors were about 10 times smaller than the statistical errors of the data and have been neglected. In addition to the acceptance corrections, ζ𝜁\zeta, defined as the ratio of the number of events reconstructed in a given bin to the number of events generated in the same bin, tables 2 to 5 also show the purities, ξ𝜉\xi, defined as the fraction of the events reconstructed in a given bin which were also generated in the same bin.

The efficiency calculation was checked using the NC control sample. Both the overall acceptances and those of individual cuts (cf. table 1) typically agreed with the MC values within 5%percent55\%.

The bin–by–bin unfolding procedure described above was cross checked by applying a single step matrix unfolding based on Bayes’ theorem [33]. The off–diagonal elements of the unfolding matrix were usually less than 25%percent2525\% of the corresponding diagonal elements, indicating that migrations between bins were small. In cases where the data are poorly modeled by the MC or where migrations play a dominant rôle, the two methods are expected to yield significantly different results. The resulting differences were however found to be well below the statistical errors. They are included in the systematic uncertainties (cf. tables 2 and 3).

4.5 Systematic Uncertainties

In the following, we summarize the studies which were performed in order to estimate the systematic uncertainties. For the case of dσ/dQ2𝑑𝜎𝑑superscript𝑄2d\sigma/dQ^{2}, the dominant systematic uncertainties are detailed in tables 2 and 3. The remaining systematic errors were all below 5%percent55\% and typically below 1%percent11\%. Where appropriate, independent checks of systematic uncertainties have been calculated using the NC control sample. The systematic deviations observed in this sample agreed well with the values quoted below.

  • In the detector simulation, the calorimeter energy scale was varied by ±3%plus-or-minuspercent3\pm 3\% (±5%plus-or-minuspercent5\pm 5\% in the FCAL), corresponding to the level at which it is currently understood. Using the BAC it was checked that this variation also covers possible effects due to energy leakage out of the CAL. Using the BAC energy deposits to correct jet energies in CC events increased tsubscriptitalic-P̸𝑡\not{P}_{t} by about 2%percent22\% on average.

    Such an energy scale uncertainty gives rise to uncertainties in the cross section which are typically between 5% and 10%, but can be up to 30%percent3030\% in the highest Q2superscript𝑄2Q^{2} and y𝑦y bins.

  • The systematic uncertainty of the photoproduction background subtraction was estimated as the quadratic sum of its statistical error and an additional ±50%plus-or-minuspercent50\pm 50\% uncertainty which accounted for differences between Etsubscript𝐸𝑡E_{t} and t/Etsubscriptitalic-P̸𝑡subscript𝐸𝑡{\mbox{$\not{P}_{t}$}}/E_{t} spectra of photoproduction data and MC.

    The uncertainty of the background estimate mainly affected the lowest Q2superscript𝑄2Q^{2} and x𝑥x bins. It was the dominant systematic error in the lowest x𝑥x bin for e+psuperscript𝑒𝑝e^{+}p reactions.

  • The reconstruction of the kinematic variables was modified in the following way: in each bin999For tsubscriptitalic-P̸𝑡\not{P}_{t}, the bin boundaries were 0-20-30-40-50-GeV020304050GeV0\mathchar 512\relax 20\mathchar 512\relax 30\mathchar 512\relax 40\mathchar 512\relax 50\mathchar 512\relax\infty\,{\rm Ge}\kern-1.0pt{\rm V}. of A=t𝐴subscriptitalic-P̸𝑡A={\mbox{$\not{P}_{t}$}} or y𝑦y the reconstructed values of tsubscriptitalic-P̸𝑡\not{P}_{t} and y𝑦y were multiplied with 1/(1+δA)11delimited-⟨⟩𝛿𝐴1/(1+\langle\delta A\rangle) (cf. section 4.1), where δA𝛿𝐴\delta A was averaged over the weighted NC control sample events in this bin. This corresponded to correcting on average to the DA values as derived from the NC control sample. Q2superscript𝑄2Q^{2}, x𝑥x and y𝑦y were calculated from the resulting values using equations 5. This changed the measured cross sections by 10%percent1010\% or less, except in the lowest and highest Q2superscript𝑄2Q^{2} bins, where variations of up to 15%percent1515\% were seen.

  • In order to check the simulation of the tracking, the combined acceptance of all cuts using tracking information was evaluated for the NC control sample, in each interval of Q2superscript𝑄2Q^{2}, x𝑥x and y𝑦y, both for data and for simulated NC events. The data/MC ratio of these acceptances was found to be consistent with unity. In almost all bins the deviation was less than 3%percent33\%, which was used as the overall systematic uncertainty.

  • A one step Bayes unfolding was used instead of the bin–by–bin unfolding (cf. discussion in section 4.4). This variation caused uncertainties of 1015%10percent1510-15\% in the lowest and the highest bins of Q2superscript𝑄2Q^{2}, x𝑥x and y𝑦y (25%percent25-25\% in the highest y𝑦y bin for e+psuperscript𝑒𝑝e^{+}p).

  • In the trigger simulation, the first level trigger thresholds were increased to a level where the measured trigger efficiencies were close to 100%percent100100\%. Except in the lowest Q2superscript𝑄2Q^{2} bins, where effects up to 4%percent44\% were observed, this had a negligible effect indicating that the efficiency calculations were insensitive to the detailed shape of the trigger turn–on curves.

  • In order to test the sensitivity to the details of the parton shower simulation, the meps model was used instead of the ariadne MC for calculating acceptance corrections and for unfolding. This affected the cross section results only negligibly.

    In addition, the selection cuts on tsubscriptitalic-P̸𝑡\not{P}_{t}, ΔϕΔitalic-ϕ\Delta\phi, the track requirements, and the cuts at low tsubscriptitalic-P̸𝑡\not{P}_{t} have been varied using the meps MC sample instead of the data, and the ariadne sets for acceptance corrections and unfolding. This tested whether the simulated shapes of the relevant distributions differ in the vicinities of these cuts.

    Each of the cut variations changed the results by less than typically 1%percent11\%, except the tsubscriptitalic-P̸𝑡\not{P}_{t} variation in the lowest x𝑥x and Q2superscript𝑄2Q^{2} bins (up to 5%percent55\%) and the track requirement (up to 3%percent33\% in some bins).

  • Different parton distribution functions (MRSD0 [34], MRSDsuperscriptsubscriptabsent{}_{-}^{\prime} [35], GRV [36] and CTEQ 2pM [37]) were used in the MC samples used for the acceptance corrections.101010The most significant variation of the Standard Model cross section prediction due to parton distributions is seen in dσ/dx𝑑𝜎𝑑𝑥d\sigma/dx at 0.01

    <

    x

    <

    0.1

    <

    0.01𝑥

    <

    0.1
    0.01\mathchoice{\mathrel{\vbox{\hbox{$\lower 3.8pt\hbox{$\displaystyle<$}\atop{\raise 1.8pt\hbox{$\displaystyle\sim$}}$}}}}{\mathrel{\vbox{\hbox{$\lower 3.8pt\hbox{$\textstyle<$}\atop{\raise 1.8pt\hbox{$\textstyle\sim$}}$}}}}{\mathrel{\vbox{\hbox{$\lower 3.8pt\hbox{$\scriptstyle<$}\atop{\raise 1.8pt\hbox{$\scriptstyle\sim$}}$}}}}{\mathrel{\vbox{\hbox{$\lower 3.8pt\hbox{$\scriptscriptstyle<$}\atop{\raise 1.8pt\hbox{$\scriptscriptstyle\sim$}}$}}}}x\mathchoice{\mathrel{\vbox{\hbox{$\lower 3.8pt\hbox{$\displaystyle<$}\atop{\raise 1.8pt\hbox{$\displaystyle\sim$}}$}}}}{\mathrel{\vbox{\hbox{$\lower 3.8pt\hbox{$\textstyle<$}\atop{\raise 1.8pt\hbox{$\textstyle\sim$}}$}}}}{\mathrel{\vbox{\hbox{$\lower 3.8pt\hbox{$\scriptstyle<$}\atop{\raise 1.8pt\hbox{$\scriptstyle\sim$}}$}}}}{\mathrel{\vbox{\hbox{$\lower 3.8pt\hbox{$\scriptscriptstyle<$}\atop{\raise 1.8pt\hbox{$\scriptscriptstyle\sim$}}$}}}}0.1
    (cf. section 5.1).
    The resulting variations were small and have been neglected.

The overall systematic uncertainty for each result (including ratios of cross sections and the W𝑊W mass) was calculated by evaluating the variation of this result due to each of the modifications of the analysis procedure described above (including the luminosity uncertainties of ±2.0%plus-or-minuspercent2.0\pm 2.0\% for the e+psuperscript𝑒𝑝e^{+}p sample and ±3.0%plus-or-minuspercent3.0\pm 3.0\% for the epsuperscript𝑒𝑝e^{-}p sample) and then separately summing in quadrature the positive and negative deviations.

5 Results

The results will be presented in three sections: cross sections and the determination of MWsubscript𝑀𝑊M_{W}, jet rates and profiles, and finally the search for events with a large rapidity gap. The abbreviation ‘SM’ (for Standard Model) is used to indicate the theoretical predictions. Unless otherwise noted, these were estimated using lepto and the MRSA parton distributions. The propagator four–momentum was used to calculate kinematic quantitites.

5.1 Cross Sections and Cross Section Ratios

Differential cross sections as functions of Q2x and y¯¯Differential cross sections as functions of Q2x and y\underline{\hbox{Differential cross sections as functions of $Q^{2}$, $x$ and $y$\hbox{\vrule height=7.10411pt,depth=2.08818pt,width=0.0pt}}}

The values of the cross section, σisubscript𝜎𝑖\sigma_{i}, in bins of Q2superscript𝑄2Q^{2}, for e+psuperscript𝑒𝑝e^{+}p and epsuperscript𝑒𝑝e^{-}p data, are listed in tables 2 and 3 respectively. Also shown are the dominant systematic errors as described in section 4.5. The results are plotted in figure 2a, where the SM predictions are also shown.

The results for Q2>200GeV2superscript𝑄2200superscriptGeV2Q^{2}\mathchar 318\relax 200\,{\rm Ge}\kern-1.0pt{\rm V}^{2} in bins of x𝑥x and y𝑦y are given in tables 4 and 5. The differential CC cross sections are shown in figures 3a and 4a together with the corresponding SM predictions.

Figures 2b, 3b and 4b show the ratios σe+pν¯X/σepνXsubscript𝜎superscript𝑒𝑝¯𝜈𝑋subscript𝜎superscript𝑒𝑝𝜈𝑋\sigma_{e^{+}p\to{\overline{\nu}}X}/\sigma_{e^{-}p\to\nu X} as functions of the respective variables. The curves again represent the SM predictions.

Several observations can be made:

  • No significant deviations of the measured cross sections from the SM predictions are observed. This is quantified by the χ2superscript𝜒2\chi^{2} values which are listed in table 6.

  • The differential cross sections dσ/dQ2𝑑𝜎𝑑superscript𝑄2d\sigma/d\,Q^{2} fall steeply with Q2superscript𝑄2Q^{2} (cf. figure 2), reflecting the influence of the W𝑊W propagator, the decrease of the parton densities with increasing x=Q2/sy𝑥superscript𝑄2𝑠𝑦x=Q^{2}/sy, and the (1y)2superscript1𝑦2(1-y)^{2} terms in the cross section. The differences between the e+psuperscript𝑒𝑝e^{+}p and epsuperscript𝑒𝑝e^{-}p cross sections are due to the different x𝑥x and y𝑦y behavior (cf. discussion below).

  • As can be seen from figure 3, at low x𝑥x, dσ/dx𝑑𝜎𝑑𝑥d\sigma/d\,x is about the same for e+psuperscript𝑒𝑝e^{+}p and epsuperscript𝑒𝑝e^{-}p scattering. This reflects the fact that the cross sections (equations 1,2) become equal if valence quark distributions can be neglected and if d¯(x,Q2)=u¯(x,Q2)¯𝑑𝑥superscript𝑄2¯𝑢𝑥superscript𝑄2\,{\overline{d}}(x,Q^{2})={\overline{u}}(x,Q^{2}).

    The decrease of dσ/dx𝑑𝜎𝑑𝑥d\sigma/d\,x with increasing x𝑥x is more rapid for e+psuperscript𝑒𝑝e^{+}p scattering than for epsuperscript𝑒𝑝e^{-}p scattering. This behavior is also expected from equations 1 and 2: in e+psuperscript𝑒𝑝e^{+}p reactions, scattering on valence quarks is reduced by the (1y)2superscript1𝑦2(1-y)^{2} factor; in addition, the e+superscript𝑒e^{+} couples to d(x,Q2)𝑑𝑥superscript𝑄2d(x,Q^{2}), which is suppressed at high x𝑥x relative to u(x,Q2)𝑢𝑥superscript𝑄2u(x,Q^{2}) which is relevant for epsuperscript𝑒𝑝e^{-}p scattering (cf. e.g. [38]).

    The x𝑥x dependence of the e+psuperscript𝑒𝑝e^{+}p to the epsuperscript𝑒𝑝e^{-}p cross section ratio is illustrated by the ratios for x<0.1𝑥0.1x<0.1 and for x>0.1𝑥0.1x>0.1 (with Q2>200superscript𝑄2200Q^{2}>200 GeV2):

    σe+pν¯XσepνX={0.91[stat]0.27+0.41±0.04[syst] for 0<x<0.10.26[stat]0.09+0.14±0.01[syst] for 0.1<x<1.{\sigma_{e^{+}p\to{\overline{\nu}}X}\over\sigma_{e^{-}p\to\nu X}}=\cases{{\displaystyle 0.91\,{}^{+0.41}_{-0.27}\,{\rm[stat]}\pm 0.04\,{\rm[syst]}}&\quad{\rm for}\quad\vrule height=8.61108pt,depth=12.05553pt,width=0.0pt$0<x<0.1$\cr{\displaystyle 0.26\,{}^{+0.14}_{-0.09}\,{\rm[stat]}\pm 0.01\,{\rm[syst]}}&\quad{\rm for}\quad\vrule height=12.05553pt,depth=8.61108pt,width=0.0pt$0.1<x<1\;.$}

    The corresponding SM predictions are 0.640.640.64 and 0.320.320.32. The measured ratios confirm the suppression of the e+psuperscript𝑒𝑝e^{+}p CC cross section at high x𝑥x.

    The SM predictions for dσ/dx𝑑𝜎𝑑𝑥d\sigma/d\,x have also been evaluated using different parton distribution functions (MRSDsuperscriptsubscriptabsent{}_{-}^{\prime}, GRV, CTEQ 2pM). The largest differences have been observed between the sets MRSDsuperscriptsubscriptabsent{}_{-}^{\prime} and CTEQ 2pM for x𝑥x between 0.01 and 0.1, where the cross section predicted by MRSDsuperscriptsubscriptabsent{}_{-}^{\prime} is up to 10%percent1010\% lower than the CTEQ 2pM values, both for e+psuperscript𝑒𝑝e^{+}p and epsuperscript𝑒𝑝e^{-}p scattering. The MRSA, CTEQ 2pM and GRV predictions agree to better than 5%percent55\%.

  • The measured differential cross sections dσ/dy𝑑𝜎𝑑𝑦d\sigma/d\,y agree with the theoretical predictions. The SM curves in figure 4 reveal that the expected shapes are very similar for e+psuperscript𝑒𝑝e^{+}p and epsuperscript𝑒𝑝e^{-}p scattering, indicating that the relative contributions of the (1y)2superscript1𝑦2(1-y)^{2} terms are about equal in both cases.

    As y1𝑦1y\to 1, the cross section ratio e+p/epsuperscript𝑒𝑝superscript𝑒𝑝e^{+}p/e^{-}p is given by 1/(uvus+c+1)1subscript𝑢𝑣subscript𝑢𝑠𝑐11/\left({\displaystyle u_{v}\over\displaystyle u_{s}+c}+1\right) (assuming u¯=us¯𝑢subscript𝑢𝑠{\overline{u}}=u_{s} and c¯=c¯𝑐𝑐{\overline{c}}=c, the indices v𝑣v and s𝑠s indicating valence and sea quark distributions, respectively). The fact that the prediction, corresponding to uv/(us+c)1subscript𝑢𝑣subscript𝑢𝑠𝑐1u_{v}/(u_{s}+c)\approx 1, is above the data for y>0.4𝑦0.4y>0.4, is only moderately significant in view of the large errors.

    At y0𝑦0y\to 0, the cross section ratio e+p/epsuperscript𝑒𝑝superscript𝑒𝑝e^{+}p/e^{-}p approaches (dv+S)/(uv+S)subscript𝑑𝑣𝑆subscript𝑢𝑣𝑆(d_{v}+S)/(u_{v}+S), where S=ds+us+s+c𝑆subscript𝑑𝑠subscript𝑢𝑠𝑠𝑐S=d_{s}+u_{s}+s+c (assuming again that the quark and antiquark sea distributions are identical for each flavor).

In order to further study the influence of the V-A𝑉𝐴V\mathchar 512\relax A helicity structure and the parton distributions, figure 5 shows dσ/dy𝑑𝜎𝑑𝑦d\sigma/d\,y separately for x<0.1𝑥0.1x<0.1 (where sea quarks dominate the cross section) and for x>0.1𝑥0.1x>0.1 (where the valence contribution is larger). Here three equal size y𝑦y bins are used.

For low x𝑥x, the predicted y𝑦y shapes are similar for e+psuperscript𝑒𝑝e^{+}p and epsuperscript𝑒𝑝e^{-}p scattering, the differences being mainly due to residual valence contributions. The most significant deviation of the measured cross sections from the prediction is observed in the lowest y𝑦y bin (y<0.33𝑦0.33y<0.33), where the measured σepνXsubscript𝜎superscript𝑒𝑝𝜈𝑋\sigma_{e^{-}p\to\nu X} is about two standard deviations below the SM prediction.

For x>0.1𝑥0.1x>0.1, both the e+psuperscript𝑒𝑝e^{+}p and the epsuperscript𝑒𝑝e^{-}p cross sections decrease with increasing y𝑦y. For epsuperscript𝑒𝑝e^{-}p, this can be attributed to residual sea quark contributions and to the W𝑊W propagator which enters via the dependence of the average Q2superscript𝑄2Q^{2} on y𝑦y. For e+psuperscript𝑒𝑝e^{+}p scattering, the decrease of dσ/dy𝑑𝜎𝑑𝑦d\sigma/d\,y with increasing y𝑦y is even faster due to the (1y)2superscript1𝑦2(1-y)^{2} term in the cross section. All measured values are compatible with the predictions, indicating that the slight deviations observed at y0.3similar-to𝑦0.3y\sim 0.3 in the e+p/epsuperscript𝑒𝑝superscript𝑒𝑝e^{+}p/e^{-}p ratios are due to the low–x𝑥x data.

Integrated cross sections for Q2>200GeV2¯¯Integrated cross sections for Q2>200GeV2\underline{\hbox{Integrated cross sections for $Q^{2}>200\,{\rm Ge}\kern-1.0pt{\rm V}^{2}$\hbox{\vrule height=7.10411pt,depth=2.08818pt,width=0.0pt}}}

The integrated cross sections for Q2>200GeV2superscript𝑄2200superscriptGeV2Q^{2}>200\,{\rm Ge}\kern-1.0pt{\rm V}^{2} are obtained by summing the cross sections in the Q2superscript𝑄2Q^{2} bins of tables 2 and 3, resulting in111111Summing the single cross sections implies using an average of the acceptances evaluated for the single bins, which is slightly different from the global acceptance quoted in table 1.

σe+pν¯X(Q2>200GeV2)subscript𝜎superscript𝑒𝑝¯𝜈𝑋superscript𝑄2200superscriptGeV2\displaystyle\sigma_{e^{+}p\to{\overline{\nu}}X}(Q^{2}>200\,{\rm Ge}\kern-1.0pt{\rm V}^{2}) =\displaystyle= 30.3[stat]-4.2+5.5[syst]-2.6+1.6pb\displaystyle 30.3\,{}^{\mathchar 43\relax{\phantom{0}}5.5}_{\mathchar 512\relax{\phantom{0}}4.2}\,{\rm[stat]}\;{}^{\mathchar 43\relax 1.6}_{\mathchar 512\relax 2.6}\,{\rm[syst]}\,{\rm pb}
σepνX(Q2>200GeV2)subscript𝜎superscript𝑒𝑝𝜈𝑋superscript𝑄2200superscriptGeV2\displaystyle\sigma_{e^{-}p\to\nu X}(Q^{2}>200\,{\rm Ge}\kern-1.0pt{\rm V}^{2}) =\displaystyle= 54.7[stat]-9.8+15.9[syst]-3.4+2.8pb.\displaystyle 54.7\,{}^{\mathchar 43\relax 15.9}_{\mathchar 512\relax{\phantom{0}}9.8}\,{\rm[stat]}\;{}^{\mathchar 43\relax 2.8}_{\mathchar 512\relax 3.4}\,{\rm[syst]}\,{\rm pb}\;.

These measurements are compatible with the respective SM predictions of 32.3pb32.3pb32.3\,{\rm pb} and 65.8pb65.8pb65.8\,{\rm pb}. The e+p/epsuperscript𝑒𝑝superscript𝑒𝑝e^{+}p/e^{-}p ratio is

σe+pν¯XσepνX(Q2>200GeV2)=0.55[stat]0.12+0.16[syst]0.03+0.02,{\sigma_{e^{+}p\to{\overline{\nu}}X}\over\sigma_{e^{-}p\to\nu X}}(Q^{2}>200\,{\rm Ge}\kern-1.0pt{\rm V}^{2})=0.55\,{}^{+0.16}_{-0.12}\,{\rm[stat]}\;{}^{+0.02}_{-0.03}\,{\rm[syst]}\;, (6)

in agreement with the SM prediction of 0.490.490.49.

Determination of the W mass¯¯Determination of the W mass\underline{\hbox{Determination of the $W$ mass\hbox{\vrule height=7.10411pt,depth=2.08818pt,width=0.0pt}}}

The Q2superscript𝑄2Q^{2} dependence of the CC cross section is largely determined by the propagator term 𝒫(MW,Q2)=[MW2/(MW2+Q2)]2𝒫subscript𝑀𝑊superscript𝑄2superscriptdelimited-[]superscriptsubscript𝑀𝑊2superscriptsubscript𝑀𝑊2superscript𝑄22{\cal P}(M_{W},Q^{2})\mathchar 61\relax[M_{W}^{2}/(M_{W}^{2}+Q^{2})]^{2}. In order to determine the value of MWsubscript𝑀𝑊M_{W}, the differential cross section was factorized according to dσ/dQ2=𝒫(MW,Q2)Φ(Q2)𝑑𝜎𝑑superscript𝑄2𝒫subscript𝑀𝑊superscript𝑄2Φsuperscript𝑄2d\sigma/dQ^{2}={\cal P}(M_{W},Q^{2})\cdot\Phi(Q^{2}). The function Φ(Q2)Φsuperscript𝑄2\Phi(Q^{2}), containing the Q2superscript𝑄2Q^{2} dependence of the parton densities and couplings, was taken from the MC simulation, using the MRSA parton distributions. A binned log–likelihood fit with MWsubscript𝑀𝑊M_{W} as the free parameter, applied simultaneously to the e+psuperscript𝑒𝑝e^{+}p and epsuperscript𝑒𝑝e^{-}p data samples, yielded

MW=79[stat]7+8[syst]4+4GeV,M_{W}=79\,{}^{+8}_{-7}\,{\rm[stat]}\;{}^{+4}_{-4}\,{\rm[syst]}\,{\rm Ge}\kern-1.0pt{\rm V}\;, (7)

in agreement with the average value MW=80.22±0.26GeVsubscript𝑀𝑊plus-or-minus80.220.26GeVM_{W}=80.22\pm 0.26\,{\rm Ge}\kern-1.0pt{\rm V} [39] obtained from direct measurements of the W𝑊W mass at pp¯𝑝¯𝑝p\overline{p} colliders [6] and also with the recent H1 measurement [5]. The systematic uncertainty of MWsubscript𝑀𝑊M_{W} has been evaluated using the method described in section 4.5. The dominant contribution is the calorimeter energy scale.

5.2 Jet Analysis

An (η,ϕ)𝜂italic-ϕ(\eta,\phi)–cone jet finding algorithm [40] has been applied to the data, using a cone radius, R=(Δϕ2+Δη2)12𝑅superscriptΔsuperscriptitalic-ϕ2Δsuperscript𝜂212R=(\Delta\phi^{2}+\Delta\eta^{2})^{\frac{1}{2}} of 0.70.70.7. Pre–clusters are formed around calorimeter cells with transverse energies larger than 0.3GeV0.3GeV0.3\,{\rm Ge}\kern-1.0pt{\rm V}, and the final clusters are called jets if their transverse energies exceed 6GeV6GeV6\,{\rm Ge}\kern-1.0pt{\rm V} and their pseudorapidities ηjetsuperscript𝜂jet\eta^{\,\rm jet} are less than 2.52.52.5 (i.e. polar angles greater than 9superscript99^{\circ}). This jet analysis is done in the laboratory system. A detailed analysis of jets in NC reactions, covering the region Q2

<

103GeV2

<

superscript𝑄2superscript103superscriptGeV2
Q^{2}\mathchoice{\mathrel{\vbox{\hbox{$\lower 3.8pt\hbox{$\displaystyle<$}\atop{\raise 1.8pt\hbox{$\displaystyle\sim$}}$}}}}{\mathrel{\vbox{\hbox{$\lower 3.8pt\hbox{$\textstyle<$}\atop{\raise 1.8pt\hbox{$\textstyle\sim$}}$}}}}{\mathrel{\vbox{\hbox{$\lower 3.8pt\hbox{$\scriptstyle<$}\atop{\raise 1.8pt\hbox{$\scriptstyle\sim$}}$}}}}{\mathrel{\vbox{\hbox{$\lower 3.8pt\hbox{$\scriptscriptstyle<$}\atop{\raise 1.8pt\hbox{$\scriptscriptstyle\sim$}}$}}}}10^{3}\,{\rm Ge}\kern-1.0pt{\rm V}^{2}
, has previously been published in [41].

The results of the present jet analysis turn out to be insensitive to the choice of the cone radius (R=1𝑅1R=1 and R=0.5𝑅0.5R=0.5 have also been tested). The constraint on ηjetsuperscript𝜂jet\eta^{\,\rm jet} was applied in order to avoid effects from the fragmentation of the proton remnant. In fact, the proton remnant manifests itself as a moderate enhancement of the transverse energy flow around the forward edge of acceptance, and for ηjet=2.5superscript𝜂jet2.5\eta^{\,\rm jet}=2.5 this enhancement is still clearly separated from the Etsubscript𝐸𝑡E_{t} flow associated with the jet.

For all jets found, the distributions of the jet momentum transverse to the beam axis, ptjetsuperscriptsubscript𝑝𝑡jetp_{t}^{\,\rm jet}, is shown in figures 6a and 7a for e+psuperscript𝑒𝑝e^{+}p and epsuperscript𝑒𝑝e^{-}p data, respectively. ptjetsuperscriptsubscript𝑝𝑡jetp_{t}^{\,\rm jet} has been corrected for energy loss in the inactive material of the detector121212This was the only correction applied in this jet analysis. by using the average difference of measured and true values of ptjetsuperscriptsubscript𝑝𝑡jetp_{t}^{\,\rm jet} as determined in the MC simulation as a function of the measured ptjetsuperscriptsubscript𝑝𝑡jetp_{t}^{\,\rm jet}. Note that the ptjetsuperscriptsubscript𝑝𝑡jetp_{t}^{\,\rm jet} spectrum is much harder for the epsuperscript𝑒𝑝e^{-}p than for the e+psuperscript𝑒𝑝e^{+}p data, as is expected from the harder Q2superscript𝑄2Q^{2} distributions. Figures 6b and 7b show the distributions of ηjetsuperscript𝜂jet\eta^{\,\rm jet}. The transverse energy flows measured in pseudorapidity (ΔηΔ𝜂\Delta\eta) and azimuthal angle (ΔϕΔitalic-ϕ\Delta\phi) relative to the jet axis, are plotted in figures 6c,d and 7c,d. The hadronic energy flow produced between the jet and the proton remnant is clearly observed in the excess of transverse energy at high ΔηΔ𝜂\Delta\eta, i.e. towards the proton remnant.

All these figures also show the predictions of the ariadne MC. The ptjetsuperscriptsubscript𝑝𝑡jetp_{t}^{\,\rm jet} and ηjetsuperscript𝜂jet\eta^{\,\rm jet} distributions are also compared to the meps simulation. The MC distributions have been normalized to the number of jets observed in the data. For the Etsubscript𝐸𝑡E_{t} flow distributions, the differences between ariadne and meps (not shown) are slight. Good agreement is observed between the data and both the ariadne and the meps predictions, indicating in particular that the jet properties are well described by the MC models.

The jet multiplicity distributions are summarized in table 8. All selected events have at least one jet. Events with two or more jets are expected from hard QCD subprocesses, in particular from boson–gluon fusion (BGF). The MC predictions for the jet multiplicities, which include the 𝒪(αs)𝒪subscript𝛼𝑠{\cal O}(\alpha_{s}) matrix elements, exhibit significant differences, amounting to nearly a factor of two in the 2–jet rates. However, within their statistical errors, the data are compatible with both models, favoring values intermediate between ariadne and meps.

5.3 Search for Large Rapidity Gap Events

Events with a large rapidity gap (LRG) between the outgoing proton system and the rest of the hadronic final state have been observed at HERA in neutral–current DIS [7]. These events are generally understood to be of a diffractive nature and to result from the exchange of a colorless object (usually called the pomeron) with the quantum numbers of the vacuum. Evidence for a partonic structure of the pomeron in DIS has also been observed by the HERA experiments [8].

In CC processes, the coupling of the exchanged W𝑊W is sensitive to the flavor of the pomeron constituents, which could provide additional information on the pomeron structure. The search also is sensitive to high Q2superscript𝑄2Q^{2} diffractive production of exclusive hadronic states such as vector or axial–vector mesons, complementing corresponding NC studies [42].

Similar to the prescription used in a previous NC analysis [9], LRG events are identified using two variables, ηmaxsubscript𝜂max\eta_{\rm max} and θHsubscript𝜃𝐻\theta_{H}. ηmaxsubscript𝜂max\eta_{\rm max} is defined as the maximum pseudorapidity of any calorimeter cluster131313Calorimeter clusters are groups of adjacent cells which have energy deposits above the noise thresholds. or cell with energy greater than 400MeV400MeV400\,{\rm Me}\kern-1.0pt{\rm V}. The global quantity θHsubscript𝜃𝐻\theta_{H} is given by the energy weighted mean polar angle of the energy deposits in the calorimeter, cosθH=ipZi/iEisubscript𝜃𝐻subscript𝑖superscriptsubscript𝑝𝑍𝑖subscript𝑖superscript𝐸𝑖\cos\theta_{H}=\sum_{i}p_{Z}^{i}/\sum_{i}E^{i}, where the sums run over all calorimeter cells. In the naïve quark parton model, θHsubscript𝜃𝐻\theta_{H} is the scattering angle of the struck quark.
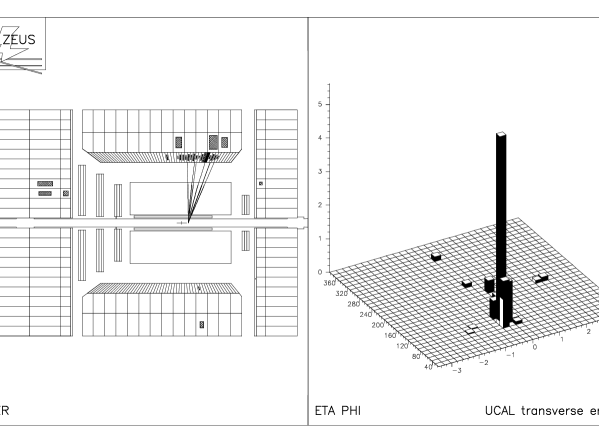
Figure 8 shows a scatter plot of cosθHsubscript𝜃𝐻\cos\theta_{H} versus ηmaxsubscript𝜂max\eta_{\rm max} for the combined e+psuperscript𝑒𝑝e^{+}p and epsuperscript𝑒𝑝e^{-}p samples. The rectangle indicates the region ηmax<2.5subscript𝜂max2.5\eta_{\rm max}\mathchar 316\relax 2.5 and cosθH<0.75subscript𝜃𝐻0.75\cos\theta_{H}\mathchar 316\relax 0.75, which is taken from [9] as the definition of LRG events (“LRG requirement”). One event of the e+psuperscript𝑒𝑝e^{+}p sample, shown in figure 9, passes these LRG cuts. The reconstructed kinematic variables for this event are t=14±2GeVsubscriptitalic-P̸𝑡plus-or-minus142GeV{\mbox{$\not{P}_{t}$}}\mathchar 61\relax 14\pm 2\,{\rm Ge}\kern-1.0pt{\rm V}, Q2=300±70GeV2superscript𝑄2plus-or-minus30070superscriptGeV2Q^{2}\mathchar 61\relax 300\pm 70\,{\rm Ge}\kern-1.0pt{\rm V}^{2}, x=0.0093±0.0015𝑥plus-or-minus0.00930.0015x\mathchar 61\relax 0.0093\pm 0.0015 and y=0.35±0.10𝑦plus-or-minus0.350.10y\mathchar 61\relax 0.35\pm 0.10.

In order to estimate event selection efficiencies and expected event rates in the e+psuperscript𝑒𝑝e^{+}p case, the LRG analysis was also applied to the following CC MC sets (at the generator level, ηmaxsubscript𝜂max\eta_{\rm max} was defined as the maximum pseudorapidity of all particles with momenta greater than 400MeV400MeV400\,{\rm Me}\kern-1.0pt{\rm V} and with η<4.5𝜂4.5\eta<4.5, where the latter requirement excluded the proton in diffractive reactions):

  • ariadne. This set uses lepto for the differential cross section and includes the simulation of diffractive–like processes via soft color interactions between the perturbatively produced partons and color–charges in the proton remnant [43]. The fraction of events with ηmax<2.5subscript𝜂max2.5\eta_{\rm max}<2.5 at the generator level was found to be 1.3%percent1.31.3\%.

  • meps. This set also is based on lepto, but does not simulate soft color interactions. Here the rapidity gap between proton direction and hadronic system is exponentially suppressed. At the generator level, 0.45%percent0.450.45\% of the events had ηmax<2.5subscript𝜂max2.5\eta_{\rm max}<2.5. Most of the events passing the LRG requirement had a smaller rapidity gap at the generator level.

  • pompyt. This generator simulates only diffractive reactions and is based on a factorizable model for high–energy diffractive processes where, within the pythia framework, the proton emits a pomeron, whose constituents take part in a hard scattering process with the W𝑊W boson. For this analysis a hard quark density distribution in the pomeron was assumed (β(1β)proportional-toabsent𝛽1𝛽\propto\beta(1-\beta), where β𝛽\beta is the momentum fraction of the quark relative to the pomeron momentum), which in addition satisfied the momentum sum rule.141414The latter assumption conflicts with measurements [9] of the NC diffractive cross section. Hence pompyt predictions of absolute cross sections were not used.

    It is interesting to note that, according to the pompyt simulation, only 18%percent1818\% of all CC diffractive events with Q2>200GeV2superscript𝑄2200superscriptGeV2Q^{2}>200\,{\rm Ge}\kern-1.0pt{\rm V}^{2} have ηmax<2.5subscript𝜂max2.5\eta_{\rm max}<2.5 at the generator level, 41%percent4141\% of which pass the CC selection and fulfill the LRG requirement.

The fractions of LRG events are summarized in table 8 (for the e+psuperscript𝑒𝑝e^{+}p NC control sample this ratio was determined using the event weights as described in section 3.3). They roughly agree between the CC data, the ariadne simulation and the NC control sample, whereas for the meps sample, the fraction of LRG events is below that predicted in ariadne.

The selection efficiency εLRGsubscript𝜀LRG\varepsilon_{\rm LRG}, defined as

εLRG=no. of events with Qcor2>200GeV2 which pass CC cuts and LRG requirementno. of events which have Q2>200GeV2 and ηmax<2.5 at generator level,subscript𝜀LRGno. of events with Qcor2>200GeV2 which pass CC cuts and LRG requirementno. of events which have Q2>200GeV2 and ηmax<2.5 at generator level\varepsilon_{\rm LRG}={\hbox{no.~{}of events with $Q^{2}_{\rm cor}>200\,{\rm Ge}\kern-1.0pt{\rm V}^{2}$ which pass CC cuts and LRG requirement}\over\hbox{no.~{}of events which have $Q^{2}>200\,{\rm Ge}\kern-1.0pt{\rm V}^{2}$ and $\eta_{\rm max}<2.5$ at generator level}}\;,

is also shown in table 8 for the three MC sets. Using the ariadne value of εLRG=0.43subscript𝜀LRG0.43\varepsilon_{\rm LRG}=0.43, the cross section for e+psuperscript𝑒𝑝e^{+}p CC interactions with ηmax<2.5subscript𝜂max2.5\eta_{\rm max}<2.5 was calculated to be

σe+pν¯X(Q2>200GeV2;ηmax<2.5)=0.8[stat]0.7+1.8±0.1[syst]pb.\sigma_{e^{+}p\to{\overline{\nu}}X}(Q^{2}>200\,{\rm Ge}\kern-1.0pt{\rm V}^{2};\eta_{\rm max}<2.5)=0.8\,{}_{-0.7}^{+1.8}\,{\rm[stat]}\,\pm 0.1\,{\rm[syst]}\,{\rm pb}. (8)

The systematic uncertainty of this result was derived from the difference of the efficiencies εLRGsubscript𝜀LRG\varepsilon_{\rm LRG} obtained using the meps and pompyt sets.

6 Summary and Conclusions

The cross sections for the deep inelastic charged–current interactions e+pν¯Xsuperscript𝑒𝑝¯𝜈𝑋e^{+}p\to{\overline{\nu}}X and epνXsuperscript𝑒𝑝𝜈𝑋e^{-}p\to\nu X have been measured in the kinematic region x>0.006𝑥0.006x>0.006 and Q2>200GeV2superscript𝑄2200superscriptGeV2Q^{2}>200\,{\rm Ge}\kern-1.0pt{\rm V}^{2}, using the e+psuperscript𝑒𝑝e^{+}p and epsuperscript𝑒𝑝e^{-}p data collected with the ZEUS detector during 1993 and 1994. For the integrated cross sections,

σe+pν¯X(Q2>200GeV2)subscript𝜎superscript𝑒𝑝¯𝜈𝑋superscript𝑄2200superscriptGeV2\displaystyle\sigma_{e^{+}p\to{\overline{\nu}}X}(Q^{2}\mathchar 318\relax 200\,{\rm Ge}\kern-1.0pt{\rm V}^{2}) =\displaystyle= 30.3[stat]-4.2+5.5[syst]-2.6+1.6pb\displaystyle 30.3\,{}^{\mathchar 43\relax{\phantom{0}}5.5}_{\mathchar 512\relax{\phantom{0}}4.2}\,{\rm[stat]}\;{}^{\mathchar 43\relax 1.6}_{\mathchar 512\relax 2.6}\,{\rm[syst]}\,{\rm pb}
σepνX(Q2>200GeV2)subscript𝜎superscript𝑒𝑝𝜈𝑋superscript𝑄2200superscriptGeV2\displaystyle\sigma_{e^{-}p\to\nu X}(Q^{2}\mathchar 318\relax 200\,{\rm Ge}\kern-1.0pt{\rm V}^{2}) =\displaystyle= 54.7[stat]-9.8+15.9[syst]-3.4+2.8pb\displaystyle 54.7\,{}^{\mathchar 43\relax 15.9}_{\mathchar 512\relax{\phantom{0}}9.8}\,{\rm[stat]}\;{}^{\mathchar 43\relax 2.8}_{\mathchar 512\relax 3.4}\,{\rm[syst]}\,{\rm pb}

are obtained, in good agreement with the Standard Model expectations of 32.3pb32.3pb32.3\,{\rm pb} and 65.8pb65.8pb65.8\,{\rm pb}.

The differential cross sections have been measured as functions of Q2superscript𝑄2Q^{2}, x𝑥x and y𝑦y. The differences between e+psuperscript𝑒𝑝e^{+}p and epsuperscript𝑒𝑝e^{-}p scattering, which are expected from the V-A𝑉𝐴V\mathchar 512\relax A helicity structure of the weak interaction and from the quark content of the proton, are clearly observed. No significant deviation from the Standard Model predictions is found.

The measured Q2superscript𝑄2Q^{2} dependence of the differential cross sections for e+superscript𝑒e^{+} and esuperscript𝑒e^{-} induced CC DIS reactions is used to determine the W𝑊W mass. The measured value of MWsubscript𝑀𝑊M_{W} is 79GeV7+84+479superscriptsubscriptsuperscriptsubscriptGeV447879\,{}^{+8}_{-7}\,{}^{+4}_{-4}\,{\rm Ge}\kern-1.0pt{\rm V}, in good agreement with direct measurements performed at pp¯𝑝¯𝑝p\overline{p} colliders.

A jet analysis has been performed and CC events with multiple jets have been observed. The distributions of the jet transverse momentum and rapidity as well as transverse energy flow jet profiles have been measured and are compared to the 𝒪(αs)𝒪subscript𝛼𝑠{\cal O}(\alpha_{s}) predictions of the ariadne and meps Monte Carlo models. Good agreement is observed in both the jet profiles and the jet rates.

A search for charged–current events with a large rapidity gap between the observed hadronic system and the outgoing proton system yielded one candidate event in the e+psuperscript𝑒𝑝e^{+}p sample, corresponding to a cross section of σe+pν¯X(Q2>200GeV2;ηmax<2.5)=0.8[stat]0.7+1.8±0.1[syst]pb\sigma_{e^{+}p\to{\overline{\nu}}X}(Q^{2}>200\,{\rm Ge}\kern-1.0pt{\rm V}^{2};\eta_{\rm max}<2.5)=0.8\,{}_{-0.7}^{+1.8}\,{\rm[stat]}\,\pm 0.1\,{\rm[syst]}\,{\rm pb}.


Acknowledgments

We appreciate the contributions to the construction and maintenance of the ZEUS detector of the many people who are not listed as authors. The HERA machine group and the DESY computing staffs are especially acknowledged for their efforts to provide excellent operation of the collider and the data analysis environment. We thank the DESY directorate for strong support and encouragement.

References

  • [1] CDHS Collaboration, H.Abramowicz et al., Z. Phys. C25(1984)29;
    CDHSW Collaboration, J.P.Berge et al., Z. Phys. C49(1991)187;
    CCFR Collaboration, E.Oltman et al., Z. Phys. C53(1992)51;
    BEBC WA21 Collaboration, G.T.Jones et al., Z. Phys. C62(1994)575.
  • [2] H1 Collaboration, T.Ahmed et al., Phys. Lett. B324(1994)241.
  • [3] ZEUS Collaboration, M.Derrick et al., Phys. Rev. Lett. 75(1995)1006.
  • [4] H1 Collaboration, S.Aid et al., Z. Phys. C67(1995)565.
  • [5] H1 Collaboration, S.Aid et al., DESY 96–046 (1996).
  • [6] CDF Collaboration, F.Abe et al., Phys. Rev. Lett. 75(1995)11;
    CDF Collaboration, F.Abe et al., Phys. Rev. D52(1995)4784;
    D0 Collaboration, S.Abachi et al., Proc. Topical Workshop on Proton–Antiproton Collider Physics, Tsukuba, Japan (1993);
    UA2 Collaboration, J.Alitti et al., Phys. Lett B241(1990)150.
  • [7] ZEUS Collaboration, M.Derrick et al., Phys. Lett. B315(1993)481;
    ZEUS Collaboration, M.Derrick et al., Phys. Lett. B332(1994)228;
    H1 Collaboration, T.Ahmed et al., Nucl. Phys. B429(1994)477.
  • [8] ZEUS Collaboration, M.Derrick et al., Phys. Lett. B346(1995)399;
    H1 Collaboration, T.Ahmed et al., Phys. Lett. B348(1995)681;
    ZEUS Collaboration, M.Derrick et al., Phys. Lett. B356(1995)129.
  • [9] ZEUS Collaboration, M.Derrick et al., Z. Phys. C68(1995)569.
  • [10] ZEUS Collaboration, M.Derrick et al., DESY 96–018 (1996).
  • [11] ZEUS Collaboration, M.Derrick et al., Z. Phys. C65(1995)379.
  • [12] ZEUS Collaboration, M.Derrick et al., Phys. Lett. B293(1992)465.
  • [13] The ZEUS Detector, Status Report 1993, DESY (1993).
  • [14] M.Derrick et al., Nucl. Inst. Meth. A309(1991)77;
    A.Andresen et al., Nucl. Inst. Meth. A309(1991)101;
    A.Bernstein et al., Nucl. Inst. Meth. A336(1993)23;
    A.Caldwell et al., Nucl. Inst. Meth. A321(1992)356.
  • [15] H.Abramowicz et al., Nucl. Inst. Meth. A313(1992)126.
  • [16] C.Alvisi et al., Nucl. Inst. Meth. A305(1991)30.
  • [17] N.Harnew et al., Nucl. Inst. Meth. A279(1989)290;
    B.Foster et al., Nucl. Phys., Proc. Suppl. B32(1993);
    B.Foster et al., Nucl. Inst. Meth. A338(1994)254.
  • [18] J.Andruszków, DESY 92–066 (1992).
  • [19] lepto 6.3: G.Ingelman, Proc. 1991 Workshop on Physics at HERA, ed. W.Buchmüller and G.Ingelman (DESY, Hamburg, 1992), Vol. 3, p.1366.
  • [20] heracles 4.4: A.Kwiatkowski, H.Spiesberger and H.J.Möhring, Proc. 1991 Workshop on Physics at HERA, ed. W.Buchmüller and G.Ingelman (DESY, Hamburg, 1992), Vol. 3, p.1294.
  • [21] django 6.1: G.Schuler and H.Spiesberger, Proc. 1991 Workshop on Physics at HERA, ed. W.Buchmüller and G.Ingelman (DESY, Hamburg, 1992), Vol. 3, p.1419.
  • [22] A.D.Martin, R.G.Roberts, W.J.Stirling, Phys. Rev. D50(1994)6734.
  • [23] ariadne 4.06: L.Lönnblad, LU TP–89–10;
    L.Lönnblad, Comp. Phys. Comm. 71(1992)15.
  • [24] pythia 5.7 and jetset 7.4: T.Sjöstrand, CERN–TH 7112–93 (1994);
    T.Sjöstrand, LU–TP–95–20 (1995).
  • [25] herwig 5.8: B.R.Webber, Proc. 1991 Workshop on Physics at HERA, ed. W.Buchmüller and G.Ingelman (DESY, Hamburg, 1992), Vol. 3, p.1363.
  • [26] aroma 2.1: G.Ingelman and G.Schuler, Proc. 1991 Workshop on Physics at HERA, ed. W.Buchmüller and G.Ingelman (DESY, Hamburg, 1992), Vol. 3, p.1346.
  • [27] pompyt 1.0: P.Bruni and G.Ingelman, Proc. Europhysics Conference on HEP, Marseilles, France (1993), p.595.
  • [28] G.Ingelman and P.Schlein, Phys. Lett. B152(1985)256.
  • [29] R.Brun et al., CERN DD/EE–84–1 (1987).
  • [30] F.Jacquet and A.Blondel, Proceedings of the study for an ep𝑒𝑝ep facility for Europe, DESY 79–48 (1979), p.391.
  • [31] H.Abramowicz, A.Caldwell, R.Sinkus, Nucl. Inst. Meth. A365(1995)508.
  • [32] S.Bentvelsen, J.Engelen, P.Kooijman, Proc. 1991 Workshop on Physics at HERA, ed. W.Buchmüller and G.Ingelman (DESY, Hamburg, 1992), Vol. 1, p.23.
  • [33] G.D’Agostini, DESY 94–099 (1994).
  • [34] A.D.Martin, R.G.Roberts, W.J.Stirling, Phys. Rev. D47(1993)867.
  • [35] A.D.Martin, R.G.Roberts, W.J.Stirling, Phys. Lett. 306B(1993)147;
    erratum in Phys. Lett. 309B(1993)492.
  • [36] M.Glück, E.Reya, A.Vogt, Z. Phys. C53(1992)127.
  • [37] CTEQ Collaboration, J.Botts et al., Phys. Lett. B304(1993)159.
  • [38] BEBC WA21 Collaboration, G.T.Jones et al., Z. Phys. C62(1994)601.
  • [39] L.Montanet et al., Phys. Rev. D50(1994)1173.
  • [40] UA1 Collaboration, G.Arnison et al., Phys. Lett. B123(1983)115;
    J.Huth et al., Proc. 1990 DPF Summer Study on High–Energy Physics, Snowmass, Colorado, ed. E.L.Berger (World Scientific, Singapore, 1990, p.134).
  • [41] ZEUS Collaboration, M.Derrick et al., Z. Phys. C67(1995)81.
  • [42] ZEUS Collaboration, M.Derrick et al., Phys. Lett. B356(1995)601;
    H1 Collaboration, S.Aid et al., DESY 96–023.
  • [43] A.Edin, G.Ingelman, J.Rathsman, DESY 95-145 (1995).
cut e+psuperscript𝑒𝑝e^{+}p epsuperscript𝑒𝑝e^{-}p
description data MC(Q2>200GeV2superscript𝑄2200superscriptGeV2Q^{2}\mathchar 318\relax 200\,{\rm Ge}\kern-1.0pt{\rm V}^{2}) data MC(Q2>200GeV2superscript𝑄2200superscriptGeV2Q^{2}\mathchar 318\relax 200\,{\rm Ge}\kern-1.0pt{\rm V}^{2})
Q2>200GeV2superscript𝑄2200superscriptGeV2Q^{2}>200\,{\rm Ge}\kern-1.0pt{\rm V}^{2} (MC only) 100.0% 100.0%
Trigger and preselection 6307 083.2% 1450 086.1%
t>11GeVsubscriptitalic-P̸𝑡11GeV{\mbox{$\not{P}_{t}$}}>11\,{\rm Ge}\kern-1.0pt{\rm V} 2981 080.0% 0940 083.1%
|Zvtx|<45cmsubscript𝑍vtx45cm|{Z_{\rm vtx}}|<45\,{\rm cm} 1283 071.0% 0500 074.7%
tout/t>0.6superscriptsubscriptitalic-P̸𝑡outsubscriptitalic-P̸𝑡0.6{\mbox{$\not{P}_{t}$}}^{\rm out}/{\mbox{$\not{P}_{t}$}}>0.6 0958 070.3% 0301 073.9%
good track 0741 068.2% 0237 071.7%
|Δϕ|<1Δitalic-ϕ1|\Delta\phi|<1 0342 066.8% 0113 070.3%
yJB<0.8subscript𝑦𝐽𝐵0.8y_{JB}<0.8 0279 066.2% 0098 069.2%
t/Et>0.4subscriptitalic-P̸𝑡subscript𝐸𝑡0.4{\mbox{$\not{P}_{t}$}}/E_{t}>0.4 0208 065.0% 0059 068.1%
Pttracks/t>0.1superscriptsubscript𝑃𝑡trackssubscriptitalic-P̸𝑡0.1P_{t}^{\rm tracks}/{\mbox{$\not{P}_{t}$}}>0.1 0087 063.0% 0036 066.3%
Muon,timing,sparks 0059 063.0% 0030 066.3%
Visual scan (data only) 0056 0030

Table 1: Data reduction by the selection cuts described in section 3.2. The columns denoted “data” indicate the numbers of events remaining after applying the cuts. The “MC” columns show the cumulative selection efficiencies for the ariadne MC simulation.
Q2[GeV2]superscript𝑄2delimited-[]superscriptGeV2Q^{2}\;[{\rm Ge}\kern-1.0pt{\rm V}^{2}]
200200{\phantom{00}}200 437437{\phantom{00}}437 955955{\phantom{00}}955 20892089{\phantom{0}}2089 45174517{\phantom{0}}4517
e+psuperscript𝑒𝑝e^{+}p 0- 0- 0- - - >200absent200>200
437437{\phantom{00}}437 955955{\phantom{00}}955 20892089{\phantom{0}}2089 45174517{\phantom{0}}4517 100001000010000
Nevtsubscript𝑁evtN_{\rm evt} 88{\phantom{0}}8{\phantom{.0}} 151515{\phantom{.0}} 121212{\phantom{.0}} 141414{\phantom{.0}} 77{\phantom{0}}7{\phantom{.0}} 565656{\phantom{.0}}
Q2[GeV2]delimited-⟨⟩superscript𝑄2delimited-[]superscriptGeV2\langle Q^{2}\rangle\;[{\rm Ge}\kern-1.0pt{\rm V}^{2}] 310310{\phantom{0}}310 670670{\phantom{0}}670 145014501450 307030703070 651065106510 191019101910
Nbgsubscript𝑁bgN_{\rm bg} 1.21.2{\phantom{0}}1.2 0.20.2{\phantom{0}}0.2 00{\phantom{0}}0{\phantom{.0}} 00{\phantom{0}}0{\phantom{.0}} 00{\phantom{0}}0{\phantom{.0}} 1.41.4{\phantom{0}}1.4
ζ𝜁\zeta 0.380.380.38 0.580.580.58 0.700.700.70 0.760.760.76 0.710.710.71 0.620.620.62
ξ𝜉\xi 0.760.760.76 0.720.720.72 0.730.730.73 0.760.760.76 0.790.790.79 1.01.01.0{\phantom{0}}
σexp[pb]superscript𝜎expdelimited-[]pb\sigma^{\rm exp}\,[{\rm pb}] 6.16.1{\phantom{0}}6.1 8.78.7{\phantom{0}}8.7 5.85.8{\phantom{0}}5.8 6.36.3{\phantom{0}}6.3 3.43.4{\phantom{0}}3.4 30.330.330.3
Δσexp[stat][pb]Δsuperscript𝜎expdelimited-[]statdelimited-[]pb\Delta\sigma^{\rm exp}\,{\rm[stat]}\;[{\rm pb}] -2.2+3.0subscriptsuperscriptabsent3.02.2{}^{\mathchar 43\relax{\phantom{0}}3.0}_{\mathchar 512\relax{\phantom{0}}2.2} -2.3+2.9subscriptsuperscriptabsent2.92.3{}^{\mathchar 43\relax{\phantom{0}}2.9}_{\mathchar 512\relax{\phantom{0}}2.3} -1.7+2.2subscriptsuperscriptabsent2.21.7{}^{\mathchar 43\relax{\phantom{0}}2.2}_{\mathchar 512\relax{\phantom{0}}1.7} -1.7+2.2subscriptsuperscriptabsent2.21.7{}^{\mathchar 43\relax{\phantom{0}}2.2}_{\mathchar 512\relax{\phantom{0}}1.7} -1.3+1.8subscriptsuperscriptabsent1.81.3{}^{\mathchar 43\relax{\phantom{0}}1.8}_{\mathchar 512\relax{\phantom{0}}1.3} -4.2+5.5subscriptsuperscriptabsent5.54.2{}^{\mathchar 43\relax{\phantom{0}}5.5}_{\mathchar 512\relax{\phantom{0}}4.2}
Δσexp[syst][pb]Δsuperscript𝜎expdelimited-[]systdelimited-[]pb\Delta\sigma^{\rm exp}\,{\rm[syst]}\;[{\rm pb}] -2.7+1.3subscriptsuperscriptabsent1.32.7{}^{\mathchar 43\relax{\phantom{0}}1.3}_{\mathchar 512\relax{\phantom{0}}2.7} -0.6+0.6subscriptsuperscriptabsent0.60.6{}^{\mathchar 43\relax{\phantom{0}}0.6}_{\mathchar 512\relax{\phantom{0}}0.6} -0.3+0.3subscriptsuperscriptabsent0.30.3{}^{\mathchar 43\relax{\phantom{0}}0.3}_{\mathchar 512\relax{\phantom{0}}0.3} -0.3+0.6subscriptsuperscriptabsent0.60.3{}^{\mathchar 43\relax{\phantom{0}}0.6}_{\mathchar 512\relax{\phantom{0}}0.3} -0.4+0.7subscriptsuperscriptabsent0.70.4{}^{\mathchar 43\relax{\phantom{0}}0.7}_{\mathchar 512\relax{\phantom{0}}0.4} -2.6+1.6subscriptsuperscriptabsent1.62.6{}^{\mathchar 43\relax{\phantom{0}}1.6}_{\mathchar 512\relax{\phantom{0}}2.6}
σth[pb]superscript𝜎thdelimited-[]pb\sigma^{\rm th}\,[{\rm pb}] 6.26.2{\phantom{0}}6.2 8.38.3{\phantom{0}}8.3 8.38.3{\phantom{0}}8.3 6.46.4{\phantom{0}}6.4 2.52.5{\phantom{0}}2.5 32.332.332.3
Systematic checks
Check ΔσexpΔsuperscript𝜎exp\Delta\sigma^{\rm exp} [%]
E𝐸E scale +3%percent3\mathchar 43\relax 3\% (+5%percent5\mathchar 43\relax 5\% in FCAL) 12.612.6{\phantom{\mathchar 512\relax}}12.6 6.36.3{\phantom{\mathchar 512\relax 0}}6.3 2.12.1{\phantom{\mathchar 512\relax 0}}2.1 3.33.3-{\phantom{0}}3.3 10.810.8-10.8 2.12.1{\phantom{\mathchar 512\relax 0}}2.1
E𝐸E scale -3%percent3\mathchar 512\relax 3\% (-5%percent5\mathchar 512\relax 5\% in FCAL) 18.718.7-18.7 3.03.0-{\phantom{0}}3.0 3.33.3-{\phantom{0}}3.3 3.83.8{\phantom{\mathchar 512\relax 0}}3.8 13.613.6{\phantom{\mathchar 512\relax}}13.6 2.02.0-{\phantom{0}}2.0
Unfolding 0.90.9-{\phantom{0}}0.9 1.11.1{\phantom{\mathchar 512\relax 0}}1.1 1.71.7{\phantom{\mathchar 512\relax 0}}1.7 1.51.5-{\phantom{0}}1.5 13.813.8{\phantom{\mathchar 512\relax}}13.8 1.01.0-{\phantom{0}}1.0
Q2,x,ysuperscript𝑄2𝑥𝑦Q^{2},x,y reconstruction 15.715.7-15.7 2.12.1-{\phantom{0}}2.1 2.02.0{\phantom{\mathchar 512\relax 0}}2.0 7.67.6{\phantom{\mathchar 512\relax 0}}7.6 5.85.8{\phantom{\mathchar 512\relax 0}}5.8 0.30.3-{\phantom{0}}0.3
Nbg+ΔNbgsubscript𝑁bgΔsubscript𝑁bgN_{\rm bg}+\Delta N_{\rm bg} 36.236.2-36.2 3.43.4-{\phantom{0}}3.4 0.00.0{\phantom{\mathchar 512\relax 0}}0.0 0.00.0{\phantom{\mathchar 512\relax 0}}0.0 0.00.0{\phantom{\mathchar 512\relax 0}}0.0 7.37.3-{\phantom{0}}7.3
NbgΔNbgsubscript𝑁bgΔsubscript𝑁bgN_{\rm bg}-\Delta N_{\rm bg} 16.116.1{\phantom{\mathchar 512\relax}}16.1 1.51.5{\phantom{\mathchar 512\relax 0}}1.5 0.00.0{\phantom{\mathchar 512\relax 0}}0.0 0.00.0{\phantom{\mathchar 512\relax 0}}0.0 0.00.0{\phantom{\mathchar 512\relax 0}}0.0 3.33.3{\phantom{\mathchar 512\relax 0}}3.3

Table 2: Cross sections for CC e+psuperscript𝑒𝑝e^{+}p scattering in intervals of Q2superscript𝑄2Q^{2}, and for Q2>200GeV2superscript𝑄2200superscriptGeV2Q^{2}>200\,{\rm Ge}\kern-1.0pt{\rm V}^{2}. The rows denoted Nevtsubscript𝑁evtN_{\rm evt}, Q2delimited-⟨⟩superscript𝑄2\langle Q^{2}\rangle, Nbgsubscript𝑁bgN_{\rm bg}, ζ𝜁\zeta, ξ𝜉\xi, σexpsuperscript𝜎exp\sigma^{\rm exp}, and σthsuperscript𝜎th\sigma^{\rm th} show the raw event numbers, the mean Q2superscript𝑄2Q^{2} according to the SM prediction, the estimated number of background events from photoproduction, the bin–by–bin acceptance corrections, the purities, the experimental cross sections, and the theoretical cross sections, respectively. For σexpsuperscript𝜎exp\sigma^{\rm exp} the statistical errors Δσexp[stat]Δsuperscript𝜎expdelimited-[]stat\Delta\sigma^{\rm exp}\,{\rm[stat]} and systematic uncertainties Δσexp[syst]Δsuperscript𝜎expdelimited-[]syst\Delta\sigma^{\rm exp}\,{\rm[syst]} are quoted. The latter are calculated from the deviations resulting from the systematic studies described in the text (including the luminosity uncertainty of 3%percent33\% and the overall uncertainty of 3%percent33\% assigned to the efficiency of those selection cuts involving track quantities). The dominant contributions are detailed in the lower part of the table.
Q2[GeV2]superscript𝑄2delimited-[]superscriptGeV2Q^{2}\;[{\rm Ge}\kern-1.0pt{\rm V}^{2}]
200200{\phantom{00}}200 437437{\phantom{00}}437 955955{\phantom{00}}955 20892089{\phantom{0}}2089 45174517{\phantom{0}}4517 100001000010000
epsuperscript𝑒𝑝e^{-}p 0- 0- 0- - - - >200absent200>200
437437{\phantom{00}}437 955955{\phantom{00}}955 20892089{\phantom{0}}2089 45174517{\phantom{0}}4517 100001000010000 218772187721877
Nevtsubscript𝑁evtN_{\rm evt} 33{\phantom{0}}3{\phantom{.0}} 33{\phantom{0}}3{\phantom{.0}} 77{\phantom{0}}7{\phantom{.0}} 66{\phantom{0}}6{\phantom{.0}} 99{\phantom{0}}9{\phantom{.0}} 22{\phantom{0}}2{\phantom{.0}} 303030{\phantom{.0}}
Q2[GeV2]delimited-⟨⟩superscript𝑄2delimited-[]superscriptGeV2\langle Q^{2}\rangle\;[{\rm Ge}\kern-1.0pt{\rm V}^{2}] 310310{\phantom{00}}310 670670{\phantom{00}}670 14701470{\phantom{0}}1470 31403140{\phantom{0}}3140 67006700{\phantom{0}}6700 139001390013900 33403340{\phantom{0}}3340
Nbgsubscript𝑁bgN_{\rm bg} 0.30.3{\phantom{0}}0.3 0.10.1{\phantom{0}}0.1 00{\phantom{0}}0{\phantom{.0}} 00{\phantom{0}}0{\phantom{.0}} 00{\phantom{0}}0{\phantom{.0}} 00{\phantom{0}}0{\phantom{.0}} 0.40.4{\phantom{0}}0.4
ζ𝜁\zeta 0.390.390.39 0.560.560.56 0.740.740.74 0.780.780.78 0.740.740.74 0.590.590.59 0.660.660.66
ξ𝜉\xi 0.740.740.74 0.730.730.73 0.700.700.70 0.740.740.74 0.800.800.80 0.830.830.83 1.01.01.0{\phantom{0}}
σexp[pb]superscript𝜎expdelimited-[]pb\sigma^{\rm exp}\,[{\rm pb}] 8.48.4{\phantom{0}}8.4 6.36.3{\phantom{0}}6.3 11.611.611.6 9.49.4{\phantom{0}}9.4 14.914.914.9 4.14.1{\phantom{0}}4.1 54.754.754.7
Δσexp[stat][pb]Δsuperscript𝜎expdelimited-[]statdelimited-[]pb\Delta\sigma^{\rm exp}\,{\rm[stat]}\;[{\rm pb}] -4.6+8.2subscriptsuperscriptabsent8.24.6{}^{\mathchar 43\relax{\phantom{0}}8.2}_{\mathchar 512\relax{\phantom{0}}4.6} -3.4+6.2subscriptsuperscriptabsent6.23.4{}^{\mathchar 43\relax{\phantom{0}}6.2}_{\mathchar 512\relax{\phantom{0}}3.4} -4.3+6.3subscriptsuperscriptabsent6.34.3{}^{\mathchar 43\relax{\phantom{0}}6.3}_{\mathchar 512\relax{\phantom{0}}4.3} -3.7+5.6subscriptsuperscriptabsent5.63.7{}^{\mathchar 43\relax{\phantom{0}}5.6}_{\mathchar 512\relax{\phantom{0}}3.7} -4.9+6.8subscriptsuperscriptabsent6.84.9{}^{\mathchar 43\relax{\phantom{0}}6.8}_{\mathchar 512\relax{\phantom{0}}4.9} -2.7+5.4subscriptsuperscriptabsent5.42.7{}^{\mathchar 43\relax{\phantom{0}}5.4}_{\mathchar 512\relax{\phantom{0}}2.7} -9.8+15.9subscriptsuperscriptabsent15.99.8{}^{\mathchar 43\relax 15.9}_{\mathchar 512\relax{\phantom{0}}9.8}
Δσexp[syst][pb]Δsuperscript𝜎expdelimited-[]systdelimited-[]pb\Delta\sigma^{\rm exp}\,{\rm[syst]}\;[{\rm pb}] -2.7+1.6subscriptsuperscriptabsent1.62.7{}^{\mathchar 43\relax{\phantom{0}}1.6}_{\mathchar 512\relax{\phantom{0}}2.7} -0.7+0.6subscriptsuperscriptabsent0.60.7{}^{\mathchar 43\relax{\phantom{0}}0.6}_{\mathchar 512\relax{\phantom{0}}0.7} -0.7+0.7subscriptsuperscriptabsent0.70.7{}^{\mathchar 43\relax{\phantom{0}}0.7}_{\mathchar 512\relax{\phantom{0}}0.7} -0.6+0.8subscriptsuperscriptabsent0.80.6{}^{\mathchar 43\relax{\phantom{0}}0.8}_{\mathchar 512\relax{\phantom{0}}0.6} -1.6+1.9subscriptsuperscriptabsent1.91.6{}^{\mathchar 43\relax{\phantom{0}}1.9}_{\mathchar 512\relax{\phantom{0}}1.6} -1.2+1.5subscriptsuperscriptabsent1.51.2{}^{\mathchar 43\relax{\phantom{0}}1.5}_{\mathchar 512\relax{\phantom{0}}1.2} -2.9+2.8subscriptsuperscriptabsent2.82.9{}^{\mathchar 43\relax{\phantom{0}}2.8}_{\mathchar 512\relax{\phantom{0}}2.9}
σth[pb]superscript𝜎thdelimited-[]pb\sigma^{\rm th}\,[{\rm pb}] 7.97.9{\phantom{0}}7.9 12.212.212.2 15.115.115.1 15.715.715.7 10.610.610.6 3.73.7{\phantom{0}}3.7 65.865.865.8
Systematic checks
Check ΔσexpΔsuperscript𝜎exp\Delta\sigma^{\rm exp} [%]
E𝐸E scale +3%percent3\mathchar 43\relax 3\% (+5%percent5\mathchar 43\relax 5\% in FCAL) 14.214.2{\phantom{\mathchar 512\relax}}14.2 7.17.1{\phantom{\mathchar 512\relax 0}}7.1 2.82.8{\phantom{\mathchar 512\relax 0}}2.8 0.90.9{\phantom{\mathchar 512\relax 0}}0.9 3.93.9-{\phantom{0}}3.9 24.924.9-24.9 2.02.0{\phantom{\mathchar 512\relax 0}}2.0
E𝐸E scale -3%percent3\mathchar 512\relax 3\% (-5%percent5\mathchar 512\relax 5\% in FCAL) 10.910.9-10.9 7.87.8-{\phantom{0}}7.8 2.62.6-{\phantom{0}}2.6 1.21.2{\phantom{\mathchar 512\relax 0}}1.2 9.59.5{\phantom{\mathchar 512\relax 0}}9.5 26.926.9{\phantom{\mathchar 512\relax}}26.9 1.11.1{\phantom{\mathchar 512\relax 0}}1.1
Unfolding 0.50.5-{\phantom{0}}0.5 0.00.0{\phantom{\mathchar 512\relax 0}}0.0 3.33.3-{\phantom{0}}3.3 4.24.2-{\phantom{0}}4.2 9.39.3-{\phantom{0}}9.3 24.324.3{\phantom{\mathchar 512\relax}}24.3 2.12.1-{\phantom{0}}2.1
Q2,x,ysuperscript𝑄2𝑥𝑦Q^{2},x,y reconstruction 15.215.2-15.2 5.95.9-{\phantom{0}}5.9 2.22.2{\phantom{\mathchar 512\relax 0}}2.2 6.86.8{\phantom{\mathchar 512\relax 0}}6.8 7.87.8{\phantom{\mathchar 512\relax 0}}7.8 14.514.5-14.5 1.01.0-{\phantom{0}}1.0
Nbg+ΔNbgsubscript𝑁bgΔsubscript𝑁bgN_{\rm bg}+\Delta N_{\rm bg} 25.925.9-25.9 5.05.0-{\phantom{0}}5.0 0.00.0{\phantom{\mathchar 512\relax 0}}0.0 0.00.0{\phantom{\mathchar 512\relax 0}}0.0 0.00.0{\phantom{\mathchar 512\relax 0}}0.0 0.00.0{\phantom{\mathchar 512\relax 0}}0.0 4.04.0-{\phantom{0}}4.0
NbgΔNbgsubscript𝑁bgΔsubscript𝑁bgN_{\rm bg}-\Delta N_{\rm bg} 11.111.1{\phantom{\mathchar 512\relax}}11.1 2.72.7{\phantom{\mathchar 512\relax 0}}2.7 0.00.0{\phantom{\mathchar 512\relax 0}}0.0 0.00.0{\phantom{\mathchar 512\relax 0}}0.0 0.00.0{\phantom{\mathchar 512\relax 0}}0.0 0.00.0{\phantom{\mathchar 512\relax 0}}0.0 1.71.7{\phantom{\mathchar 512\relax 0}}1.7

Table 3: Cross sections for CC epsuperscript𝑒𝑝e^{-}p scattering in intervals of Q2superscript𝑄2Q^{2}, and for Q2>200GeV2superscript𝑄2200superscriptGeV2Q^{2}>200\,{\rm Ge}\kern-1.0pt{\rm V}^{2}. The rows denoted Nevtsubscript𝑁evtN_{\rm evt}, Q2delimited-⟨⟩superscript𝑄2\langle Q^{2}\rangle, Nbgsubscript𝑁bgN_{\rm bg}, ζ𝜁\zeta, ξ𝜉\xi, σexpsuperscript𝜎exp\sigma^{\rm exp}, and σthsuperscript𝜎th\sigma^{\rm th} show the raw event numbers, the mean Q2superscript𝑄2Q^{2} according to the SM prediction, the estimated number of background events from photoproduction, the bin–by–bin acceptance corrections, the purities, the experimental cross sections, and the theoretical cross sections, respectively. For σexpsuperscript𝜎exp\sigma^{\rm exp} the statistical errors Δσexp[stat]Δsuperscript𝜎expdelimited-[]stat\Delta\sigma^{\rm exp}\,{\rm[stat]} and systematic uncertainties Δσexp[syst]Δsuperscript𝜎expdelimited-[]syst\Delta\sigma^{\rm exp}\,{\rm[syst]} are quoted. The latter are calculated from the deviations resulting from the systematic studies described in the text (including the luminosity uncertainty of 2%percent22\% and the overall uncertainty of 3%percent33\% assigned to the efficiency of those selection cuts involving track quantities). The dominant contributions are detailed in the lower part of the table.
x𝑥x
0.0060.0060.006 0.0140.0140.014 0.0330.0330.033 0.0760.0760.076 0.170.170.17 0.400.400.40
e+psuperscript𝑒𝑝e^{+}p - 0- 0- - - -
0.0140.0140.014 0.0330.0330.033 0.0760.0760.076 0.170.170.17{\phantom{0}} 0.400.400.40 1.01.01.0{\phantom{0}}
Nevtsubscript𝑁evtN_{\rm evt} 33{\phantom{0}}3{\phantom{.0}} 202020{\phantom{.0}} 111111{\phantom{.0}} 131313{\phantom{.0}} 99{\phantom{0}}9{\phantom{.0}} 00{\phantom{0}}0{\phantom{.0}}
xdelimited-⟨⟩𝑥\langle x\rangle 0.0100.0100.010 0.0230.0230.023 0.0520.0520.052 0.1150.1150.115 0.2490.2490.249 0.4800.4800.480
Nbgsubscript𝑁bgN_{\rm bg} 1.41.4{\phantom{0}}1.4 00{\phantom{0}}0{\phantom{.0}} 00{\phantom{0}}0{\phantom{.0}} 00{\phantom{0}}0{\phantom{.0}} 00{\phantom{0}}0{\phantom{.0}} 00{\phantom{0}}0{\phantom{.0}}
ζ𝜁\zeta 0.410.410.41 0.780.780.78 0.790.790.79 0.680.680.68 0.480.480.48 0.180.180.18
ξ𝜉\xi 0.680.680.68 0.720.720.72 0.770.770.77 0.820.820.82 0.880.880.88 0.840.840.84
σexp[pb]superscript𝜎expdelimited-[]pb\sigma^{\rm exp}\,[{\rm pb}] 1.31.3{\phantom{0}}1.3 8.78.7{\phantom{0}}8.7 4.74.7{\phantom{0}}4.7 6.56.5{\phantom{0}}6.5 6.46.4{\phantom{0}}6.4 0.00.0{\phantom{0}}0.0
Δσexp[stat][pb]Δsuperscript𝜎expdelimited-[]statdelimited-[]pb\Delta\sigma^{\rm exp}\,{\rm[stat]}\;[{\rm pb}] -0.7+1.3subscriptsuperscriptabsent1.30.7{}^{\mathchar 43\relax{\phantom{0}}1.3}_{\mathchar 512\relax{\phantom{0}}0.7} -1.9+2.4subscriptsuperscriptabsent2.41.9{}^{\mathchar 43\relax{\phantom{0}}2.4}_{\mathchar 512\relax{\phantom{0}}1.9} -1.4+1.9subscriptsuperscriptabsent1.91.4{}^{\mathchar 43\relax{\phantom{0}}1.9}_{\mathchar 512\relax{\phantom{0}}1.4} -1.8+2.3subscriptsuperscriptabsent2.31.8{}^{\mathchar 43\relax{\phantom{0}}2.3}_{\mathchar 512\relax{\phantom{0}}1.8} -2.1+2.9subscriptsuperscriptabsent2.92.1{}^{\mathchar 43\relax{\phantom{0}}2.9}_{\mathchar 512\relax{\phantom{0}}2.1} -0.0+3.5subscriptsuperscriptabsent3.50.0{}^{\mathchar 43\relax{\phantom{0}}3.5}_{\mathchar 512\relax{\phantom{0}}0.0}
Δσexp[syst][pb]Δsuperscript𝜎expdelimited-[]systdelimited-[]pb\Delta\sigma^{\rm exp}\,{\rm[syst]}\;[{\rm pb}] -1.3+1.0subscriptsuperscriptabsent1.01.3{}^{\mathchar 43\relax{\phantom{0}}1.0}_{\mathchar 512\relax{\phantom{0}}1.3} -0.7+0.5subscriptsuperscriptabsent0.50.7{}^{\mathchar 43\relax{\phantom{0}}0.5}_{\mathchar 512\relax{\phantom{0}}0.7} -0.2+0.4subscriptsuperscriptabsent0.40.2{}^{\mathchar 43\relax{\phantom{0}}0.4}_{\mathchar 512\relax{\phantom{0}}0.2} -0.7+0.5subscriptsuperscriptabsent0.50.7{}^{\mathchar 43\relax{\phantom{0}}0.5}_{\mathchar 512\relax{\phantom{0}}0.7} -0.6+0.8subscriptsuperscriptabsent0.80.6{}^{\mathchar 43\relax{\phantom{0}}0.8}_{\mathchar 512\relax{\phantom{0}}0.6} -0.0+0.0subscriptsuperscriptabsent0.00.0{}^{\mathchar 43\relax{\phantom{0}}0.0}_{\mathchar 512\relax{\phantom{0}}0.0}
σth[pb]superscript𝜎thdelimited-[]pb\sigma^{\rm th}\,[{\rm pb}] 3.43.4{\phantom{0}}3.4 6.36.3{\phantom{0}}6.3 8.48.4{\phantom{0}}8.4 8.38.3{\phantom{0}}8.3 4.24.2{\phantom{0}}4.2 0.50.5{\phantom{0}}0.5
x𝑥x
0.0060.0060.006 0.0140.0140.014 0.0330.0330.033 0.0760.0760.076 0.170.170.17 0.400.400.40
epsuperscript𝑒𝑝e^{-}p - 0- 0- - - -
0.0140.0140.014 0.0330.0330.033 0.0760.0760.076 0.170.170.17{\phantom{0}} 0.400.400.40 1.01.01.0{\phantom{0}}
Nevtsubscript𝑁evtN_{\rm evt} 33{\phantom{0}}3{\phantom{.0}} 55{\phantom{0}}5{\phantom{.0}} 55{\phantom{0}}5{\phantom{.0}} 999{\phantom{.0}} 88{\phantom{0}}8{\phantom{.0}} 00{\phantom{0}}0{\phantom{.0}}
xdelimited-⟨⟩𝑥\langle x\rangle 0.0100.0100.010 0.0240.0240.024 0.0530.0530.053 0.1190.1190.119 0.2560.2560.256 0.4890.4890.489
Nbgsubscript𝑁bgN_{\rm bg} 0.40.4{\phantom{0}}0.4 00{\phantom{0}}0{\phantom{.0}} 00{\phantom{0}}0{\phantom{.0}} 00{\phantom{0}}0{\phantom{.0}} 00{\phantom{0}}0{\phantom{.0}} 00{\phantom{0}}0{\phantom{.0}}
ζ𝜁\zeta 0.410.410.41 0.770.770.77 0.840.840.84 0.720.720.72 0.550.550.55 0.170.170.17
ξ𝜉\xi 0.610.610.61 0.730.730.73 0.730.730.73 0.850.850.85 0.870.870.87 0.830.830.83
σexp[pb]superscript𝜎expdelimited-[]pb\sigma^{\rm exp}\,[{\rm pb}] 7.87.8{\phantom{0}}7.8 7.97.9{\phantom{0}}7.9 7.37.3{\phantom{0}}7.3 15.315.315.3 17.617.617.6 0.00.0{\phantom{0}}0.0
Δσexp[stat][pb]Δsuperscript𝜎expdelimited-[]statdelimited-[]pb\Delta\sigma^{\rm exp}\,{\rm[stat]}\;[{\rm pb}] -4.2+7.6subscriptsuperscriptabsent7.64.2{}^{\mathchar 43\relax{\phantom{0}}7.6}_{\mathchar 512\relax{\phantom{0}}4.2} -3.4+5.3subscriptsuperscriptabsent5.33.4{}^{\mathchar 43\relax{\phantom{0}}5.3}_{\mathchar 512\relax{\phantom{0}}3.4} -3.2+4.9subscriptsuperscriptabsent4.93.2{}^{\mathchar 43\relax{\phantom{0}}4.9}_{\mathchar 512\relax{\phantom{0}}3.2} -5.1+7.0subscriptsuperscriptabsent7.05.1{}^{\mathchar 43\relax{\phantom{0}}7.0}_{\mathchar 512\relax{\phantom{0}}5.1} -6.3+8.7subscriptsuperscriptabsent8.76.3{}^{\mathchar 43\relax{\phantom{0}}8.7}_{\mathchar 512\relax{\phantom{0}}6.3} -0.0+13.2subscriptsuperscriptabsent13.20.0{}^{\mathchar 43\relax 13.2}_{\mathchar 512\relax{\phantom{0}}0.0}
Δσexp[syst][pb]Δsuperscript𝜎expdelimited-[]systdelimited-[]pb\Delta\sigma^{\rm exp}\,{\rm[syst]}\;[{\rm pb}] -2.5+1.5subscriptsuperscriptabsent1.52.5{}^{\mathchar 43\relax{\phantom{0}}1.5}_{\mathchar 512\relax{\phantom{0}}2.5} -0.7+0.7subscriptsuperscriptabsent0.70.7{}^{\mathchar 43\relax{\phantom{0}}0.7}_{\mathchar 512\relax{\phantom{0}}0.7} -0.5+0.4subscriptsuperscriptabsent0.40.5{}^{\mathchar 43\relax{\phantom{0}}0.4}_{\mathchar 512\relax{\phantom{0}}0.5} -2.0+1.1subscriptsuperscriptabsent1.12.0{}^{\mathchar 43\relax{\phantom{0}}1.1}_{\mathchar 512\relax{\phantom{0}}2.0} -1.6+3.0subscriptsuperscriptabsent3.01.6{}^{\mathchar 43\relax{\phantom{0}}3.0}_{\mathchar 512\relax{\phantom{0}}1.6} -0.0+0.0subscriptsuperscriptabsent0.00.0{}^{\mathchar 43\relax{\phantom{0}}0.0}_{\mathchar 512\relax{\phantom{0}}0.0}
σth[pb]superscript𝜎thdelimited-[]pb\sigma^{\rm th}\,[{\rm pb}] 4.24.2{\phantom{0}}4.2 8.48.4{\phantom{0}}8.4 14.914.914.9 19.219.219.2 14.814.814.8 2.72.7{\phantom{0}}2.7
Table 4: Cross sections for CC e+psuperscript𝑒𝑝e^{+}p (top) and epsuperscript𝑒𝑝e^{-}p (bottom) scattering for Q2>200GeV2superscript𝑄2200superscriptGeV2Q^{2}>200\,{\rm Ge}\kern-1.0pt{\rm V}^{2} in intervals of x𝑥x. The rows denoted Nevtsubscript𝑁evtN_{\rm evt}, xdelimited-⟨⟩𝑥\langle x\rangle, Nbgsubscript𝑁bgN_{\rm bg}, ζ𝜁\zeta, ξ𝜉\xi, σexpsuperscript𝜎exp\sigma^{\rm exp}, and σthsuperscript𝜎th\sigma^{\rm th} show the raw event numbers, the mean x𝑥x according to the SM prediction, the estimated number of background events from photoproduction, the bin–by–bin acceptance corrections, the purities, the experimental cross sections, and the theoretical cross sections, respectively. For σexpsuperscript𝜎exp\sigma^{\rm exp} the statistical errors Δσexp[stat]Δsuperscript𝜎expdelimited-[]stat\Delta\sigma^{\rm exp}\,{\rm[stat]} and systematic uncertainties Δσexp[syst]Δsuperscript𝜎expdelimited-[]syst\Delta\sigma^{\rm exp}\,{\rm[syst]} are quoted.
y𝑦y
0.00.00.0 0.20.20.2 0.40.40.4 0.60.60.6 0.80.80.8
e+psuperscript𝑒𝑝e^{+}p -{\phantom{0}} -{\phantom{0}} -{\phantom{0}} -{\phantom{0}} -{\phantom{0}}
0.20.20.2 0.40.40.4 0.60.60.6 0.80.80.8 1.01.01.0
Nevtsubscript𝑁evtN_{\rm evt} 141414{\phantom{.0}} 272727{\phantom{.0}} 111111{\phantom{.0}} 33{\phantom{0}}3{\phantom{.0}} 11{\phantom{0}}1{\phantom{.0}}
ydelimited-⟨⟩𝑦\langle y\rangle 0.1010.1010.101 0.2930.2930.293 0.4960.4960.496 0.6950.6950.695 0.8950.8950.895
Nbgsubscript𝑁bgN_{\rm bg} 00{\phantom{0}}0{\phantom{.0}} 0.20.2{\phantom{0}}0.2 1.21.2{\phantom{0}}1.2 00{\phantom{0}}0{\phantom{.0}} 00{\phantom{0}}0{\phantom{.0}}
ζ𝜁\zeta 0.490.490.49 0.860.860.86 0.790.790.79 0.730.730.73 0.150.150.15
ξ𝜉\xi 0.900.900.90 0.790.790.79 0.770.770.77 0.700.700.70 0.800.800.80
σexp[pb]superscript𝜎expdelimited-[]pb\sigma^{\rm exp}\,[{\rm pb}] 9.69.69.6 10.710.710.7 4.24.2{\phantom{0}}4.2 1.41.4{\phantom{0}}1.4 2.32.3{\phantom{0}}2.3
Δσexp[stat][pb]Δsuperscript𝜎expdelimited-[]statdelimited-[]pb\Delta\sigma^{\rm exp}\,{\rm[stat]}\;[{\rm pb}] -2.5+3.3subscriptsuperscriptabsent3.32.5{}^{\mathchar 43\relax{\phantom{0}}3.3}_{\mathchar 512\relax{\phantom{0}}2.5} -2.1+2.5subscriptsuperscriptabsent2.52.1{}^{\mathchar 43\relax{\phantom{0}}2.5}_{\mathchar 512\relax{\phantom{0}}2.1} -1.3+1.7subscriptsuperscriptabsent1.71.3{}^{\mathchar 43\relax{\phantom{0}}1.7}_{\mathchar 512\relax{\phantom{0}}1.3} -0.8+1.4subscriptsuperscriptabsent1.40.8{}^{\mathchar 43\relax{\phantom{0}}1.4}_{\mathchar 512\relax{\phantom{0}}0.8} -1.9+5.4subscriptsuperscriptabsent5.41.9{}^{\mathchar 43\relax{\phantom{0}}5.4}_{\mathchar 512\relax{\phantom{0}}1.9}
Δσexp[syst][pb]Δsuperscript𝜎expdelimited-[]systdelimited-[]pb\Delta\sigma^{\rm exp}\,{\rm[syst]}\;[{\rm pb}] -0.7+0.5subscriptsuperscriptabsent0.50.7{}^{\mathchar 43\relax{\phantom{0}}0.5}_{\mathchar 512\relax{\phantom{0}}0.7} -0.5+0.6subscriptsuperscriptabsent0.60.5{}^{\mathchar 43\relax{\phantom{0}}0.6}_{\mathchar 512\relax{\phantom{0}}0.5} -1.0+0.6subscriptsuperscriptabsent0.61.0{}^{\mathchar 43\relax{\phantom{0}}0.6}_{\mathchar 512\relax{\phantom{0}}1.0} -0.1+0.2subscriptsuperscriptabsent0.20.1{}^{\mathchar 43\relax{\phantom{0}}0.2}_{\mathchar 512\relax{\phantom{0}}0.1} -1.1+0.6subscriptsuperscriptabsent0.61.1{}^{\mathchar 43\relax{\phantom{0}}0.6}_{\mathchar 512\relax{\phantom{0}}1.1}
σth[pb]superscript𝜎thdelimited-[]pb\sigma^{\rm th}\,[{\rm pb}] 11.811.811.8 8.38.3{\phantom{0}}8.3 5.45.4{\phantom{0}}5.4 3.73.7{\phantom{0}}3.7 3.03.0{\phantom{0}}3.0
y𝑦y
0.00.00.0 0.20.20.2 0.40.40.4 0.60.60.6 0.80.80.8
epsuperscript𝑒𝑝e^{-}p -{\phantom{0}} -{\phantom{0}} -{\phantom{0}} -{\phantom{0}} -{\phantom{0}}
0.20.20.2 0.40.40.4 0.60.60.6 0.80.80.8 1.01.01.0
Nevtsubscript𝑁evtN_{\rm evt} 66{\phantom{0}}6{\phantom{.0}} 55{\phantom{0}}5{\phantom{.0}} 111111{\phantom{.0}} 55{\phantom{0}}5{\phantom{.0}} 33{\phantom{0}}3{\phantom{.0}}
ydelimited-⟨⟩𝑦\langle y\rangle 0.1010.1010.101 0.2930.2930.293 0.4960.4960.496 0.6960.6960.696 0.8950.8950.895
Nbgsubscript𝑁bgN_{\rm bg} 00{\phantom{0}}0{\phantom{.0}} 0.10.1{\phantom{0}}0.1 0.30.3{\phantom{0}}0.3 00{\phantom{0}}0{\phantom{.0}} 00{\phantom{0}}0{\phantom{.0}}
ζ𝜁\zeta 0.510.510.51 0.910.910.91 0.810.810.81 0.770.770.77 0.200.200.20
ξ𝜉\xi 0.920.920.92 0.790.790.79 0.810.810.81 0.740.740.74 0.900.900.90
σexp[pb]superscript𝜎expdelimited-[]pb\sigma^{\rm exp}\,[{\rm pb}] 14.414.414.4 6.66.6{\phantom{0}}6.6 16.216.216.2 7.97.9{\phantom{0}}7.9 19.019.0{\phantom{0}}19.0
Δσexp[stat][pb]Δsuperscript𝜎expdelimited-[]statdelimited-[]pb\Delta\sigma^{\rm exp}\,{\rm[stat]}\;[{\rm pb}] -5.7+8.6subscriptsuperscriptabsent8.65.7{}^{\mathchar 43\relax{\phantom{0}}8.6}_{\mathchar 512\relax{\phantom{0}}5.7} -2.9+4.4subscriptsuperscriptabsent4.42.9{}^{\mathchar 43\relax{\phantom{0}}4.4}_{\mathchar 512\relax{\phantom{0}}2.9} -4.9+6.4subscriptsuperscriptabsent6.44.9{}^{\mathchar 43\relax{\phantom{0}}6.4}_{\mathchar 512\relax{\phantom{0}}4.9} -3.4+5.2subscriptsuperscriptabsent5.23.4{}^{\mathchar 43\relax{\phantom{0}}5.2}_{\mathchar 512\relax{\phantom{0}}3.4} -10.3+18.5subscriptsuperscriptabsent18.510.3{}^{\mathchar 43\relax 18.5}_{\mathchar 512\relax 10.3}
Δσexp[syst][pb]Δsuperscript𝜎expdelimited-[]systdelimited-[]pb\Delta\sigma^{\rm exp}\,{\rm[syst]}\;[{\rm pb}] -1.6+1.2subscriptsuperscriptabsent1.21.6{}^{\mathchar 43\relax{\phantom{0}}1.2}_{\mathchar 512\relax{\phantom{0}}1.6} -0.4+0.3subscriptsuperscriptabsent0.30.4{}^{\mathchar 43\relax{\phantom{0}}0.3}_{\mathchar 512\relax{\phantom{0}}0.4} -1.4+1.3subscriptsuperscriptabsent1.31.4{}^{\mathchar 43\relax{\phantom{0}}1.3}_{\mathchar 512\relax{\phantom{0}}1.4} -0.5+0.8subscriptsuperscriptabsent0.80.5{}^{\mathchar 43\relax{\phantom{0}}0.8}_{\mathchar 512\relax{\phantom{0}}0.5} -7.6+4.4subscriptsuperscriptabsent4.47.6{}^{\mathchar 43\relax{\phantom{0}}4.4}_{\mathchar 512\relax{\phantom{0}}7.6}
σth[pb]superscript𝜎thdelimited-[]pb\sigma^{\rm th}\,[{\rm pb}] 23.723.723.7 15.615.615.6 11.011.011.0 8.78.7{\phantom{0}}8.7 6.96.9{\phantom{0}}6.9
Table 5: Cross sections for CC e+psuperscript𝑒𝑝e^{+}p (top) and epsuperscript𝑒𝑝e^{-}p (bottom) scattering for Q2>200GeV2superscript𝑄2200superscriptGeV2Q^{2}>200\,{\rm Ge}\kern-1.0pt{\rm V}^{2} in intervals of y𝑦y. The rows denoted Nevtsubscript𝑁evtN_{\rm evt}, ydelimited-⟨⟩𝑦\langle y\rangle, Nbgsubscript𝑁bgN_{\rm bg}, ζ𝜁\zeta, ξ𝜉\xi, σexpsuperscript𝜎exp\sigma^{\rm exp}, and σthsuperscript𝜎th\sigma^{\rm th} show the raw event numbers, the mean y𝑦y according to the SM prediction, the estimated number of background events from photoproduction, the bin–by–bin acceptance corrections, the purities, the experimental cross sections, and the theoretical cross sections, respectively. For σexpsuperscript𝜎exp\sigma^{\rm exp} the statistical errors Δσexp[stat]Δsuperscript𝜎expdelimited-[]stat\Delta\sigma^{\rm exp}\,{\rm[stat]} and systematic uncertainties Δσexp[syst]Δsuperscript𝜎expdelimited-[]syst\Delta\sigma^{\rm exp}\,{\rm[syst]} are quoted.
Distribution χ2superscript𝜒2\chi^{2} NDOFsubscript𝑁DOFN_{\rm DOF} p(χ2,NDOF)𝑝superscript𝜒2subscript𝑁DOFp(\chi^{2},N_{\rm DOF})
dσ/dQ2(e+p)𝑑𝜎𝑑superscript𝑄2superscript𝑒𝑝d\sigma/d\,Q^{2}\;(e^{+}p) 1.9 5 0.86
dσ/dQ2(ep)𝑑𝜎𝑑superscript𝑄2superscript𝑒𝑝d\sigma/d\,Q^{2}\;(e^{-}p) 3.2 6 0.78
dσ/dx(e+p)𝑑𝜎𝑑𝑥superscript𝑒𝑝d\sigma/d\,x\;(e^{+}p) 9.9 5 0.08
dσ/dx(ep)𝑑𝜎𝑑𝑥superscript𝑒𝑝d\sigma/d\,x\;(e^{-}p) 3.7 5 0.59
dσ/dy(e+p)𝑑𝜎𝑑𝑦superscript𝑒𝑝d\sigma/d\,y\;(e^{+}p) 5.0 5 0.42
dσ/dy(ep)𝑑𝜎𝑑𝑦superscript𝑒𝑝d\sigma/d\,y\;(e^{-}p) 7.8 5 0.17
Table 6: Quality of agreement between experimental results and SM predictions: for the various differential cross sections χ2superscript𝜒2\chi^{2}, NDOFsubscript𝑁DOFN_{\rm DOF}, and p(χ2,NDOF)𝑝superscript𝜒2subscript𝑁DOFp(\chi^{2},N_{\rm DOF}) denote the χ2superscript𝜒2\chi^{2} value calculated using statistical errors only, the number of degrees of freedom, and the corresponding χ2superscript𝜒2\chi^{2}–probability.

e+psuperscript𝑒𝑝e^{+}p epsuperscript𝑒𝑝e^{-}p Njetssubscript𝑁jetsN_{\rm jets} Nevtsubscript𝑁evtN_{\rm evt} Rjetdata[%]R_{\rm jet}^{\rm data}\;[\%] RjetMC[%]R_{\rm jet}^{\rm MC}\;[\%] Nevtsubscript𝑁evtN_{\rm evt} Rjetdata[%]R_{\rm jet}^{\rm data}\;[\%] RjetMC[%]R_{\rm jet}^{\rm MC}\;[\%] aria. meps aria. meps 0 00{\phantom{0}}0 0.00.0+3.2{\phantom{0}}0.0\,{}^{+3.2}_{-0.0} 0.4±0.1plus-or-minus0.40.1{\phantom{0}}0.4\pm 0.1 0.4±0.1plus-or-minus0.40.1{\phantom{0}}0.4\pm 0.1 00{\phantom{0}}0 0.00.0+6.0{\phantom{0}}0.0\,{}^{+6.0}_{-0.0} 0.3±0.1plus-or-minus0.30.1{\phantom{0}}0.3\pm 0.1 0.4±0.1plus-or-minus0.40.1{\phantom{0}}0.4\pm 0.1 1 494949 87.56.1+4.587.5\,{}^{+4.5}_{-6.1} 90.9±0.4plus-or-minus90.90.490.9\pm 0.4 82.2±0.6plus-or-minus82.20.682.2\pm 0.6 272727 90.08.8+5.490.0\,{}^{+5.4}_{-8.8} 91.6±0.4plus-or-minus91.60.491.6\pm 0.4 83.3±0.5plus-or-minus83.30.583.3\pm 0.5 2 66{\phantom{0}}6 10.74.2+5.910.7\,{}^{+5.9}_{-4.2} 8.4±0.4plus-or-minus8.40.4{\phantom{0}}8.4\pm 0.4 16.3±0.5plus-or-minus16.30.516.3\pm 0.5 33{\phantom{0}}3 10.05.4+8.810.0\,{}^{+8.8}_{-5.4} 7.8±0.4plus-or-minus7.80.4{\phantom{0}}7.8\pm 0.4 14.6±0.5plus-or-minus14.60.514.6\pm 0.5 3 11{\phantom{0}}1 1.81.5+4.0{\phantom{0}}1.8\,{}^{+4.0}_{-1.5} 0.3±0.1plus-or-minus0.30.1{\phantom{0}}0.3\pm 0.1 1.1±0.2plus-or-minus1.10.2{\phantom{0}}1.1\pm 0.2 00{\phantom{0}}0 0.00.0+6.0{\phantom{0}}0.0\,{}^{+6.0}_{-0.0} 0.3±0.1plus-or-minus0.30.1{\phantom{0}}0.3\pm 0.1 1.2±0.2plus-or-minus1.20.2{\phantom{0}}1.2\pm 0.2

Table 7: Jet rates for e+psuperscript𝑒𝑝e^{+}p and epsuperscript𝑒𝑝e^{-}p data. The columns denoted Nevtsubscript𝑁evtN_{\rm evt} show the numbers of events in the CC samples which have Njetssubscript𝑁jetsN_{\rm jets} jets in addition to the proton remnant (for the jet definition see text). The Rjetdatasuperscriptsubscript𝑅jetdataR_{\rm jet}^{\rm data} are the corresponding jet rates, which are also given for the ariadne and meps MC simulations (RjetMCsuperscriptsubscript𝑅jetMCR_{\rm jet}^{\rm MC}). Only statistical errors are shown.
data set RLRG[%]R_{\rm LRG}\,[\%] εLRG[%]\varepsilon_{\rm LRG}\,[\%]
CC e+psuperscript𝑒𝑝e^{+}p 1.8 1.5+ 4.0{\phantom{0}}1.8\,{}^{+\;4.0}_{-\;1.5}
ariadne e+psuperscript𝑒𝑝e^{+}p 0.9 0.1+ 0.2{\phantom{0}}0.9\,{}^{+\;0.2}_{-\;0.1} 434343
meps e+psuperscript𝑒𝑝e^{+}p 0.3±0.1plus-or-minus0.30.1{\phantom{0}}0.3\pm 0.1 393939
pompyt e+psuperscript𝑒𝑝e^{+}p 13.8±0.5plus-or-minus13.80.513.8\pm 0.5 535353
NC control sample (e+psuperscript𝑒𝑝e^{+}p) 0.9±0.4plus-or-minus0.90.4{\phantom{0}}0.9\pm 0.4
Table 8: The fraction of large rapidity gap (LRG) events in the e+psuperscript𝑒𝑝e^{+}p CC sample, in the ariadne, meps and pompyt CC MC sets, and in the NC control sample. RLRGsubscript𝑅LRGR_{\rm LRG} denotes the fraction of events with ηmax<2.5subscript𝜂max2.5\eta_{\rm max}<2.5 and cosθH<0.75subscript𝜃𝐻0.75\cos\theta_{H}<0.75 (LRG events) in the total samples passing the CC selection cuts. For the NC control sample, RLRGsubscript𝑅LRGR_{\rm LRG} is calculated from the sums of cross–section weights as described in section 3.3. The selection efficiency εLRGsubscript𝜀LRG\varepsilon_{\rm LRG} is defined as the ratio of the number of events which pass the CC cuts, fulfil the LRG requirement and have Qcor2>200GeV2subscriptsuperscript𝑄2cor200superscriptGeV2Q^{2}_{\rm cor}>200\,{\rm Ge}\kern-1.0pt{\rm V}^{2} to the number of events having ηmax<2.5subscript𝜂max2.5\eta_{\rm max}<2.5 and Q2>200GeV2superscript𝑄2200superscriptGeV2Q^{2}>200\,{\rm Ge}\kern-1.0pt{\rm V}^{2} at the generator level.

Refer to caption

Figure 1: Distribution of events in the (x,Q2)𝑥superscript𝑄2(x,Q^{2}) plane. The filled (open) circles indicate the selected e+psuperscript𝑒𝑝e^{+}p (epsuperscript𝑒𝑝e^{-}p) CC events in a sample with integrated luminosity of 2.93pb12.93superscriptpb12.93\,{\rm pb}^{-1} (0.82pb10.82superscriptpb10.82\,{\rm pb}^{-1}). The horizontal lines of the grid show the Q2superscript𝑄2Q^{2}, the vertival lines the x𝑥x bins used for the analysis. The solid diagonal line indicates the kinematic limit y=1𝑦1y=1.

Refer to caption

Figure 2: Differential CC cross section versus Q2superscript𝑄2Q^{2}. In a), the filled (open) dots and the solid (dashed) curve represent the measured values and the Standard Model (SM) prediction of dσ/dQ2𝑑𝜎𝑑superscript𝑄2d\sigma/d\,Q^{2} for e+psuperscript𝑒𝑝e^{+}p (epsuperscript𝑒𝑝e^{-}p) collisions. Plot b) shows (dσe+pν¯X/dQ2)/(dσepνX/dQ2)𝑑subscript𝜎superscript𝑒𝑝¯𝜈𝑋𝑑superscript𝑄2𝑑subscript𝜎superscript𝑒𝑝𝜈𝑋𝑑superscript𝑄2{(d\sigma_{e^{+}p\to{\overline{\nu}}X}/d\,Q^{2})/(d\sigma_{e^{-}p\to\nu X}/d\,Q^{2})}. The error bars indicate the statistical and systematic uncertainties combined in quadrature. The horizontal position of the points is given by the generator level Q2superscript𝑄2Q^{2} average of the MC events in each bin.

Refer to caption

Figure 3: Differential CC cross section versus x𝑥x for Q2>200GeV2superscript𝑄2200superscriptGeV2Q^{2}>200\,{\rm Ge}\kern-1.0pt{\rm V}^{2}. In a), the filled (open) dots and the solid (dashed) curve represent the measured values and the Standard Model (SM) prediction of dσ/dx𝑑𝜎𝑑𝑥d\sigma/d\,x for e+psuperscript𝑒𝑝e^{+}p (epsuperscript𝑒𝑝e^{-}p) collisions. Plot b) shows (dσe+pν¯X/dx)/(dσepνX/dx)𝑑subscript𝜎superscript𝑒𝑝¯𝜈𝑋𝑑𝑥𝑑subscript𝜎superscript𝑒𝑝𝜈𝑋𝑑𝑥{(d\sigma_{e^{+}p\to{\overline{\nu}}X}/d\,x)/(d\sigma_{e^{-}p\to\nu X}/d\,x)}. The error bars indicate the statistical and systematic uncertainties combined in quadrature. The horizontal position of the points is given by the generator level x𝑥x average of the MC events in each bin.

Refer to caption

Figure 4: Differential CC cross section versus y𝑦y for Q2>200GeV2superscript𝑄2200superscriptGeV2Q^{2}>200\,{\rm Ge}\kern-1.0pt{\rm V}^{2}. In a), the filled (open) dots and the solid (dashed) curve represent the measured values and the Standard Model (SM) prediction of dσ/dy𝑑𝜎𝑑𝑦d\sigma/d\,y for e+psuperscript𝑒𝑝e^{+}p (epsuperscript𝑒𝑝e^{-}p) collisions. Plot b) shows (dσe+pν¯X/dy)/(dσepνX/dy)𝑑subscript𝜎superscript𝑒𝑝¯𝜈𝑋𝑑𝑦𝑑subscript𝜎superscript𝑒𝑝𝜈𝑋𝑑𝑦{(d\sigma_{e^{+}p\to{\overline{\nu}}X}/d\,y)/(d\sigma_{e^{-}p\to\nu X}/d\,y)}. The error bars indicate the statistical and systematic uncertainties combined in quadrature. The horizontal position of the points is given by the generator level y𝑦y average of the MC events in each bin.

Refer to caption

Figure 5: Differential CC cross section versus y𝑦y for Q2>200GeV2superscript𝑄2200superscriptGeV2Q^{2}>200\,{\rm Ge}\kern-1.0pt{\rm V}^{2}, a) for x<0.1𝑥0.1x<0.1 and b) for x>0.1𝑥0.1x>0.1. The filled (open) dots and the solid (dashed) curves represent the measured values and the Standard Model (SM) prediction of dσ/dy𝑑𝜎𝑑𝑦d\sigma/d\,y for e+psuperscript𝑒𝑝e^{+}p (epsuperscript𝑒𝑝e^{-}p) collisions. The error bars indicate the statistical and systematic uncertainties combined in quadrature. The horizontal position of the points is given by the generator level y𝑦y average of the MC events in each bin.

Refer to caption

Figure 6: Plots a) and b) show the distributions of transverse momenta and pseudorapidities of all jets found in the e+psuperscript𝑒𝑝e^{+}p sample. Plots c) and d) give the transverse energy profiles in η𝜂\eta and ϕitalic-ϕ\phi for jets in events with exactly one jet. Positive ΔηΔ𝜂\Delta\eta values correspond to angles between the jet axis and the forward direction. The points denote the data and the solid (dashed) histograms represent the ariadne (meps) Monte Carlo predictions including detector effects. In plots a) and b) the MC predictions have been normalized to the number of jets observed in the data.

Refer to caption

Figure 7: Plots a) and b) show the distributions of transverse momenta and pseudorapidities of all jets found in the epsuperscript𝑒𝑝e^{-}p sample. Plots c) and d) give the transverse energy profiles in η𝜂\eta and ϕitalic-ϕ\phi for jets in events with exactly one jet. Positive ΔηΔ𝜂\Delta\eta values correspond to angles between the jet axis and the forward direction. The points denote the data and the solid (dashed) histograms represent the ariadne (meps) Monte Carlo predictions including detector effects. In plots a) and b) the MC predictions have been normalized to the number of jets observed in the data.

Refer to caption

Figure 8: Scatter plot of cosθHsubscript𝜃𝐻\cos\theta_{H} vs. ηmaxsubscript𝜂max\eta_{\rm max} containing all events in both the e+psuperscript𝑒𝑝e^{+}p and the epsuperscript𝑒𝑝e^{-}p samples (see section 5.3 for the definitions of θHsubscript𝜃𝐻\theta_{H} and ηmaxsubscript𝜂max\eta_{\rm max}). The region cosθH<0.75subscript𝜃𝐻0.75\cos\theta_{H}<0.75 and ηmax<2.5subscript𝜂max2.5\eta_{\rm max}<2.5, which corresponds to large rapidity gap events, contains a single event.

Refer to caption 


Figure 9: A display of the candidate large rapidity gap event. The left part shows the ZEUS inner tracking system and the calorimeter. The proton beam enters from the right; correspondingly, FCAL, BCAL and RCAL are displayed from left to right. The filled rectangles in the calorimeter denote energy deposits which are above the noise thresholds described in the text (cf. section 3.1) and in addition are above 100MeV100MeV100\,{\rm Me}\kern-1.0pt{\rm V} if they are isolated. The ZR𝑍𝑅ZR–view shows a projection of tracks and energy deposits along constant values of Z𝑍Z and R=(X2+Y2)1/2𝑅superscriptsuperscript𝑋2superscript𝑌212R=(X^{2}+Y^{2})^{1/2}, where the two hemispheres are separated by a plane perpendicular to the event sphericity axis (20<ϕ<200superscript20italic-ϕsuperscript20020^{\circ}<\phi<200^{\circ} corresponding to the upper half of the display). In the right part of the figure the η𝜂\etaϕitalic-ϕ\phi–distribution of the calorimeter transverse energy is presented. The FCAL cluster at η=2.2𝜂2.2\eta=2.2 has 0.25GeV0.25GeV0.25\,{\rm Ge}\kern-1.0pt{\rm V} of transverse momentum. The kinematic variables for this event are reconstructed to be t=14±2GeVsubscriptitalic-P̸𝑡plus-or-minus142GeV{\mbox{$\not{P}_{t}$}}\mathchar 61\relax 14\pm 2\,{\rm Ge}\kern-1.0pt{\rm V}, Q2=300±70GeV2superscript𝑄2plus-or-minus30070superscriptGeV2Q^{2}\mathchar 61\relax 300\pm 70\,{\rm Ge}\kern-1.0pt{\rm V}^{2}, x=0.0093±0.0015𝑥plus-or-minus0.00930.0015x\mathchar 61\relax 0.0093\pm 0.0015 and y=0.35±0.10𝑦plus-or-minus0.350.10y\mathchar 61\relax 0.35\pm 0.10.