Measurement of the Proton Structure Function
at low and low at HERA
ZEUS Collaboration
Abstract
We report on a measurement of the proton structure function in the range and 1.5 at the collider HERA operating at a centre-of-mass energy of . The rise of with decreasing observed in the previous HERA measurements persists in this lower and range. The evolution of , even at the lowest and measured, is consistent with perturbative QCD.
DESY 95-193
October 1995
The ZEUS Collaboration
M. Derrick, D. Krakauer, S. Magill, D. Mikunas, B. Musgrave,
J. Repond, R. Stanek, R.L. Talaga, H. Zhang
Argonne National Laboratory, Argonne, IL, USA p
G. Bari, M. Basile,
L. Bellagamba, D. Boscherini, A. Bruni, G. Bruni, P. Bruni, G. Cara
Romeo, G. Castellini1, M. Chiarini,
L. Cifarelli2, F. Cindolo, A. Contin, M. Corradi,
I. Gialas3,
P. Giusti, G. Iacobucci, G. Laurenti, G. Levi, A. Margotti,
T. Massam, R. Nania, C. Nemoz, F. Palmonari,
A. Polini, G. Sartorelli, R. Timellini, Y. Zamora Garcia4,
A. Zichichi
University and INFN Bologna, Bologna, Italy f
A. Bornheim, J. Crittenden, K. Desch, B. Diekmann5, T. Doeker,
M. Eckert, L. Feld, A. Frey, M. Geerts, M. Grothe, H. Hartmann,
K. Heinloth, L. Heinz, E. Hilger, H.-P. Jakob, U.F. Katz,
S. Mengel, J. Mollen6, E. Paul, M. Pfeiffer, Ch. Rembser,
D. Schramm, J. Stamm, R. Wedemeyer
Physikalisches Institut der Universität Bonn,
Bonn, Germany c
S. Campbell-Robson, A. Cassidy, W.N. Cottingham, N. Dyce, B. Foster,
S. George, M.E. Hayes, G.P. Heath, H.F. Heath, C.J.S. Morgado,
J.A. O’Mara, D. Piccioni, D.G. Roff, R.J. Tapper, R. Yoshida
H.H. Wills Physics Laboratory, University of Bristol,
Bristol, U.K. o
R.R. Rau
Brookhaven National Laboratory, Upton, L.I., USA p
M. Arneodo7, R. Ayad, M. Capua, A. Garfagnini, L. Iannotti,
M. Schioppa, G. Susinno
Calabria University, Physics Dept.and INFN, Cosenza, Italy f
A. Bernstein, A. Caldwell8, N. Cartiglia, J.A. Parsons,
S. Ritz9, F. Sciulli, P.B. Straub, L. Wai, S. Yang, Q. Zhu
Columbia University, Nevis Labs., Irvington on Hudson, N.Y., USA
q
P. Borzemski, J. Chwastowski, A. Eskreys, K. Piotrzkowski,
M. Zachara, L. Zawiejski
Inst. of Nuclear Physics, Cracow, Poland j
L. Adamczyk, B. Bednarek, K. Jeleń,
D. Kisielewska, T. Kowalski, M. Przybycień,
E. Rulikowska-Zarȩbska, L. Suszycki, J. Zaja̧c
Faculty of Physics and Nuclear Techniques,
Academy of Mining and Metallurgy, Cracow, Poland j
A. Kotański
Jagellonian Univ., Dept. of Physics, Cracow, Poland k
L.A.T. Bauerdick, U. Behrens, H. Beier, J.K. Bienlein,
C. Coldewey, O. Deppe, K. Desler, G. Drews,
M. Flasiński10, D.J. Gilkinson, C. Glasman,
P. Göttlicher, J. Große-Knetter, B. Gutjahr11,
T. Haas, W. Hain, D. Hasell, H. Heßling, Y. Iga, K.F. Johnson12,
P. Joos, M. Kasemann, R. Klanner, W. Koch, L. Köpke13,
U. Kötz, H. Kowalski, J. Labs, A. Ladage, B. Löhr,
M. Löwe, D. Lüke, J. Mainusch14, O. Mańczak,
T. Monteiro15, J.S.T. Ng, S. Nickel16, D. Notz,
K. Ohrenberg, M. Roco, M. Rohde, J. Roldán, U. Schneekloth,
W. Schulz, F. Selonke, E. Stiliaris17, B. Surrow, T. Voß,
D. Westphal, G. Wolf, C. Youngman, W. Zeuner, J.F. Zhou18
Deutsches Elektronen-Synchrotron DESY, Hamburg,
Germany
H.J. Grabosch, A. Kharchilava19,
A. Leich, S.M. Mari3, M.C.K. Mattingly20,
A. Meyer,
S. Schlenstedt, N. Wulff
DESY-Zeuthen, Inst. für Hochenergiephysik,
Zeuthen, Germany
G. Barbagli, E. Gallo, P. Pelfer
University and INFN, Florence, Italy f
G. Anzivino, G. Maccarrone, S. De Pasquale, L. Votano
INFN, Laboratori Nazionali di Frascati, Frascati, Italy f
A. Bamberger, S. Eisenhardt, A. Freidhof,
S. Söldner-Rembold21,
J. Schroeder22, T. Trefzger
Fakultät für Physik der Universität Freiburg i.Br.,
Freiburg i.Br., Germany c
N.H. Brook, P.J. Bussey, A.T. Doyle,
D.H. Saxon, M.L. Utley, A.S. Wilson
Dept. of Physics and Astronomy, University of Glasgow,
Glasgow, U.K. o
A. Dannemann, U. Holm, D. Horstmann, T. Neumann, R. Sinkus, K. Wick
Hamburg University, I. Institute of Exp. Physics, Hamburg,
Germany c
E. Badura23, B.D. Burow24, L. Hagge14,
E. Lohrmann, J. Milewski, M. Nakahata25, N. Pavel,
G. Poelz, W. Schott, F. Zetsche
Hamburg University, II. Institute of Exp. Physics, Hamburg,
Germany c
T.C. Bacon, N. Bruemmer, I. Butterworth,
V.L. Harris, B.Y.H. Hung, K.R. Long, D.B. Miller, P.P.O. Morawitz,
A. Prinias, J.K. Sedgbeer, A.F. Whitfield
Imperial College London, High Energy Nuclear Physics Group,
London, U.K. o
U. Mallik, E. McCliment, M.Z. Wang, S.M. Wang, J.T. Wu
University of Iowa, Physics and Astronomy Dept.,
Iowa City, USA p
P. Cloth, D. Filges
Forschungszentrum Jülich, Institut für Kernphysik,
Jülich, Germany
S.H. An, S.M. Hong, S.W. Nam, S.K. Park,
M.H. Suh, S.H. Yon
Korea University, Seoul, Korea h
R. Imlay, S. Kartik, H.-J. Kim, R.R. McNeil, W. Metcalf,
V.K. Nadendla
Louisiana State University, Dept. of Physics and Astronomy,
Baton Rouge, LA, USA p
F. Barreiro26, G. Cases, J.P. Fernandez, R. Graciani,
J.M. Hernández, L. Hervás26, L. Labarga26,
M. Martinez, J. del Peso, J. Puga, J. Terron, J.F. de Trocóniz
Univer. Autónoma Madrid, Depto de Física Teóríca,
Madrid, Spain n
G.R. Smith
University of Manitoba, Dept. of Physics,
Winnipeg, Manitoba, Canada a
F. Corriveau, D.S. Hanna, J. Hartmann,
L.W. Hung, J.N. Lim, C.G. Matthews,
P.M. Patel,
L.E. Sinclair, D.G. Stairs, M. St.Laurent, R. Ullmann,
G. Zacek
McGill University, Dept. of Physics,
Montréal, Québec, Canada a, b
V. Bashkirov, B.A. Dolgoshein, A. Stifutkin
Moscow Engineering Physics Institute, Moscow, Russia
l
G.L. Bashindzhagyan27, P.F. Ermolov, L.K. Gladilin,
Yu.A. Golubkov, V.D. Kobrin,
I.A. Korzhavina, V.A. Kuzmin,
O.Yu. Lukina, A.S. Proskuryakov, A.A. Savin, L.M. Shcheglova,
A.N. Solomin, N.P. Zotov
Moscow State University, Institute of Nuclear Physics,
Moscow, Russia m
M. Botje, F. Chlebana, A. Dake, J. Engelen, M. de Kamps, P. Kooijman,
A. Kruse, H. Tiecke, W. Verkerke, M. Vreeswijk, L. Wiggers,
E. de Wolf, R. van Woudenberg28
NIKHEF and University of Amsterdam, Netherlands i
D. Acosta, B. Bylsma, L.S. Durkin, J. Gilmore, K. Honscheid,
C. Li, T.Y. Ling, K.W. McLean29, P. Nylander,
I.H. Park, T.A. Romanowski30, R. Seidlein31
Ohio State University, Physics Department,
Columbus, Ohio, USA p
D.S. Bailey, A. Byrne32, R.J. Cashmore,
A.M. Cooper-Sarkar, R.C.E. Devenish, N. Harnew,
M. Lancaster, L. Lindemann3, J.D. McFall, C. Nath, V.A. Noyes,
A. Quadt, J.R. Tickner,
H. Uijterwaal, R. Walczak, D.S. Waters, F.F. Wilson, T. Yip
Department of Physics, University of Oxford,
Oxford, U.K. o
G. Abbiendi, A. Bertolin, R. Brugnera, R. Carlin, F. Dal Corso,
M. De Giorgi, U. Dosselli,
S. Limentani, M. Morandin, M. Posocco, L. Stanco,
R. Stroili, C. Voci
Dipartimento di Fisica dell’ Universita and INFN,
Padova, Italy f
J. Bulmahn, J.M. Butterworth, R.G. Feild, B.Y. Oh,
J.R. Okrasinski33, J.J. Whitmore
Pennsylvania State University, Dept. of Physics,
University Park, PA, USA q
G. D’Agostini, G. Marini, A. Nigro, E. Tassi
Dipartimento di Fisica, Univ. ’La Sapienza’ and INFN,
Rome, Italy
J.C. Hart, N.A. McCubbin, K. Prytz, T.P. Shah, T.L. Short
Rutherford Appleton Laboratory, Chilton, Didcot, Oxon,
U.K. o
E. Barberis, T. Dubbs, C. Heusch, M. Van Hook,
W. Lockman, J.T. Rahn, H.F.-W. Sadrozinski, A. Seiden, D.C. Williams
University of California, Santa Cruz, CA, USA p
J. Biltzinger, R.J. Seifert, O. Schwarzer,
A.H. Walenta, G. Zech
Fachbereich Physik der Universität-Gesamthochschule
Siegen, Germany c
H. Abramowicz, G. Briskin, S. Dagan34,
C. Händel-Pikielny, A. Levy27
School of Physics,Tel-Aviv University, Tel Aviv, Israel
e
J.I. Fleck, T. Hasegawa, M. Hazumi, T. Ishii, M. Kuze, S. Mine,
Y. Nagasawa, M. Nakao, I. Suzuki, K. Tokushuku,
S. Yamada, Y. Yamazaki
Institute for Nuclear Study, University of Tokyo,
Tokyo, Japan g
M. Chiba, R. Hamatsu, T. Hirose, K. Homma, S. Kitamura,
Y. Nakamitsu, K. Yamauchi
Tokyo Metropolitan University, Dept. of Physics,
Tokyo, Japan g
R. Cirio, M. Costa, M.I. Ferrero, L. Lamberti,
S. Maselli, C. Peroni, R. Sacchi, A. Solano, A. Staiano
Universita di Torino, Dipartimento di Fisica Sperimentale
and INFN, Torino, Italy f
M. Dardo
II Faculty of Sciences, Torino University and INFN -
Alessandria, Italy f
D.C. Bailey, D. Bandyopadhyay, F. Benard,
M. Brkic, D.M. Gingrich35,
G.F. Hartner, K.K. Joo, G.M. Levman, J.F. Martin, R.S. Orr,
S. Polenz, C.R. Sampson, R.J. Teuscher
University of Toronto, Dept. of Physics, Toronto, Ont.,
Canada a
C.D. Catterall, T.W. Jones, P.B. Kaziewicz, J.B. Lane, R.L. Saunders,
J. Shulman
University College London, Physics and Astronomy Dept.,
London, U.K. o
K. Blankenship, B. Lu, L.W. Mo
Virginia Polytechnic Inst. and State University, Physics Dept.,
Blacksburg, VA, USA q
W. Bogusz, K. Charchuła, J. Ciborowski, J. Gajewski,
G. Grzelak36, M. Kasprzak, M. Krzyżanowski,
K. Muchorowski37, R.J. Nowak, J.M. Pawlak,
T. Tymieniecka, A.K. Wróblewski, J.A. Zakrzewski,
A.F. Żarnecki
Warsaw University, Institute of Experimental Physics,
Warsaw, Poland j
M. Adamus
Institute for Nuclear Studies, Warsaw, Poland j
Y. Eisenberg34, U. Karshon34,
D. Revel34, D. Zer-Zion
Weizmann Institute, Particle Physics Dept., Rehovot,
Israel d
I. Ali, W.F. Badgett, B. Behrens38, S. Dasu, C. Fordham,
C. Foudas, A. Goussiou39, R.J. Loveless, D.D. Reeder,
S. Silverstein,
W.H. Smith, A. Vaiciulis, M. Wodarczyk
University of Wisconsin, Dept. of Physics,
Madison, WI, USA p
T. Tsurugai
Meiji Gakuin University, Faculty of General Education, Yokohama,
Japan
S. Bhadra, M.L. Cardy, C.-P. Fagerstroem, W.R. Frisken,
K.M. Furutani, M. Khakzad, W.N. Murray, W.B. Schmidke
York University, Dept. of Physics, North York, Ont.,
Canada a
1 also at IROE Florence, Italy
2 now at Univ. of Salerno and INFN Napoli, Italy
3 supported by EU HCM contract ERB-CHRX-CT93-0376
4 supported by Worldlab, Lausanne, Switzerland
5 now a self-employed consultant
6 now at ELEKLUFT, Bonn
7 now also at University of Torino
8 Alexander von Humboldt Fellow
9 Alfred P. Sloan Foundation Fellow
10 now at Inst. of Computer Science, Jagellonian Univ., Cracow
11 now at Comma-Soft, Bonn
12 visitor from Florida State University
13 now at Univ. of Mainz
14 now at DESY Computer Center
15 supported by European Community Program PRAXIS XXI
16 now at Dr. Seidel Informationssysteme, Frankfurt/M.
17 now at Inst. of Accelerating Systems & Applications (IASA),
Athens
18 now at Mercer Management Consulting, Munich
19 now at Univ. de Strasbourg
20 now at Andrews University, Barrien Springs, U.S.A.
21 now with OPAL Collaboration, Faculty of Physics at Univ. of
Freiburg
22 now at SAS-Institut GmbH, Heidelberg
23 now at GSI Darmstadt
24 also supported by NSERC
25 now at Institute for Cosmic Ray Research, University of Tokyo
26 partially supported by CAM
27 partially supported by DESY
28 now at Philips Natlab, Eindhoven, NL
29 now at Carleton University, Ottawa, Canada
30 now at Department of Energy, Washington
31 now at HEP Div., Argonne National Lab., Argonne, IL, USA
32 now at Oxford Magnet Technology, Eynsham, Oxon
33 in part supported by Argonne National Laboratory
34 supported by a MINERVA Fellowship
35 now at Centre for Subatomic Research, Univ.of Alberta,
Canada and TRIUMF, Vancouver, Canada
36 supported by the Polish State Committee for Scientific
Research, grant No. 2P03B09308
37 supported by the Polish State Committee for Scientific
Research, grant No. 2P03B09208
38 now at University of Colorado, U.S.A.
39 now at High Energy Group of State University of New York,
Stony Brook, N.Y.
| a | supported by the Natural Sciences and Engineering Research Council of Canada (NSERC) |
|---|---|
| b | supported by the FCAR of Québec, Canada |
| c | supported by the German Federal Ministry for Education and Science, Research and Technology (BMBF), under contract numbers 056BN19I, 056FR19P, 056HH19I, 056HH29I, 056SI79I |
| d | supported by the MINERVA Gesellschaft für Forschung GmbH, and by the Israel Academy of Science |
| e | supported by the German Israeli Foundation, and by the Israel Academy of Science |
| f | supported by the Italian National Institute for Nuclear Physics (INFN) |
| g | supported by the Japanese Ministry of Education, Science and Culture (the Monbusho) and its grants for Scientific Research |
| h | supported by the Korean Ministry of Education and Korea Science and Engineering Foundation |
| i | supported by the Netherlands Foundation for Research on Matter (FOM) |
| j | supported by the Polish State Committee for Scientific Research, grants No. 115/E-343/SPUB/P03/109/95, 2P03B 244 08p02, p03, p04 and p05, and the Foundation for Polish-German Collaboration (proj. No. 506/92) |
| k | supported by the Polish State Committee for Scientific Research (grant No. 2 P03B 083 08) |
| l | partially supported by the German Federal Ministry for Education and Science, Research and Technology (BMBF) |
| m | supported by the German Federal Ministry for Education and Science, Research and Technology (BMBF), and the Fund of Fundamental Research of Russian Ministry of Science and Education and by INTAS-Grant No. 93-63 |
| n | supported by the Spanish Ministry of Education and Science through funds provided by CICYT |
| o | supported by the Particle Physics and Astronomy Research Council |
| p | supported by the US Department of Energy |
| q | supported by the US National Science Foundation |
1 Introduction
The measurement of deep inelastic scattering (DIS), , at HERA has shown a rapid rise of the proton structure function with decreasing for [1, 2]. The corresponding increase of the virtual photon-proton cross section with the centre-of-mass energy is much stronger than that of for real photons [3, 4]. The slower increase of the real photoproduction cross section is consistent with the energy behaviour of hadron-hadron total cross sections. In perturbative QCD the rise of at low is ascribed to an increase in the sea quark density [5, 6], and the significance thereof is discussed extensively in the literature [7]. One of the important questions is how far perturbative QCD retains its validity as one probes large parton densities. Until now the HERA measurements of have covered values above 4.5 . It is of great interest to extend the measurement to lower values and study the low behaviour in the transition region between photoproduction and DIS.
In this paper, measurements, from DIS data, at and at values as low as 1.5 are reported. Access to such low values is achieved in two different ways. For the first analysis (SVX) HERA is operated with the interaction point shifted in the proton direction in order to improve the acceptance for small positron scattering angles. The second analysis (ISR) uses DIS events from the nominal interaction point with initial state photon radiation where the radiated photon is detected. These events effectively have a lower initial positron beam energy and thus for a fixed acceptance of the positron scattering angle events with smaller values of can be reconstructed. The reconstruction of events having positrons scattered at small angles is improved compared to the 1993 analysis by the addition of the small angle rear tracking detector (SRTD).
2 Experimental Conditions
2.1 HERA Running Conditions
The data were taken with the ZEUS detector at HERA in 1994. HERA operated with 153 colliding bunches of 820 GeV protons and 27.5 GeV positrons. Additional unpaired positron and proton bunches circulated, which are used to determine beam related background. The root mean square of the proton bunch length was approximately 20 cm while the positron bunch length was negligible in comparison, leading to an interaction length having a root mean square of 10 cm. For the SVX analysis, the mean interaction vertex was moved from = 0 to = 67 cm 111The ZEUS coordinate system is defined as right handed with the axis pointing in the proton beam direction, and the axis horizontal, pointing towards the centre of HERA. The origin is at the nominal interaction point.. Approximately 5% of the proton current was contained in satellite bunches, which were shifted by 4.8 ns with respect to the primary bunch crossing time, resulting in a fraction of the interactions occurring on average +72 cm upstream of the primary position.
The SVX analysis is based on an integrated luminosity of 58 collected while HERA operated with the shifted interaction point. The ISR analysis uses 2.5 of data taken with HERA operating with the interaction point at the nominal position, .
2.2 The ZEUS Detector
A description of the ZEUS detector can be found in [3, 8]. The primary components used in these analyses are the uranium-scintillator calorimeter (CAL) [9] and the tracking detectors. The calorimeter covers 99.7% of the total solid angle and is subdivided into electromagnetic (EMC) and hadronic (HAC) sections with typical cell sizes of cm2 ( cm2 in the rear calorimeter (RCAL), i.e. in the positron beam direction) and cm2 respectively. The calorimeter has an energy resolution of = 18%/ for electrons and = 35%/ for hadrons, as measured in test beams. The timing resolution of a calorimeter cell is better than = 1.5/ 0.5 ns ( denotes addition in quadrature).
The tracking system consists of a vertex detector (VXD) [10] and a central tracking chamber (CTD) [11] enclosed in a 1.43 T solenoidal magnetic field. The interaction vertex is measured with a resolution along (transverse to) the beam direction of 0.4 (0.1) cm.
The position of positrons scattered close to the positron beam direction is determined by the SRTD which is attached to the front face of the RCAL. The SRTD consists of two planes of scintillator strips, 1 cm wide and 0.5 cm thick, arranged in orthogonal directions and read out via optical fibres and photomultiplier tubes. It covers the region of 68 68 in and and is positioned at cm. A hole of 20 20 at the centre of the RCAL and SRTD accommodates the beampipe. The SRTD is able to clearly resolve single minimum ionising particles (mip) and has a position resolution of 0.3 cm. The time resolution is better than 2 ns for a minimum ionising particle.
The luminosity is measured via the positron-proton bremsstrahlung process, , using a lead-scintillator calorimeter (LUMI) [12] which accepts photons at angles 0.5 mrad with respect to the beam axis. The LUMI photon calorimeter is also used to measure the energy and position of photons from initial state radiation in DIS events. It is positioned at m and, under test beam conditions, has an energy resolution of = 18%/. In its operating position it is shielded from synchrotron radiation by a carbon-lead filter and has an energy resolution of = 26.5%/, as determined from bremsstrahlung data. The position resolution is 0.2 cm. In addition, an electromagnetic calorimeter positioned at m is used for tagging scattered positrons at small angles.
2.3 Triggering
Events were filtered online by a three level trigger system [8]. At the first level, DIS events were selected by requiring a logical AND between two conditions based on energy deposits in the calorimeter. The first condition was the presence of an isolated electromagnetic energy deposit. The EMC energy deposit was required to be greater than 2.5 GeV. The corresponding HAC energy deposit was required to be either less than 0.95 GeV or no more than a third of the EMC energy deposit. The threshold values have been chosen to give 99% efficiency for positrons with energy greater than 5 GeV as determined by Monte Carlo studies. Further details of the algorithm can be found in [13]. The second condition required that the EMC section have an energy deposit greater than 3.75 GeV. Background from protons interacting outside the detector was rejected using the time measurement of the energy deposits from downstream veto counters and the SRTD.
At the second level trigger (SLT), background was further reduced using the measured times of energy deposits and the summed energies from the calorimeter. The events were accepted if
| (1) |
where and are the energies and polar angles (with respect to the primary vertex position) of calorimeter cells, and is the energy deposit measured in the LUMI photon calorimeter. For perfect detector resolution and acceptance, is twice the positron beam energy (55 GeV) for DIS events while for photoproduction events, where the scattered positron escapes down the beampipe, peaks at much lower values.
The full event information was available at the third level trigger (TLT). Tighter timing cuts as well as algorithms to remove beam-halo muons and cosmic muons were applied. The quantity was determined in the same manner as for . The events were required to have
| (2) |
Finally, DIS events were accepted if a scattered positron candidate of energy greater than 4 GeV was found.
3 Monte Carlo Simulation
Monte Carlo (MC) event simulation is used to correct for detector acceptance and smearing effects. The detector simulation is based on the GEANT programme [14] and incorporates our understanding of the detector, the trigger and test beam results. Neutral current DIS events are simulated to using the HERACLES programme [15] which includes first order electroweak radiative corrections. The hadronic final state is simulated using the colour-dipole model including boson gluon fusion CDMBGF [16] as implemented in ARIADNE [17] for the QCD cascade and JETSET [18] for the hadronisation. The ARIADNE model currently provides the best description of the observed DIS nondiffractive hadronic final state [19]. Diffractive events with a large rapidity gap as observed in the data [20] are simulated within ARIADNE by assuming that the struck quark belongs to a colourless state having only a small fraction of the proton’s momentum. The parameters of the model are adjusted to be consistent with recent ZEUS measurements [21]. The MRSA [22] parton density parameterisations, modified at low as described in [23], are used. These parameterisations provide an adequate description of previous ZEUS and H1 measurements [1, 2].
The shape of the vertex distribution used in the simulation is taken from nondiffractive photoproduction events. For such events the vertex reconstruction efficiency is found to be high and only weakly dependent on the position of the interaction.
For the shifted vertex analysis, a sample of events corresponding to an integrated luminosity of was generated with .
The main source of background in the data sample for the SVX analysis is due to photoproduction leading to the detection of a fake scattered positron. Minimum bias photoproduction events are simulated using PYTHIA [24] with cross sections according to the ALLM parameterisation [25]. Photoproduction events corresponding to an integrated luminosity of 110 were generated with a photon-proton centre-of-mass energy . Events with smaller values do not contribute to the photoproduction background.
For the ISR analysis, a DIS sample corresponding to an integrated luminosity of 2.7 , with an initial state photon energy above 3 GeV, was generated with .
4 Kinematic Reconstruction
In deep inelastic scattering, , the proton structure functions are expressed in terms of the negative of the four-momentum transfer squared, , and Bjorken . In the absence of QED radiation,
| (3) |
| (4) |
where and are the four-momenta of the incoming particles and is the four-momentum of the scattered lepton. The square of the centre-of-mass energy is denoted by . The fractional energy transferred to the proton in its rest frame is .
In the SVX analysis, and are reconstructed from the measured energy, , and scattering angle, of the positron,
| (5) |
| (6) |
where and are the positron and proton beam energies and the scattered positron angle is measured with respect to the positive direction.
The ISR sample is selected by requiring that a photon with energy be detected in the LUMI photon calorimeter. The variables and are determined using equations 5 and 6 replacing with , treating the virtual positron as a real positron, which is a good approximation for the ISR analysis.
4.1 Vertex Determination
The vertex coordinates are determined from tracks reconstructed with the CTD and VXD. The coordinate is determined on an event-by-event basis. Since the transverse sizes of the beams are smaller than the resolutions for the and coordinates of the vertex, the beam positions averaged over the entire data sets are used. For events which do not have a tracking vertex, the coordinate is set to the primary position of the interaction point. For events with a tracking vertex, the resolution of is cm over the entire range considered in these analyses. At low the current jet is produced at small forward angles, resulting in a reduced probability for vertex reconstruction. The vertex distributions for the two analyses, including events arising from the interaction of the satellite bunch, are found to be well reproduced by the MC simulation.
4.2 Positron Identification and Efficiency
The positron identification algorithm is based on a neural network using information from the CAL and is described elsewhere [26]. The efficiency of finding the scattered positron is sensitive to details of the shower evolution, in particular to energy loss in material between the interaction point and the calorimeter. The efficiency was measured using elastic QED Compton events where the positron and photon are detected in the CAL by exploiting the presence of two electromagnetic objects and the overconstrained kinematics. DIS data were also used to study the positron finding efficiency by comparing different positron finding algorithms. A correction based on the QED Compton study is used in the analyses. The size of the correction to the efficiency obtained from the standard ZEUS detector simulation programme is 16% at 8 GeV decreasing to 0% at 18 GeV. The efficiency of the identification algorithm when the scattered positron has an energy of 10 GeV is 55%, rising to 100% above energies of 18 GeV. The uncertainty in the efficiency is accounted for in the systematic errors (see Sect. 5.5).
4.3 Positron Position Measurement
The impact point of the scattered positron at the calorimeter is measured using the SRTD for the SVX data and part of the ISR data. The position resolution of the SRTD is determined using positrons hitting the calorimeter at the boundary of cells where the position can be determined by the calorimeter with a resolution of less than 0.1 cm. The measured SRTD position resolution of 0.3 cm is well reproduced by the MC simulation.
For events with a reconstructed vertex the scattering angle of the positron, determined from the event vertex and the impact position at the face of the SRTD, has a resolution of 1.7 mrad, while for events without a tracking vertex the measured scattering angle has a resolution of 4 mrad. For the ISR analysis, 7% of the events are found outside the SRTD. For these events, the impact point is determined by the RCAL resulting in an angular resolution of 7 mrad.
4.4 Positron Energy Measurement
In the analyses, and are determined using the corrected positron energy as described below. For background rejection and rejection of events with hard initial state radiation, we define, in addition, the quantity :
| (7) |
where is the energy deposited in the calorimeter cell and the angle, , is determined from the event vertex and the cell centre. The sum excludes the calorimeter cells belonging to the scattered positron. is calculated using the corrected positron energy.
In the range of the present analyses the scattered positron traverses typically two radiation lengths of passive material before reaching the calorimeter, thereby losing a significant amount of energy. The correlation between the energy lost in the inactive material in front of the calorimeter and the energy deposited in the SRTD is used to correct the calorimeter energy measurement.
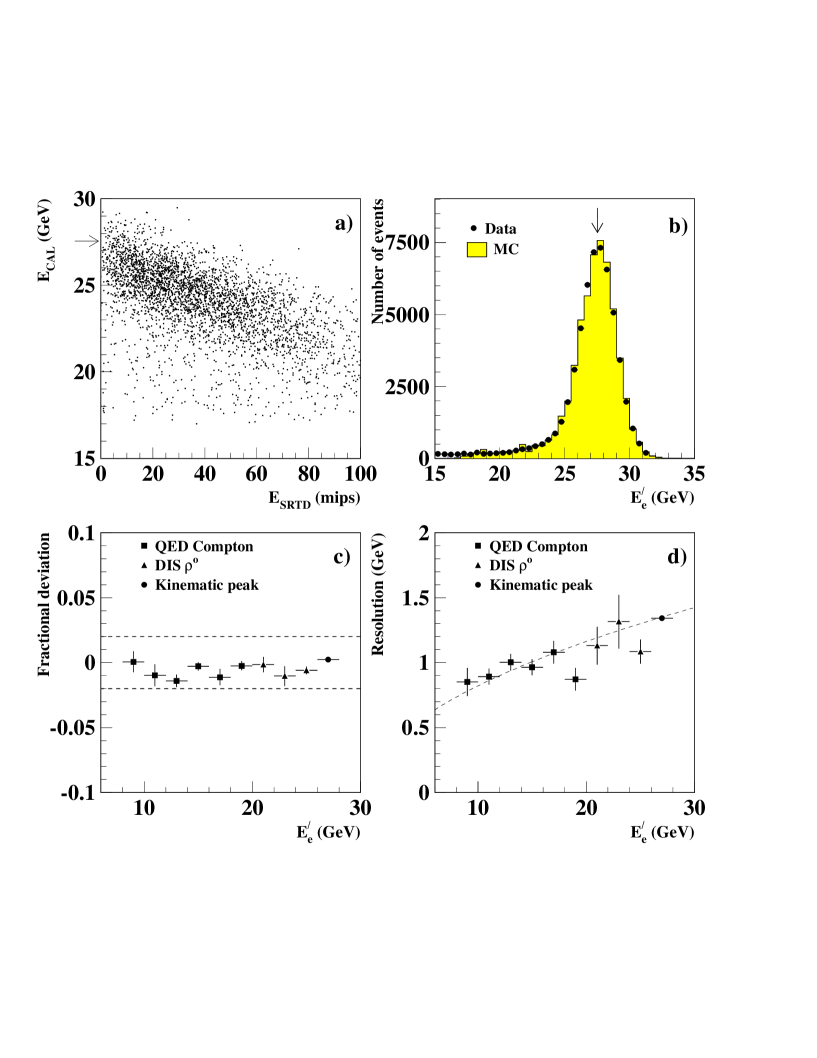
This correction can be determined from a data sample where the scattered positron energy is known from kinematic constraints. This is the case for DIS events with , for which the scattered positron energy is equal to the incident positron beam energy. Events close to this condition, called kinematic peak (KP) events, can be selected by the requirement . The correction for lower energies can be obtained using QED Compton events. The energies of the positron and the photon can be predicted precisely from the measurement of their scattering angles assuming the transverse momentum of the scattered proton to be small. Events from elastic DIS production, ; provide a way to check the SRTD energy correction. Here, the angle of the positron is determined from the event vertex and the position measurement at the face of the SRTD while the momenta of the and are measured with the CTD.
The SRTD energy correction is determined using the KP and QED Compton events. A clear correlation between the energy measured in the calorimeter and the energy deposited in the SRTD for KP events is observed (see Fig. 1a). Figure 1b compares the corrected positron energies of the data with the MC simulation for KP events, where it can be seen that the peak and width of the data are well reproduced by the MC simulation. The deviation of the mean corrected energy from the prediction of the KP and QED Compton events is less than 2% as shown in Fig. 1c for positron energies between 9 and 27.5 GeV. The point at the highest energy ( = 27.5 GeV) is obtained from the KP events while the lower energy points are determined from the elastic QED Compton events. For the DIS data, the deviation of the mean corrected positron energy from the value expected from the measurement is less than 1% (see Fig. 1c); these data have not been used to determine the SRTD energy correction. The resolution of the corrected positron energy is shown in Fig. 1d and can be described by = 26%/.
5 Analysis of the Shifted Vertex Data
In the SVX analysis, is measured using data from an integrated luminosity of 58 collected with the vertex shifted by +67 cm in . The vertex shift extends the acceptance of positrons to smaller scattering angles and hence events with lower can be reconstructed.
5.1 Event Selection
The following cuts are used to select the DIS events for the SVX analysis.
-
•
The scattered positron energy as obtained from the calorimeter and corrected by the energy measured in the SRTD is required to be greater than 10 GeV. This ensures a high efficiency of finding the scattered positron and removes high events which suffer from large photoproduction background.
-
•
The impact position of the scattered positron is required to be at least 3 cm from the inner edge of the rear calorimeter. This cut ensures that the electromagnetic shower of the positron is well contained in the calorimeter. The impact position of the scattered positron is required to be within the acceptance of the SRTD and at least 1 cm away from the edges of the SRTD.
-
•
The value of for the event is required to be within GeV in order to reduce photoproduction and beam-gas related background. This requirement also removes events with hard initial state radiation, thus reducing the radiative corrections. The hadronic energy measurement affects the event selection via this cut when . The simulation of in the MC is sensitive to the hadronisation scheme and the details of the hadronic energy loss in the inactive material. The mean was compared to as a function of and the MC simulation was found to reproduce the data adequately.
-
•
For events with a tracking vertex, the coordinate of the vertex is required to be within , the acceptance being extended to larger values to accommodate the events from the satellite bunch. If no vertex was reconstructed, the coordinate is set to the primary interaction point.
A total of 13210 events pass the selection cuts.
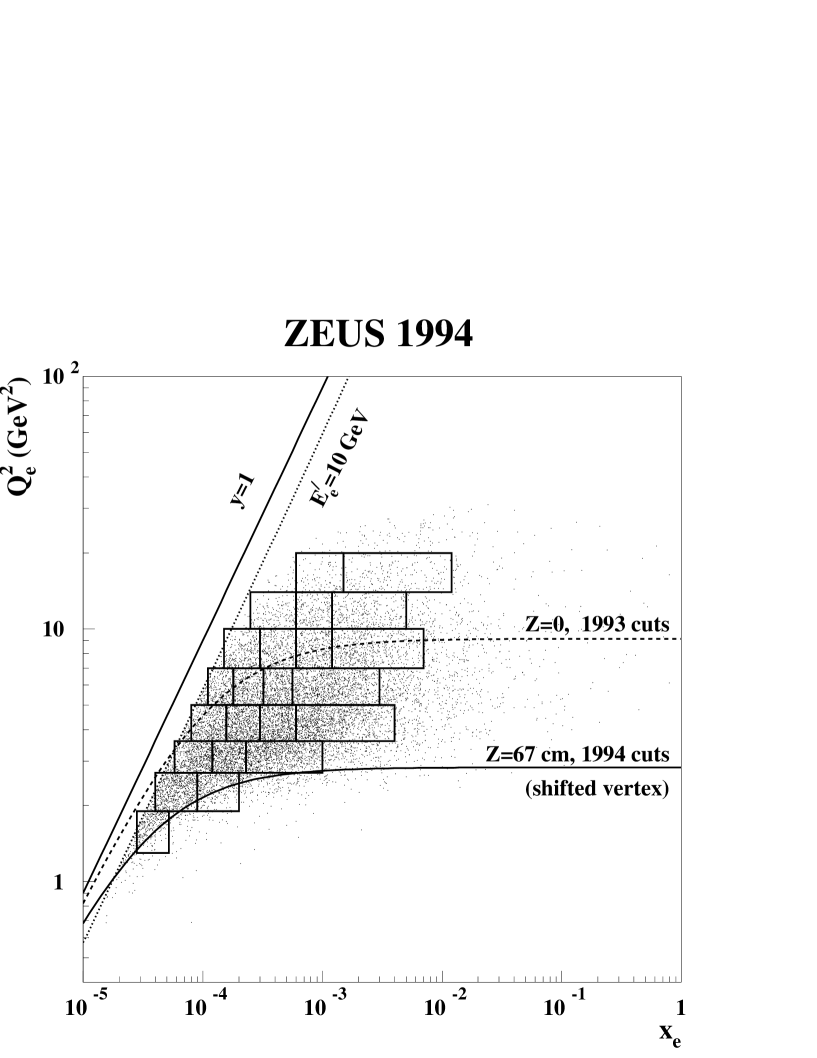
The distributions of the reconstructed and for the selected events are shown in Fig. 2. The dashed line (Z=0, 1993 cuts) gives the limit of the acceptance for the scattered positron corresponding to the 1993 measurement using the ZEUS detector. The acceptance limit in this analysis is shown as the solid line (Z=67 cm, 1994 cuts). The region between the dashed and solid lines shows the increased acceptance obtained for the SVX data and by using the SRTD.
5.2 Resolution of the Kinematic Variables and Bin Selection
The selected events are binned as shown in Fig. 2. The sizes of the bins are determined by the resolution in and . Within the selected bins, the resolution in is found to be 9-12% and the systematic shifts are less than 5% as determined from MC simulation. At the lowest values of , the resolution in is 20% increasing to 85% for larger values where larger bins are chosen to ensure a high purity (defined as the number of events measured in the bin which originated from the bin divided by the number of events measured in the bin). The average reconstructed values of are typically shifted by 6%, with shifts of up to 28% occurring at the lowest values. The bias in the bins results from the steepness of the distribution and the radiative events.
The purity of the events in the bins is typically about 45% and is greater than 30% for all bins. The acceptance (defined as the number of measured events originating from the bin divided by the number of events generated in the bin) is typically 70% except for the lowest bin where it is about 22%, and for the bin with 1.9 and 0.9 where it is 27%. In these bins the purity is 50% and 36% respectively.
5.3 Background Estimation
The background from beam-gas related interactions is estimated from events due to the unpaired bunches of positrons and protons. Events triggered from empty bunch crossings are used to estimate the background from cosmic ray showers. The surviving background events are subtracted statistically. The bin with the highest background has 2% background. In the other bins no events survive and the background is estimated to be less than 1%.
The largest contributor to background is photoproduction, where an energy deposit in the calorimeter is misidentified as a scattered positron. This background is estimated in two ways. The first method uses the photoproduction MC simulation. The same selection procedure as for DIS events is applied and the accepted photoproduction events are statistically subtracted for each bin. The second method uses the distribution to estimate the background. The two estimates are found to agree within statistical errors. The photoproduction background is found to be significant only in bins corresponding to the highest values where it amounts to 2%.
5.4 Determination of
In the range of the present analysis, the effect from exchange is negligible and the double differential cross section for single virtual photon exchange in DIS is given by
| (8) |
where is related to the longitudinal structure function, , by . The correction to the Born cross section from radiative effects is given by . In the analysis, hard radiation collinear with the final state positron is not resolved. Furthermore, the event selection criteria (see above) remove events with hard radiation collinear with the beam positron. Thus, in the kinematic range covered in this analysis, the effective radiative correction is typically 10% or less and is, to a sufficient approximation, independent of the structure function .
An iterative procedure is used to extract the structure function . In the first step a bin-by-bin correction obtained from the MC simulation using the parton distributions given by MRSA[22] is applied to the data. The result for from this first iteration is used for a QCD fit using DGLAP equations [27] in next-to-leading order (QCD NLO fit) very similar to that described in [5]. The evolution uses massless quarks of three flavours in the proton, and the charm quark coefficient functions from [28] to ensure a smooth crossing of the charm threshold; the charm contribution to is calculated in leading order only. The NMC [29] data for are used to constrain the fit at high . The value of was taken using the QCD prescription [30] and the parton distributions from the QCD NLO fit. The effect of the correction on the values is significant only in the highest bins where it is as much as 7%.
The resulting QCD NLO fit parameters are used to reweight the MC events, and the procedure is repeated, leading to a new estimate of . The procedure is repeated until the values from two consecutive iterations change by less than 0.5%. The final result is reached in three iterations. It should be noted that the QCD NLO fit is used here only as a parameterisation to obtain a stable acceptance correction and not to perform a QCD analysis.
The statistical errors of the values are calculated from the number of events measured in the bins and the statistical error on the acceptance calculation from the MC simulation. Since we are using bin-by-bin corrections, the correlations of statistical errors between the measurements enter only via the finite statistics of the MC sample. The correlations are small given the relatively large MC sample used in this analysis. A correlation between the values of neighbouring bins is present due to the acceptance and smearing corrections. The sensitivity of the measured to this effect has been checked by using the obtained from the MRSA [22] parton density parameterisations, modified at low as described in [23], for the acceptance correction calculations. The change in the measured values is found to be small compared to the statistical errors.
The measured distributions of and are shown in Figs. 3a and 3b respectively. The data are shown as the solid circles and the MC simulation results, normalised to the luminosity of the data and reweighted by the QCD NLO fit, are shown as histograms. The measured distributions of the positron energy and angle are shown in Figs. 3c and 3d. All events which pass the selection criteria described in Sect. 5.1 with a reconstructed are shown, including those events which fall outside the bins used for the analysis. These distributions have not been corrected for background. There is adequate agreement between data and simulation for both the shape and normalisation of the distributions. The number of events, and values of and at and values specified, which are chosen to be convenient for comparisons with other measurements, are given in Table 1. The functional form of the QCD NLO fit was used to calculate at these and values. Using alternate parameterisations for this correction has a negligible effect on the quoted values of .
5.5 Systematic Uncertainties
The systematic uncertainty of the values is determined by changing the selection cut or analysis procedure and taking the difference between the measured value of and the new value. Positive and negative differences are separately added in quadrature to obtain the total systematic error. For each change, the photoproduction background estimated from the MC simulation is first subtracted.
The systematic uncertainties are grouped in the following categories:
Positron energy and finding efficiency
-
•
The parameters of the neural network positron finder are varied resulting in changes of by typically less than 4%. In addition, an alternate positron finder, which has been used in previous analyses [1], is used as a check of the neural network finder. Consistent results are obtained in the region where the efficiencies of both finders are reasonably high.
-
•
In the MC simulation the reconstructed positron energy is increased and decreased by a linear function (2% at 5 GeV and 1% at 27.5 GeV). The magnitude of the shift represents our present understanding of the energy scale. These shifts have a 5% effect on for the low bins and 10% for the highest bins.
-
•
The positron identification efficiency is varied within the errors of its determination based on the QED Compton study. The effect on is negligible except in the lowest bins where it is as much as 3%. This also checks the effects of a possible energy dependence of the trigger efficiency.
Positron scattering angle
-
•
Changing the fiducial cut of the positron position at the inner edge of the calorimeter from 3 cm to 4 cm has a 3% effect on for the lowest and bins.
-
•
The reconstructed vertex position in the MC simulation is shifted by 0.4 cm in . The effect on is less than 1.5% for all the bins.
-
•
The positron position reconstructed by the SRTD is shifted by 0.2 cm in and 0.15 cm in . The size of the shifts are estimated from the uncertainty of the position of the SRTD relative to the beam position in and . These shifts have a 7% effect on for the lowest bins and less than 4% for the other bins.
Additional systematic uncertainties
-
•
The photoproduction background estimate is changed by +100% and % resulting in a 2% effect on for the lowest bins and a negligible effect for the higher bins.
-
•
In the calculation of the acceptance, the fraction of the total cross section arising from diffractive scattering is increased by 60%. The effect on is less than 5%.
-
•
The efficiency for reconstructing a vertex is determined by MC simulation and is found to decrease from 85% at to 40% at . For events at low the tracks in the CTD are at low angles as the current jet is produced in the forward direction, resulting in a reduced probability of reconstructing the event vertex. In the data, 70% of the events have a tracking vertex compared to 73% in the MC simulation. The vertex of the events without a tracking vertex is set to the nominal shifted vertex position. The reconstructed values are larger than the true values if the events without a tracking vertex originated from the satellite bunch. The effect on of the satellite bunch was studied by MC simulation and it was found to be largest at high values where it is 8% decreasing to about 1% for the low points.
As an additional check, the coordinate of the vertex is fixed at the primary interaction point for all events in the data and in the MC simulation in order to check the sensitivity to the vertex distribution. The change in is largest for the high values at large where it is about 15% of . For the lowest and bins the effect on is about 10%, while for the other bins it is less than 5%. The change in from this systematic check is not included when determining the systematic error.
-
•
The cut is lowered from 35 GeV to 32 GeV and raised to 38 GeV. The largest effect on of about 3% occurs at the low and low bins, and it decreases with increasing and . Changing the cut checks the photoproduction background estimate, the simulation of the QED radiative effects and the simulation of the hadronic energy measurement.
The total systematic error on of this analysis is 4 to 14% to be compared with the statistical error of 4 to 9%, which includes the statistical error from the MC simulation (see Table 1). In addition to the above errors, there is an overall normalisation uncertainty of 3% due to the uncertainty in the first level trigger efficiency and to the uncertainty on the determination of the luminosity. The given errors of the data do not include this normalisation uncertainty.
6 Analysis of the Radiative Events
The ISR analysis is based on data, corresponding to an integrated luminosity of 2.5 , taken in 1994 with the interaction point at = 0. is measured using events with QED initial state radiation. The emission of a hard photon from the initial state positron results in a scattering at a reduced centre-of-mass energy, and thus for a given scattering angle events with lower are accepted.
6.1 Event Selection and Bin Selection
The sample of DIS events with initial state radiation is selected in a manner identical to the SVX analysis, with the following exceptions:
-
•
An energy deposit in the LUMI photon calorimeter is demanded to ensure collinear radiation. The energy is required to be between 6 and 18 GeV in order to reduce background and ensure sufficient resolution of the reconstructed kinematic variables. Events having an energy greater than 3 GeV measured in the electron calorimeter of the luminosity detector are rejected in order to reduce the accidental overlap of DIS and photoproduction with those from the bremsstrahlung process .
-
•
The corrected energy of the scattered positron detected in the RCAL is required to be greater than 8 GeV. For positrons within the fiducial volume of the SRTD, the energy is corrected as in the SVX analysis. In areas not covered by the SRTD a position dependent description of the inactive material in front of the CAL is determined using the KP events and is used to correct the measured energy in the CAL. A description of the method can be found in [1]. A correction for the positron identification efficiency in the MC simulation is also made as in the SVX analysis.
-
•
The fiducial cut for the positron position is the same as that described in the SVX analysis for the inner edge of the SRTD. If the positron position is outside the fiducial volume of the SRTD, the position is reconstructed using the calorimeter.
-
•
The cut is replaced by a cut on .
A sample of 10726 events is selected. The resolutions of and are similar to those given in Sect. 5.2 and depend only weakly on the photon energy . The bins in and are chosen in a similar way to those used in the SVX analysis.
6.2 Background Estimation
The main source of background is the accidental overlap of DIS or photoproduction events with bremsstrahlung events, . This background is estimated with events selected with the above criteria, removing the requirement of a tagged photon and the cut. To these events a photon is added with an energy determined from a random sampling of the measured spectrum of photon energies for bremsstrahlung events. The resulting spectrum is normalised to the distribution of the data above 70 GeV where no DIS events are possible, taking energy and momentum conservation and the resolution of the detector into consideration, to obtain an estimate of the background. It is subtracted from the data for each bin and is below 10% of the number of events observed in the bin except in the lowest bins where it is up to 24% in one bin.
The beam related background is determined and subtracted statistically in the same manner as described in Sect. 4. It is below 5% for the three lowest bins except for the bin at the lowest where it is 7%. It is negligible in higher bins. The background from photoproduction with initial state radiation and cosmic rays is negligible. Event losses due to bremsstrahlung overlap with a DIS event having initial state radiation are also negligible.
6.3 Determination of
is determined as described in Sect. 5.4. The MC sample is first reweighted using the QCD NLO fit to the from the SVX analysis. is then determined using the reweighted MC for the acceptance correction. A second QCD NLO fit to the measured ISR values (excluding the SVX values) is performed and the final is determined. The measured distributions of and are shown in Figs. 4a and 4b respectively. The data are seen to be in adequate agreement with the MC simulation after the background is added.
The photon energy spectrum of the selected events without the cut on is shown in Fig. 4c and is well described by the expectation from the DIS MC simulation and background estimates. Figure 4d shows the difference between the energy of the radiated photon measured in the LUMI photon calorimeter and , the photon energy determined, using energy and momentum conservation, from the measurements of the energies and the angles of the scattered positron and hadrons in the CAL. The agreement between the MC simulation and the data is reasonable. The distribution is centred at zero indicating agreement in the energy scales of the LUMI photon calorimeter and the CAL.
6.4 Systematic Uncertainties
The checks used to estimate the systematic uncertainty are similar to those presented in Sect. 5.5 except for the checks related to the displacement of the vertex. To estimate the uncertainties due to the photon tagging the following additional checks are made:
-
•
The lower cut on the photon energy is raised from 6 to 7 GeV. The effect on is below 2.5% for the bins at low and around 6% for the bins at high and is compatible with statistical fluctuations.
-
•
The resolution of the photon energy measurement in the MC simulation is degraded from to . The effect on is around 1.5%.
-
•
The energy calibration of the LUMI photon calorimeter in the MC simulation is changed linearly, within the estimated uncertainties, by at the positron beam energy to at 5 GeV. The effect on is around 7%.
-
•
The acceptance of the LUMI photon calorimeter for ISR events obtained from the MC simulation is about 30%. An independent determination of the acceptance using bremsstrahlung data leads to an effect of about 4% on .
The beam divergence is determined with the LUMI photon calorimeter using the bremsstrahlung events. If the beam divergence is increased by 15% in the acceptance calculation, the effect on is, on average, 1.7%.
-
•
The event selection is repeated without the requirement that the LUMI electron energy be less than 3 GeV. The effect is below 3% for the bins at low and is up to 10% in two bins at high .
The total systematic uncertainty of this analysis is 14 to 27% to be compared to the statistical error of 7 to 14%. The effect of additional QED radiative corrections not included in the HERACLES MC programme is small relative to the measurement errors in the kinematic region considered here [31].
7 Results and Discussion
The measured values from the SVX data (ZEUS SVX 1994) are listed in Table 1, and those from the ISR analysis (ZEUS ISR 1994) are listed in Table 2. The data are presented in Fig. 5 together with previous ZEUS measurements (ZEUS 1993). The three data sets are in good agreement. The present analyses significantly increase the measured kinematic region. Using our data alone, the rise of as decreases is observed down to = 3 . Including the fixed target data (the parameterisations shown as curves in Fig. 5 provide a good description of the fixed target data at higher ) the rise is seen to persist down to = 1.5 .
In Fig. 5 the measured values are compared to the prediction of GRV(94) [32] which is based on perturbative QCD using the DGLAP evolution equations. The GRV(94) parton distributions have a very low starting scale, , for the DGLAP evolution equation of , where the gluon and sea distributions are assumed to have valence-like spectra. The steep rise in at low is generated dynamically by the evolution in . The GRV(94) predictions for are in agreement with the data showing that perturbative QCD can describe the data down to values of 1.5 at the low values of this measurement. The predictions of Donnachie and Landshoff [33] based on Regge phenomenology are also shown and are seen to be ruled out for and disfavoured for .
The DIS cross section can be expressed as the product of the flux of virtual photons and the total cross section for the scattering of virtual photons on protons [34]. is defined in terms of the cross section for the absorption of transverse and longitudinal photons, and respectively, by
| (9) |
The expression for in terms of and is
| (10) |
where is the mass of the proton. The separation into the photon flux and cross section can be interpreted in a way similar to the interaction of real particles provided that the lifetime of the virtual photon is large compared to the interaction time, or where is the proton radius [35]. At small the expression can be written in terms of the total virtual photon-proton centre-of-mass energy (where ) to give
| (11) |
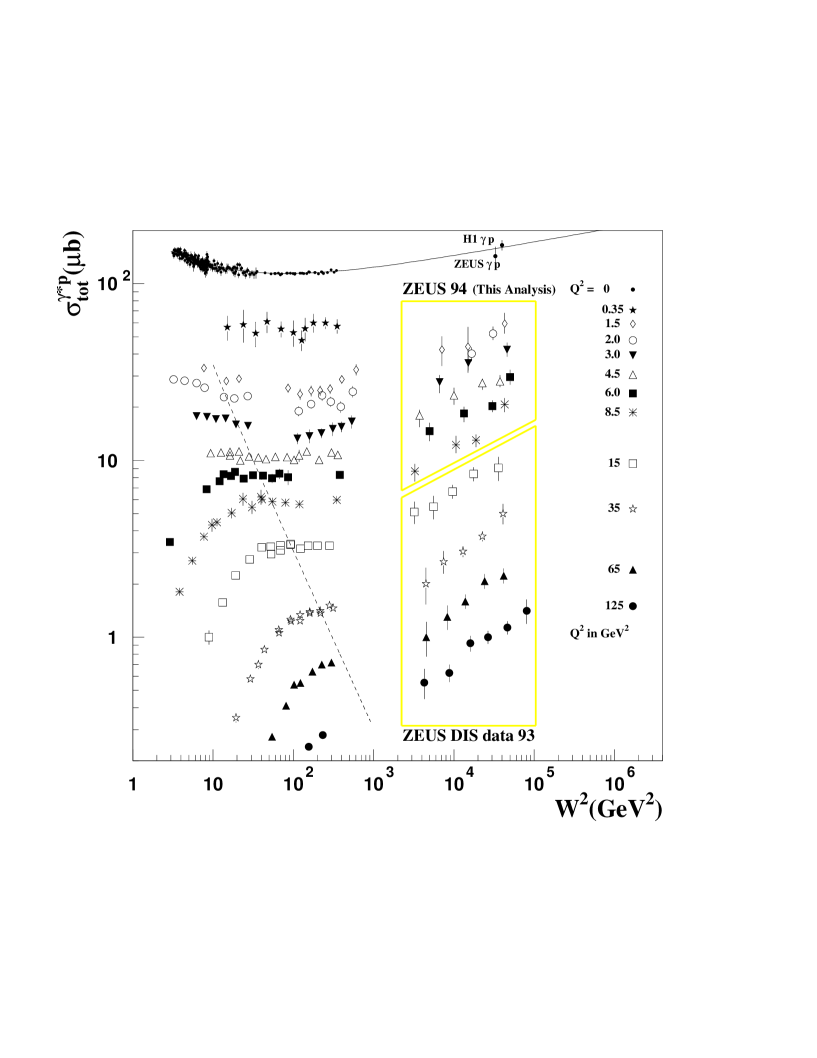
The measured data are converted to the total virtual photon-proton cross section and shown in Fig. 6 along with low energy data and real photoproduction cross section measurements. The DIS data are seen to rise steeply as a function of between the fixed target and the HERA energy range, even at values as low as in contrast to the cross section for real photons which exhibits only a slow rise from the fixed target data to the HERA data [3, 4].
In summary, the proton structure function has been measured in DIS in a new kinematic range down to and . The GRV(94) predictions, which are based on perturbative QCD, are found to be consistent with the data. The Regge predictions of Donnachie and Landshoff based on the soft pomeron are ruled out for 2 and disfavoured for . For the centre-of-mass energies between the fixed target regime and the HERA energy range, the total virtual photon-proton cross section is found to rise steeply with the centre-of-mass energy for as low as 2.0 .
8 Acknowledgements
The strong support and encouragement of the DESY Directorate has been invaluable. The experiment was made possible by the inventiveness and the diligent efforts of the HERA machine group. The design, construction and installation of the ZEUS detector have been made possible by the ingenuity and dedicated efforts of many people from inside DESY and from the home institutes who are not listed as authors. Their contributions are acknowledged with great appreciation.
References
-
[1]
ZEUS Collab., M. Derrick et al.,
Phys. Lett. B316 (1993) 412;
ZEUS Collab., M. Derrick et al., Z. Phys. C65 (1995) 379. -
[2]
H1 Collab., I. Abt et al., Nucl. Phys. B407 (1993) 515;
H1 Collab., T. Ahmed et al., Nucl. Phys. B439 (1995) 471. -
[3]
ZEUS Collab., M. Derrick et al.,
Phys. Lett. B293 (1992) 465;
ZEUS Collab., M. Derrick et al., Z. Phys. C63 (1994) 391. -
[4]
H1 Collab., T. Ahmed et al.,
Phys. Lett. B299 (1992) 374;
H1 Collab., S. Aid et al., DESY 95-162 (1995). - [5] ZEUS Collab., M. Derrick et al., Phys. Lett. B345 (1995) 576.
- [6] H1 Collab., S. Aid et al., Phys. Lett. B354 (1995) 494.
-
[7]
For recent reviews, see for example:
S. Catani, Proceedings of “Les Rencontres de Physique de la Vallée d’Aosta”, ed. M. Greco, La Thuile, Italy, 6-14 Mar. 1994, Editions Frontieres (1994);
E.M. Levin, A.D. Martin, Proceedings of the “International Workshop on DIS and Related Subjects”, ed. A. Levy, Eilat, Israel, 6-11 Sept. 1994, World Scientific (1994). - [8] ZEUS Collab., The ZEUS Detector, Status Report 1993, DESY 1993.
-
[9]
M. Derrick et al., Nucl. Inst. Meth. A309 (1991) 77;
A. Andresen et al., Nucl. Inst. Meth. A309 (1991) 101;
A. Bernstein et al., Nucl. Inst. Meth. A336 (1993) 23. - [10] C. Alvisi et al., Nucl. Inst. Meth. A305 (1991) 30.
-
[11]
N. Harnew et al., Nucl. Inst. Meth., A279 (1989) 290;
B. Foster et al., Nucl. Phys. B (Proc. Suppl.) 32 (1993) 181;
B. Foster et al., Nucl. Inst. Meth., A338 (1994) 254. - [12] J. Andruszków et al., DESY 92-066 (1992).
- [13] W.H. Smith et al., Nucl. Inst. Meth. A 355 (1995) 278.
- [14] GEANT 3.13: R. Brun et al., CERN DD/EE/84-1 (1987).
- [15] K. Kwiatkowski, H. Spiesberger and H.-J. Möhring, Proceedings of the Workshop “Physics at HERA” vol. 3, DESY (1992) 1294.
-
[16]
Y. Azimov, Y. Dokshitzer, V. Khoze, S. Troyan,
Phys. Lett. B165 (1985) 147;
G. Gustafson, Phys. Lett. B175 (1986) 453;
G. Gustafson, U. Pettersson Nucl. Phys. B306 (1988) 746;
B. Andersson, G. Gustafson, L. Lönnblad, U. Pettersson Z. Phys. C43 (1989) 625. -
[17]
L. Lönnblad, Comp. Phys. Comm. 71
(1992) 15;
L. Lönnblad, Z. Phys. C65 (1995) 285. - [18] T. Sjöstrand and M. Bergtsson, Comp. Phys. Comm. 43 (1987) 367.
-
[19]
ZEUS Collab., M. Derrick et al., Z. Phys., C59 (1993) 231;
ZEUS Collab., M. Derrick et al., Phys. Lett. B338 (1994) 483. - [20] ZEUS Collab., M. Derrick et al., Phys. Lett. B315 (1993) 481.
- [21] ZEUS Collab., M. Derrick et al., DESY 95-093 (1995).
- [22] A.D. Martin, W.J. Stirling and R.G. Roberts, Phys. Rev. D50 (1994) 6734.
- [23] A.D. Martin, W.J. Stirling and R.G. Roberts, Phys. Rev. D51 (1995) 4756.
-
[24]
H.-U. Bengtsson and T. Sjöstrand, Comp. Phys.
Comm. 46 (1987) 43;
T. Sjöstrand, CERN TH-7112-93, (1994). - [25] H. Abramowicz, E.M. Levin, A. Levy and U. Maor, Phys. Lett. B269 (1991) 465.
- [26] H. Abramowicz, A. Caldwell and R. Sinkus, DESY 95-054 (1995).
-
[27]
V.N. Gribov and L.N. Lipatov, Sov. J. Nucl. Phys.
15 (1972) 438, 675;
L.N. Lipatov, Sov. J. Nucl. Phys. 20 (1975) 95;
Yu. L. Dokshitzer, Sov. Phys. JETP 46 (1977) 641;
G. Altarelli and G. Parisi, Nucl. Phys. B 126 (1977) 298. - [28] M. Glück, E. Reya, and M. Stratmann, Nucl. Phys. B422 (1994) 37.
- [29] NMC Collab., P. Amaudruz et al., Phys. Lett. B295 (1992) 159.
- [30] G. Altarelli and G. Martinelli, Phys. Lett. B76 (1978) 89.
- [31] J. Kripfganz, H.-J. Möhring, and H. Spiesberger, Z. Phys. C49 (1991) 501.
-
[32]
M. Glück, E. Reya and A. Vogt,
Z. Phys. C53 (1992) 127;
M. Glück and E. Reya, Dortmund DO-TH 93/27 (1993);
M. Glück, E. Reya and A. Vogt, Phys. Lett B306 (1993) 391;
M. Glück, E. Reya and A. Vogt, Z. Phys. C67 (1995) 433. - [33] A. Donnachie and P.V. Landshoff, Z. Phys. C61 (1994) 139.
-
[34]
L.N. Hand, Phys. Rev. 129 (1963) 1834;
S.D. Drell and J. D. Walecka, Ann. Phys. (N. Y.) 28 (1964) 18;
F.J. Gilman, Phys. Rep. 4C (1972) 95. -
[35]
B.L. Ioffe, Phys. Lett. 30 (1969) 123;
B.L. Ioffe, V.A. Khoze and L.N. Lipatov, “Hard Processes”, North Holland (1984) p185. -
[36]
NMC Collab., M. Arneodo et al.,
CERN-PPE-95-138 (1995);
BCDMS Collab., A.C. Benvenuti et. al., Phys. Lett. B223 (1989) 485;
E665 Collab., Preliminary results presented by A.V. Kotwal at the XXXth Rencontres de Moriond, QCD and High Energy Interactions, March 1995, FERMILAB-Conf-95/046-Expt (1995);
A.V. Kotwal, PhD thesis, Harvard University (1995). - [37] A. Donnachie and P.V. Landshoff, Phys. Lett. B296 (1992) 227.
| range | range | No. | No. BG | Measured | |||
| events | events | ||||||
| 1.5 | 1.3 - 1.9 | 292 | 14.6 | 0.71 | 0.79 0.06 | ||
| 2.0 | 1.9 - 2.7 | 747 | 20.0 | 0.59 | 0.93 0.04 | ||
| 456 | 2.7 | 0.53 | 0.71 0.04 | ||||
| 3.0 | 2.7 - 3.6 | 600 | 17.3 | 0.57 | 1.13 0.06 | ||
| 706 | 1.3 | 0.49 | 0.95 0.04 | ||||
| 1067 | 0 | 0.44 | 0.74 0.03 | ||||
| 4.5 | 3.6 - 5 | 503 | 12.0 | 0.52 | 1.12 0.06 | ||
| 643 | 1.3 | 0.50 | 1.10 0.05 | ||||
| 705 | 0 | 0.45 | 0.93 0.04 | ||||
| 1148 | 0 | 0.39 | 0.72 0.03 | ||||
| 6.0 | 5 - 7 | 289 | 8.0 | 0.53 | 1.58 0.10 | ||
| 389 | 1.3 | 0.50 | 1.08 0.06 | ||||
| 410 | 0 | 0.46 | 0.98 0.06 | ||||
| 1016 | 0 | 0.40 | 0.78 0.03 | ||||
| 8.5 | 7 - 10 | 268 | 4.0 | 0.51 | 1.57 0.11 | ||
| 314 | 1.3 | 0.47 | 0.99 0.06 | ||||
| 333 | 0 | 0.44 | 0.93 0.06 | ||||
| 542 | 0 | 0.36 | 0.66 0.03 | ||||
| 12.0 | 10 - 14 | 124 | 2.7 | 0.48 | 0.99 0.09 | ||
| 167 | 0 | 0.45 | 0.98 0.08 | ||||
| 291 | 0 | 0.37 | 0.73 0.05 | ||||
| 15.0 | 14 - 20 | 81 | 0 | 0.46 | 1.33 0.16 | ||
| 171 | 0 | 0.38 | 0.91 0.07 |
| range | range | No. | No. BG | Measured | |||
| events | events | ||||||
| 1.5 | 1.3 - 2.2 | 273 | 34.4 | 0.72 | 0.59 0.05 0.16 | ||
| 474 | 16.5 | 0.61 | 0.57 0.04 0.10 | ||||
| 3.0 | 2.2 - 3.8 | 429 | 68.5 | 0.57 | 0.79 0.06 0.12 | ||
| 695 | 49.5 | 0.52 | 0.77 0.05 0.13 | ||||
| 4.5 | 3.8 - 6.5 | 265 | 55.7 | 0.56 | 1.20 0.12 0.21 | ||
| 340 | 59.8 | 0.51 | 0.77 0.07 0.18 | ||||
| 570 | 42.5 | 0.47 | 0.70 0.05 0.09 | ||||
| 8.5 | 6.5 - 11.5 | 189 | 45.6 | 0.52 | 0.90 0.11 0.20 | ||
| 246 | 31.2 | 0.48 | 0.93 0.10 0.17 | ||||
| 341 | 15.0 | 0.43 | 0.76 0.06 0.18 | ||||
| 15.0 | 11.5 - 20 | 143 | 22.5 | 0.49 | 1.39 0.20 0.33 | ||
| 159 | 8.7 | 0.45 | 0.91 0.11 0.10 | ||||
| 178 | 9.8 | 0.38 | 0.76 0.09 0.14 |