FERMILAB-CONF-95/096-E
Charm and Beauty Results
from CDF and D0
Paul Derwent
CDF/University of Michigan
Ann Arbor, Michigan, 48109 USA
Reporting for the CDF and D0 collaborations
1 Introduction
Experiments at hadron colliders have become an important element in the understanding of the physics of heavy flavors (charm and beauty) in recent years. The large production cross sections (on order of 50 b for quarks at Tevatron energies) and high luminosity of the Tevatron collider (on order cm-2 sec-1) make plentiful samples. The CDF and D0 collaborations have exploited this large cross section through two distinctive trigger signatures, the presence of high transverse momentum () leptons from the semileptonic decays of the heavy baryons and the presence of dileptons from the decays of mesons.
With these data large samples, production cross section measurements are made. These measurements test our current understanding of perturbative QCD, which is expected to work well for the production of heavy flavors. In addition, measurements of the decay properties of the heavy baryons give insight into the weak mixing angles of the quarks.
This paper focuses on results from the 92-93 Tevatron Collider run. CDF collected approximately 19 during this time period and D0 collected approximately 13 . Detailed descriptions of the CDF [1] and D0 [2] detectors can be found elsewhere. Topics covered include charmonium production measurements (from CDF and D0), inclusive and exclusive beauty production measurements (from CDF and D0), the meson lifetime (CDF), and the first measurement of time dependent mixing at a hadron collider (CDF). Given the large number of analyses presented, I have not included detail on the experimental issues but have instead included references where appropriate. These results, unless noted otherwise, should be considered preliminary.
2 Charmonium Production
In collisions, mesons come from 3 different sources: (1) direct production, (2) decay of hadrons, and (3) radiative decay of mesons. Various methods, described below, are used to disentangle the three sources, which give information about both charm and beauty production and fragmentation at low transverse momentum.
2.1 CDF and Measurements
The CDF Collaboration identifies mesons through their decay to states. For the measurements presented here, one muon is required to have 1.8 GeV/c, and a second muon with 2.8 GeV/c, with 0.6 and 6 GeV/c. A fit over the dimuon mass region 2.9 – 3.3 GeV/c2 to a Gaussian plus linear background is used to extract the component of the dataset (see figure 1). The vertex flight distance is used to measure the prompt and hadron fractions [3]. In figure 2, the measured d/d distribution for is shown, with the three sets of data points (and curves) representing the total, prompt component, and hadron component of the differential cross section. A well defined sample has also been identified. Preliminary differential cross section measurements of the prompt and hadron of the are described in reference [4].

Radiative decays are identified by looking at the mass difference between and states. In a previous publication [5], CDF has identified from radiative decays with the identification of a photon in the calorimeter. Results from the current dataset will be available soon. Another CDF analysis identifies photons which convert to electrons in the detector material. With this technique, the individual and states can be distinguished, though at much lower efficiency. In figure 1, the mass, where the photon has been identified through conversion into an pair, is shown. With this technique, CDF has measured the ratio of (stat) 0.03 (sys) for 6 GeV/c.
With a large sample of radiative decays with the photon identified in the calorimeter, CDF is preparing a measurement of the fraction of from hadron decays. This measurement uses the high precision vertex capabilities to fit the prompt and hadron components, similar to what is used for and measurements.

2.2 D0 and Measurements
The D0 Collaboration also identifies mesons through their decay to states. Both muons are required to have 3 GeV/c, with 0.6 and 8 GeV/c. In the mass region 0.5 – 6.0 GeV/c2, a fit to the predicted mass distribution from all dimuons sources in hadron decays, low mass meson resonances, Drell Yan, and gives a total of 444 36 (stat) 44 (sys) events (see figure 3).
from radiative decay are identified by measuring the mass difference between and (see figure 3). Photons are identified in the calorimeter, with a measured energy greater than 1 GeV. Both the and (which are approximately 45 MeV/c2 apart in mass) contribute to the identified sample. The width of the mass difference is dominated by the calorimeter energy resolution and is measured to be 63 MeV/c2, which doesn’t allow for the resolution of the and states. 30.5 7 (stat) (sys) % of with GeV/c and 0.6 are found to come from radiative decays.

3 Beauty Production
Initial measurements of beauty quark production at the Tevatron were consistently higher than next-to-leading order QCD predictions [6]. With the higher statistics datasets and improved detectors, measurements from the 92-93 Tevatron Collider run offer the opportunity for significant improvements of these measurements.
3.1 CDF Cross Section Measurements
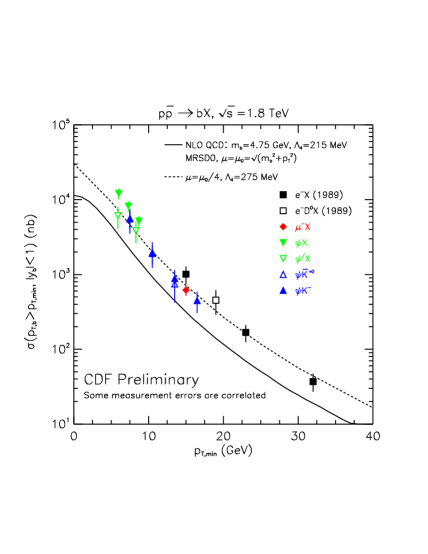
CDF has used many different decay modes of hadrons to extrapolate from the observed cross sections to quark cross sections, among these the , , , , , and . In figure 4, the most recent measurements of the inclusive cross section, , with the standard definition of of reference [6], are shown. The experimental measurements are in reasonable agreement with the upper estimates for the production cross sections.
CDF has also made measurements of differential distributions, for the exclusive decays and , followed by . The meson is required to have 6 GeV/c and 100 m, with the 3 (4) tracks constrained to come from a common vertex point. Under the assumption that , a simultaneous fit to the and mass distributions is performed, with the fits constrained by the relative identification efficiencies of the two resonances (the difference is dominated by the efficiency of finding the low pion in the decay).
The mass distributions, with accompanying fits, for the 4 bins considered and the final d/d distribution are presented in figure 5 [7]. The shape is in reasonable agreement, but there still exists a normalization difference between the experimental results and the central value of the prediction. A fit to the scale factor gives a value of 1.9 0.2 (stat) 0.2 (sys), with probability of 20%.
CDF has many additional measurements in preparation for publication, among them integral and differential correlated quark cross sections, and differential meson cross sections using the semi-leptonic decays , all covering a large range of transverse momentum.

3.2 D0 cross section measurements
The D0 collaboration has made measurements of the inclusive quark cross section using a large inclusive muon sample. The sample includes contributions from decays, decays, and decay-in-flight, and vector boson decays. For 0.8, the measured differential cross section for muons is shown in figure 6. An important piece of this measurement is the proper unfolding of the momentum resolution (), since the inclusive spectrum falls steeply with increasing transverse momentum.
Using the distribution of muon momentum relative to the jet axis, D0 extracts the fraction of the inclusive muon sample as a function of . D0 finds that 60% of the events in the inclusive sample have an associated jet which allows the measurement and assumes that the fraction in the subset applies to the entire sample. In figure 6, the differential muon cross section from decays is presented. The experimental measured points are again consistent with the upper estimate of the next-to-leading order QCD prediction. This measurement has recently been published in Physical Review Letters [9].
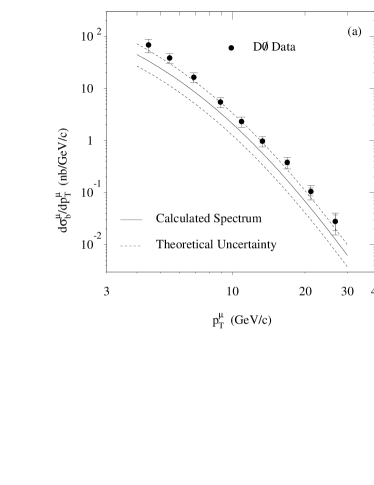
Using the same technique previously used by UA1 [8] and CDF [6], D0 extracts the inclusive quark cross section for from the differential cross section. The measurements are in reasonable agreement with CDF measurements and NLO QCD predictions, though again at the upper estimate of the theoretical predictions. Figure 6 shows the inclusive cross section from the D0 inclusive muon sample.
4 Hadron Decay Measurements
While the production measurements described above mainly test the predictions of next-to-leading order QCD, hadron decay measurements test our understanding of the weak mixing of the quarks. The hadron collider experiments are just beginning to explore the large samples available to make these measurements.
4.1 Lifetime from CDF
With the introduction of high precision vertex detectors, CDF has begun to make significant measurements of the decay properties of hadrons, including inclusive hadron lifetimes [3] and exclusive meson lifetimes [10]. At this conference, CDF presents a new measurement of the meson lifetime, using the decay mode , followed by , .
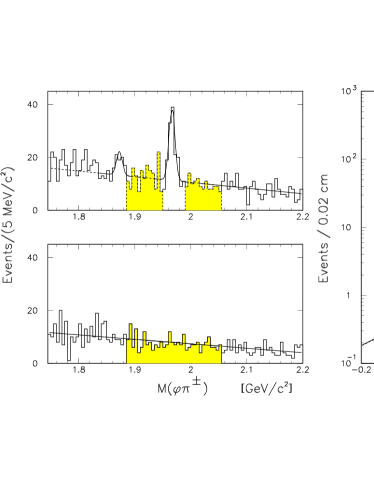
Using both electron and muon samples, CDF has isolated a significant sample (76 8) of events. In figure 7, the mass distribution is displayed. The upper figure shows the right sign lepton pion combination, while the lower figure shows the wrong sign combination. Note the presence of the Cabbibo suppressed decay on the left in the right sign combination distribution. Using the shaded regions to estimate the expected shape of the background sample, an unbinned likelihood fit to the sum of background plus signal is performed. The fit results are also shown in figure 7. The lifetime is included in the fit as a free parameter, with resulting measurement of m (statistical uncertainty only), in good agreement with the PDG value of 140 5 m [11]. The final result is m (statistical systematic uncertainties).
Recent theoretical work has suggested that in addition to splitting between various meson states, that the CP even and CP odd states of the meson may also show a lifetime difference on order 10–20% [12]. events contain a mix of CP even and CP odd states, while the sample is predominantly CP even. CDF has identified a small sample of events (8) and made a measurement of the lifetime in this decay mode. The measurement is currently statistically limited. These results have been accepted for publication by Physical Review Letters [13].
4.2 Time Dependent Mixing from CDF
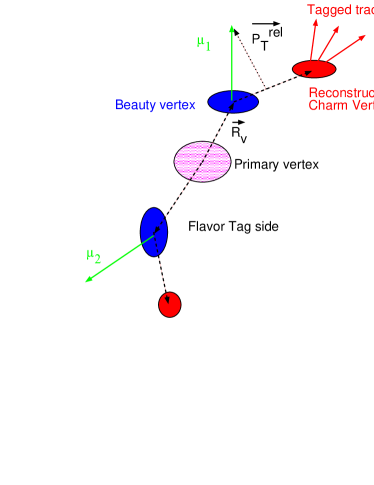
CDF has used a dimuon sample, with a well reconstructed charm vertex, to measure the time dependent mixing parameter . The combination of a charm vertex and a muon can be used to reconstruct the proper decay length of the parent hadron, where the charge of the muon gives the flavor of the hadron at decay time. The presence of a second well identified muon gives a second flavor tag. By measuring the fraction of like sign muon events as a function of the reconstructed proper decay length, CDF extracts a measure, , of the probability that a meson mixes into its charge conjugate, . Figure 8 shows a cartoon of an event used in this analysis.
Requiring the presence of two muons with 2 GeV/c and a reconstructed charm vertex, CDF finds 1516 events with same sign muons and 2357 events with opposite sign muons. The distribution of the muon indicates that the sample is enriched in decays. 84% of the muons on the vertex tag side come from primary decays, while 71% of the muons on the flavor tag side come from primary decays and only 12% are from background.
A binned fit to the like sign fraction is used to extract , where the mixing in the sample is assumed to be maximal. CDF constrains the relative fraction of and mesons to the measured LEP values and includes the effects of sequential decays in the expected shapes. The dominant systematic uncertainty is the understanding of the fraction of events which come from sequential decays (e.g., ). Detailed studies have shown that the kinematics of the data sample agree well with the Monte Carlo samples used to generate the expected shapes.
Figure 9 shows the like sign fraction from the data, overlaid with the fit results under three conditions: (1) and are constrained to be 0, (2) is fixed to 0, and (3) is allowed to float. The first case shows the effects of the sequential decay and background mix in the sample, the second case shows the effects of maximal mixing, and the third case gives the final fit results. The CDF preliminary result for is 0.64 0.18 (stat) 0.21 (sys). CDF expects to lower the systematic uncertainty by a factor of 2 in the near future by understanding better the sequential and primary mix in the sample.

5 Conclusions
I have presented recent results from CDF and D0 in charm and beauty physics. There are many more results (exclusive and inclusive hadron lifetimes, inclusive and differential cross sections, time integrated mixing results, decay polarizations) that have not been presented at this conference. The Tevatron Collider has been running since January 1994, with both experiments accumulating significantly larger datasets. CDF and D0 expect to decrease the statistical uncertainties in the measurements by factors of 2.5 to 3, depending upon the measurement, with these large datasets.
6 Acknowledgements
I wish to thank the members of the CDF and D0 collaborations who helped me in the preparation of this report. As a participant in a very enjoyable and stimulating conference, I would also like to thank Prof. Belletini and Prof. Greco for the invitation.
References
- [1] F. Abe, et al., Nucl. Instrum. Methods A271, 387 (1988).
- [2] S. Abachi, et al., Nucl. Instrum. Methods A338, 185 (1994).
- [3] F. Abe, et al., Phys. Rev. Lett. 71, 3421 (1993).
- [4] The CDF Collaboration, FERMILAB-CONF-94/212-E.
- [5] F. Abe, et al., Phys. Rev. Lett. 71, 2537 (1993).
- [6] F. Abe, et al., Phys. Rev. Lett. 71, 2396 (1993) and references therein.
- [7] F. Abe, et al., FERMILAB-PUB-95/048-E, submitted to Phys. Rev. Lett.
- [8] C. Albajar, et al., Phys. Lett. B 213, 405 (1988).
- [9] S. Abachi, et al., Phys. Rev. Lett. 74 3548 (1995).
- [10] F. Abe, et al., Phys. Rev. Lett. 72 3456 (1994).
- [11] The Particle Data Group, Phys. Rev. D50, 1173 (1994).
- [12] I. Dunietz, FERMILAB-PUB-94/361-T and references therein.
- [13] F. Abe, et al., FERMILAB-PUB-94/420-E, to be published in Phys. Rev. Lett.