A. Zupanc
J. Stefan Institute, Ljubljana
K. Abe
High Energy Accelerator Research Organization (KEK), Tsukuba
K. Abe
Tohoku Gakuin University, Tagajo
H. Aihara
Department of Physics, University of Tokyo, Tokyo
D. Anipko
Budker Institute of Nuclear Physics, Novosibirsk
K. Arinstein
Budker Institute of Nuclear Physics, Novosibirsk
V. Aulchenko
Budker Institute of Nuclear Physics, Novosibirsk
T. Aushev
Swiss Federal Institute of Technology of Lausanne, EPFL, Lausanne
Institute for Theoretical and Experimental Physics, Moscow
S. Bahinipati
University of Cincinnati, Cincinnati, Ohio 45221
A. M. Bakich
University of Sydney, Sydney, New South Wales
E. Barberio
University of Melbourne, School of Physics, Victoria 3010
U. Bitenc
J. Stefan Institute, Ljubljana
I. Bizjak
J. Stefan Institute, Ljubljana
S. Blyth
National Central University, Chung-li
A. Bondar
Budker Institute of Nuclear Physics, Novosibirsk
A. Bozek
H. Niewodniczanski Institute of Nuclear Physics, Krakow
M. Bračko
High Energy Accelerator Research Organization (KEK), Tsukuba
University of Maribor, Maribor
J. Stefan Institute, Ljubljana
T. E. Browder
University of Hawaii, Honolulu, Hawaii 96822
M.-C. Chang
Department of Physics, Fu Jen Catholic University, Taipei
P. Chang
Department of Physics, National Taiwan University, Taipei
Y. Chao
Department of Physics, National Taiwan University, Taipei
K.-F. Chen
Department of Physics, National Taiwan University, Taipei
W. T. Chen
National Central University, Chung-li
B. G. Cheon
Hanyang University, Seoul
R. Chistov
Institute for Theoretical and Experimental Physics, Moscow
S.-K. Choi
Gyeongsang National University, Chinju
Y. Choi
Sungkyunkwan University, Suwon
Y. K. Choi
Sungkyunkwan University, Suwon
J. Dalseno
University of Melbourne, School of Physics, Victoria 3010
M. Dash
Virginia Polytechnic Institute and State University, Blacksburg, Virginia 24061
A. Drutskoy
University of Cincinnati, Cincinnati, Ohio 45221
S. Eidelman
Budker Institute of Nuclear Physics, Novosibirsk
S. Fratina
J. Stefan Institute, Ljubljana
N. Gabyshev
Budker Institute of Nuclear Physics, Novosibirsk
A. Go
National Central University, Chung-li
B. Golob
University of Ljubljana, Ljubljana
J. Stefan Institute, Ljubljana
H. Ha
Korea University, Seoul
J. Haba
High Energy Accelerator Research Organization (KEK), Tsukuba
T. Hara
Osaka University, Osaka
H. Hayashii
Nara Women’s University, Nara
M. Hazumi
High Energy Accelerator Research Organization (KEK), Tsukuba
D. Heffernan
Osaka University, Osaka
T. Hokuue
Nagoya University, Nagoya
Y. Hoshi
Tohoku Gakuin University, Tagajo
W.-S. Hou
Department of Physics, National Taiwan University, Taipei
Y. B. Hsiung
Department of Physics, National Taiwan University, Taipei
T. Iijima
Nagoya University, Nagoya
K. Ikado
Nagoya University, Nagoya
K. Inami
Nagoya University, Nagoya
A. Ishikawa
Department of Physics, University of Tokyo, Tokyo
H. Ishino
Tokyo Institute of Technology, Tokyo
R. Itoh
High Energy Accelerator Research Organization (KEK), Tsukuba
Y. Iwasaki
High Energy Accelerator Research Organization (KEK), Tsukuba
H. Kaji
Nagoya University, Nagoya
P. Kapusta
H. Niewodniczanski Institute of Nuclear Physics, Krakow
H. Kawai
Chiba University, Chiba
T. Kawasaki
Niigata University, Niigata
H. Kichimi
High Energy Accelerator Research Organization (KEK), Tsukuba
H. J. Kim
Kyungpook National University, Taegu
Y. J. Kim
The Graduate University for Advanced Studies, Hayama
K. Kinoshita
University of Cincinnati, Cincinnati, Ohio 45221
S. Korpar
University of Maribor, Maribor
J. Stefan Institute, Ljubljana
P. Križan
University of Ljubljana, Ljubljana
J. Stefan Institute, Ljubljana
P. Krokovny
High Energy Accelerator Research Organization (KEK), Tsukuba
R. Kulasiri
University of Cincinnati, Cincinnati, Ohio 45221
R. Kumar
Panjab University, Chandigarh
Y.-J. Kwon
Yonsei University, Seoul
M. J. Lee
Seoul National University, Seoul
T. Lesiak
H. Niewodniczanski Institute of Nuclear Physics, Krakow
A. Limosani
High Energy Accelerator Research Organization (KEK), Tsukuba
S.-W. Lin
Department of Physics, National Taiwan University, Taipei
D. Liventsev
Institute for Theoretical and Experimental Physics, Moscow
G. Majumder
Tata Institute of Fundamental Research, Mumbai
F. Mandl
Institute of High Energy Physics, Vienna
T. Matsumoto
Tokyo Metropolitan University, Tokyo
S. McOnie
University of Sydney, Sydney, New South Wales
T. Medvedeva
Institute for Theoretical and Experimental Physics, Moscow
W. Mitaroff
Institute of High Energy Physics, Vienna
K. Miyabayashi
Nara Women’s University, Nara
H. Miyake
Osaka University, Osaka
H. Miyata
Niigata University, Niigata
Y. Miyazaki
Nagoya University, Nagoya
R. Mizuk
Institute for Theoretical and Experimental Physics, Moscow
G. R. Moloney
University of Melbourne, School of Physics, Victoria 3010
E. Nakano
Osaka City University, Osaka
M. Nakao
High Energy Accelerator Research Organization (KEK), Tsukuba
H. Nakazawa
National Central University, Chung-li
Z. Natkaniec
H. Niewodniczanski Institute of Nuclear Physics, Krakow
S. Nishida
High Energy Accelerator Research Organization (KEK), Tsukuba
O. Nitoh
Tokyo University of Agriculture and Technology, Tokyo
S. Ogawa
Toho University, Funabashi
T. Ohshima
Nagoya University, Nagoya
S. Okuno
Kanagawa University, Yokohama
Y. Onuki
RIKEN BNL Research Center, Upton, New York 11973
H. Ozaki
High Energy Accelerator Research Organization (KEK), Tsukuba
P. Pakhlov
Institute for Theoretical and Experimental Physics, Moscow
G. Pakhlova
Institute for Theoretical and Experimental Physics, Moscow
C. W. Park
Sungkyunkwan University, Suwon
R. Pestotnik
J. Stefan Institute, Ljubljana
L. E. Piilonen
Virginia Polytechnic Institute and State University, Blacksburg, Virginia 24061
Y. Sakai
High Energy Accelerator Research Organization (KEK), Tsukuba
N. Satoyama
Shinshu University, Nagano
T. Schietinger
Swiss Federal Institute of Technology of Lausanne, EPFL, Lausanne
O. Schneider
Swiss Federal Institute of Technology of Lausanne, EPFL, Lausanne
C. Schwanda
Institute of High Energy Physics, Vienna
R. Seidl
University of Illinois at Urbana-Champaign, Urbana, Illinois 61801
RIKEN BNL Research Center, Upton, New York 11973
K. Senyo
Nagoya University, Nagoya
M. E. Sevior
University of Melbourne, School of Physics, Victoria 3010
M. Shapkin
Institute of High Energy Physics, Protvino
H. Shibuya
Toho University, Funabashi
B. Shwartz
Budker Institute of Nuclear Physics, Novosibirsk
J. B. Singh
Panjab University, Chandigarh
A. Somov
University of Cincinnati, Cincinnati, Ohio 45221
N. Soni
Panjab University, Chandigarh
S. Stanič
University of Nova Gorica, Nova Gorica
M. Starič
J. Stefan Institute, Ljubljana
H. Stoeck
University of Sydney, Sydney, New South Wales
K. Sumisawa
High Energy Accelerator Research Organization (KEK), Tsukuba
T. Sumiyoshi
Tokyo Metropolitan University, Tokyo
S. Suzuki
Saga University, Saga
F. Takasaki
High Energy Accelerator Research Organization (KEK), Tsukuba
K. Tamai
High Energy Accelerator Research Organization (KEK), Tsukuba
M. Tanaka
High Energy Accelerator Research Organization (KEK), Tsukuba
G. N. Taylor
University of Melbourne, School of Physics, Victoria 3010
Y. Teramoto
Osaka City University, Osaka
X. C. Tian
Peking University, Beijing
I. Tikhomirov
Institute for Theoretical and Experimental Physics, Moscow
K. Trabelsi
High Energy Accelerator Research Organization (KEK), Tsukuba
T. Tsukamoto
High Energy Accelerator Research Organization (KEK), Tsukuba
S. Uehara
High Energy Accelerator Research Organization (KEK), Tsukuba
K. Ueno
Department of Physics, National Taiwan University, Taipei
S. Uno
High Energy Accelerator Research Organization (KEK), Tsukuba
Y. Ushiroda
High Energy Accelerator Research Organization (KEK), Tsukuba
Y. Usov
Budker Institute of Nuclear Physics, Novosibirsk
G. Varner
University of Hawaii, Honolulu, Hawaii 96822
S. Villa
Swiss Federal Institute of Technology of Lausanne, EPFL, Lausanne
C. H. Wang
National United University, Miao Li
Y. Watanabe
Tokyo Institute of Technology, Tokyo
E. Won
Korea University, Seoul
Q. L. Xie
Institute of High Energy Physics, Chinese Academy of Sciences, Beijing
A. Yamaguchi
Tohoku University, Sendai
Y. Yamashita
Nippon Dental University, Niigata
M. Yamauchi
High Energy Accelerator Research Organization (KEK), Tsukuba
Y. Yusa
Virginia Polytechnic Institute and State University, Blacksburg, Virginia 24061
C. C. Zhang
Institute of High Energy Physics, Chinese Academy of Sciences, Beijing
Z. P. Zhang
University of Science and Technology of China, Hefei
V. Zhilich
Budker Institute of Nuclear Physics, Novosibirsk
V. Zhulanov
Budker Institute of Nuclear Physics, Novosibirsk
Abstract
We reconstruct decays using a sample of
pairs recorded by the Belle
experiment, and measure the branching fraction to be
.
A search for the related decay is also performed.
Since we observe no statistically significant signal an upper
limit on the branching fraction is set at
(90% C.L.).
Several decay modes of mesons with a in the
final state have been measured at the -factories.
The amplitudes governing these decays are interesting
because none of the constituent flavors of the
are present in the initial state. For example, the decays
Krokovny:2002pe ; Aubert:2002vg
and Drutskoy:2005zr ,
observed with branching fractions in the range , can
proceed via a -exchange diagram.
Here we study the related decays and
. The former proceeds via Cabibbo-suppressed
-exchange and has not yet been observed; theoretical calculations
predict a branching fraction ranging from
Li:2003az up to
Eeg:2005au .
The latter of the two above decays proceeds via a Cabibbo-favored tree
diagram; the ratio of its branching fraction to that for
can be used to test the factorization hypothesis for exclusive non-leptonic
decays of mesons Kim:2001cj . However, previous measurements of
Bortoletto:1991kz ; Albrecht:1991pa ; Gibaut:1995tu ; Aubert:2006nm
have large uncertainties, which limit the usefulness of this method at present.
In this paper we report an improved measurement of decays and a search for decays with the Belle detector Belle_det at the
KEKB asymmetric-energy collider KEKB_acc .
Charge conjugate modes are implied throughout this paper.
The results are based on a fb-1 data sample collected at the center-of-mass (CM)
energy of the resonance, corresponding to
pairs. We assume equal production of and pairs.
To study backgrounds, we use a Monte Carlo (MC)
simulated sample qq98 of
events and continuum events, (, , and quarks).
The Belle detector is a large-solid-angle magnetic spectrometer that consists of a multi-layer silicon
vertex detector (SVD), a 50-layer central drift chamber (CDC), an array of aerogel threshold
Cherenkov counters (ACC), a barrel-like arrangement of time-of-flight scintillation counters
(TOF), and an electromagnetic calorimeter (ECL) comprised of CsI(Tl) crystals located
inside a superconducting solenoid coil that provides a T magnetic field. An iron flux-return
located outside of the coil is instrumented to detect mesons and to identify muons (KLM).
The detector is described in detail in Ref. Belle_det . Two different inner detector
configurations were used. For the first 152 million pairs, a cm radius
beampipe and a 3-layer silicon vertex detector were used; for the latter 297 million pairs,
a cm radius beampipe, a 4-layer silicon detector and a small-cell inner drift chamber were
used Natkaniec:2006rv .
II Reconstruction
Charged tracks are selected with
loose requirements on their impact parameters relative to the interaction
point (IP) and the transverse momentum of the tracks.
For charged particle identification (PID) we combine
information from the CDC, TOF and ACC counters into a likelihood ratio
Nakano:2002jw .
A selection imposed on this ratio results in a typical kaon (pion) identification efficiency ranging from 92% to
97% (94% to 98%) for various decay modes, while 2% to 15% (4% to 8%) of kaon (pion) candidates are
misidentified pions (kaons).
We use the , and modes to reconstruct mesons and
, , and for the mesons, where the ,
and decay to , and ,
respectively.
Combinations of oppositely-charged kaons with
MeV/ and of oppositely-charged kaons and
pions with MeV/, originating
from a common vertex, are retained as and
candidates, where and are the nominal masses of
the two mesons Yao:2006px .
Neutral kaons () are reconstructed using
pairs of oppositely-charged tracks
that have an invariant mass within 30 MeV of the nominal mass,
and originate from a common vertex, displaced from the IP.
All candidates with invariant masses within a
() interval around the nominal () mass are considered for further
analysis, where () signal resolutions () range from MeV/ to MeV/ ( MeV/ to
MeV/).
A decay vertex fit with a mass constraint is applied to the selected candidates to improve their momentum resolution.
For the decay we also add an additional
constraint on the value of the cosine of a helicity angle,
for the decay mode,
where is defined as the angle between the
direction of the and the originating from the vector-meson ( or
) in the vector-meson rest frame.
The distribution in is expected to be proportional to for the signal and uniform for
the combinatorial background.
Pairs of and meson candidates are combined to form meson candidates. These
are identified by their CM energy difference,
,
and the beam-energy constrained mass,
,
where is the CM beam energy and
and are
the reconstructed energy and momentum of the meson candidate in
the CM frame. The signal region is GeV GeV
for the , and
GeV GeV and
GeV for the decays.
To suppress the large combinatorial background dominated by the two-jet-like
continuum process, variables characterizing the event topology are used. We
require the ratio of the second to zeroth Fox-Wolfram
moments Fox:1978vu , and
the thrust value of the event, .
Simulation shows that this selection retains more than 95% of
events and
rejects about 55% of
events and 65% of ,
and events.
The above selection criteria and signal regions are determined by maximizing the figure of merit (FoM),
, where and are the numbers of
signal and background events determined from MC. For optimization of the FoM we assume
.
The fraction of events with more than one () candidate is 4.9% (2.8%).
As the best candidate we select the one with the minimal value, where and are ’s
of the mass-constrained vertex fit.
III decays
Figure 1: distribution for reconstructed
events in the signal region. The curve shows the result of
the fit. The normalized distribution for the events in the sidebands
of both and invariant masses is shown
as the hatched histogram.
The distribution of events in the signal
region, obtained after
applying all selection criteria described above is shown in
Fig. 1. Apart from the signal peak at ,
contributions from two other specific decay modes were identified using the MC:
and .
These events cluster around and due to
the unreconstructed or from the meson.
The distribution is described by two Gaussians with the same mean for the signal,
two Gaussians for the , background events,
and a linear function for the rest of the background.
The normalizations, positions and widths of the Gaussians are free
parameters of the binned likelihood fit.
The solid line in Fig. 1 shows the result
of the fit.
The positions and widths of the
, background components agree with the
values expected from the MC.
In addition, we perform separate fits to the distributions for each
decay mode using the same function with the widths and means of all four
Gaussian functions fixed to the values obtained by the overall fit.
We use events in the and meson invariant mass sidebands
in order to check for
peaking backgrounds.
For this check the masses of and candidates are not constrained
to their nominal masses. The () invariant mass sidebands are MeV/ intervals around () nominal mass, excluding the () signal region.
Due to common final states used to reconstruct and candidates we
exclude the () signal regions and a MeV/ mass region from () sidebands.
The and distributions obtained by
simultaneously using events in the sidebands of
both the and mesons are in agreement with the observed
combinatorial background under the signal.
A significant signal is present only in the sideband,
for ’s reconstructed in the decay mode.
This is due to the three-body
decay, reported in Ref. Drutskoy:2002ib .
The fraction of these events in the signal peak was evaluated by fitting the distribution
in the sideband.
We observe no peaking background when using the mass sideband.
The signal in Fig. 1 also includes contributions from
, and
, which all have a common final state, as well as a small contribution () from
decays, where one of the decays in-flight to a and and the is
misidentified as the . We evaluate these fractions using simulated events. The contribution of these decays is around
five times larger than the contribution of decays.
We take into account the relative contributions of individual and
decay modes and determine the overall fraction of peaking background events () to be ()%.
The uncertainty includes the
statistical uncertainty in sideband fits, non-uniformity of
in decays,
limited MC statistics and uncertainties in
the corresponding branching fractions Yao:2006px .
The signal yield for
is thus , where is the number
of events in the signal peak obtained from the fit to the distribution (Fig. 1).
IV decays
The distribution for decays obtained after applying
all selection criteria described above is shown in Fig. 2(a).
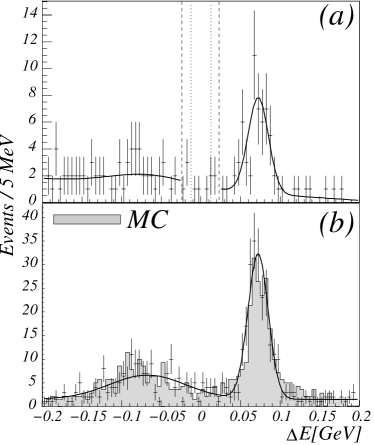
Figure 2: (a) distribution for the decay mode. Two vertical dashed lines show the interval excluded
from the fit, as described in the text, and two dotted lines show the signal
region. (b) distribution for reconstructed events obtained
by inverting the kaon identification requirements in data and in the MC sample.
The expected width of the narrower signal Gaussian, which describes of the events, is MeV. This value is
obtained from the MC sample and rescaled by a factor obtained after a comparison of parameters from data
and MC samples. The signal region includes around of the signal.
While the distribution of the combinatorial background is well
described by a first order polynomial, there is a significant
cross-feed contribution from , , and decays,
where the decays into a or final state and
one of the pions is misidentified as a kaon. Figure 2(b) shows the
distribution of these cross-feed events, as obtained in both data and MC samples by
selecting one of the kaon tracks in the decay chain with a pion PID requirement. Events peaking around
GeV are due to
decays, while the events clustering around GeV
are due to and
decays without a reconstructed or a photon.
The distribution of
cross-feed events is described by the sum of two Gaussian functions and a
constant. The solid line in Fig. 2(b) shows the result of the fit.
The widths and means of the two Gaussian functions are statistically consistent with the values obtained from MC.
The expected number of background events populating the signal region is determined by a binned likelihood
fit to the distribution sidebands ( MeV region indicated by the two vertical dashed lines in Fig. 2(a)).
While normalizations are free parameters of the fit, the widths and means of the two Gaussian functions are fixed to the values obtained from
a fit to the distribution of the misidentified data (Fig. 2(b)). The fit result is then integrated
across the signal region (indicated by the two dotted lines in Fig. 2(a)) to obtain the
number of background events, , where
the systematic error is evaluated by varying
values of the fixed fit parameters by one standard deviation. Since only three events are observed in the signal region,
the result for indicates that there is no statistically significant signal present in
this interval. Thus the expected tail of the signal, which might populate
the fitted region (parameterized as background only), can be safely neglected.
The average efficiency of the selection criteria is evaluated from MC, where the intermediate branching fractions and are taken from Ref. Yao:2006px , and is taken from Ref. Adam:2006me .
To check for a possible peaking background we use events in the mass sidebands.
No peaking structures are observed in any of the - distributions.
V Results
Table 1: Sources of systematic uncertainty in and
measurements.
Systematics
’s of and mesons
Tracking
MC statistics
Signal window
Signal fraction ()
Fitting model
included in
Total
We consider several sources of systematic
uncertainty as listed in Table 1. The largest contribution
arises from an imprecise knowledge of the intermediate branching fractions of and mesons and amounts to
() for () decay mode Yao:2006px ; Adam:2006me .
A relative error for each of the charged tracks used in the
reconstructed final states
is assigned due to the
uncertainty in tracking efficiency determined using partially reconstructed ’s.
The particle identification efficiency has a relative uncertainty of per charged kaon
and per charged pion, determined from , decays.
The relative error for each reconstructed in the final state is .
A () uncertainty is due to the limited statistics of the MC
sample used for the efficiency calculation. Since the efficiency is evaluated for the signal region,
we assign an additional () uncertainty due to
the small possible difference in the signal resolution between data and MC samples.
A uncertainty is due to the imprecise knowledge of the fraction of true signal events, (), in the data sample.
Systematic uncertainty arising from the description of the distribution is evaluated by comparing the known number of
reconstructed events in the simulated sample with the fitted yield and
is found to be . Finally, the
uncertainty in the number of events () is taken into account.
The sum in quadrature of the individual
contributions gives a systematic error of for a and
for a measurement, excluding the uncertainty due to the fitting model included in .
Table 2: Results on the fitted numbers of events in the signal peak and branching fractions for decay mode.
The peaking background fraction, , is given for each decay mode in the second column.
The efficiencies include intermediate branching fractions (),
which are taken for all three and and decay modes from Ref. Yao:2006px , and that for
is taken from Ref. Adam:2006me .
In the last column the dominant sources of systematic uncertainty, the branching fractions, , are factored out.
Quoted uncertainties for are statistical, systematic and uncertainty due to the imprecise knowledge of intermediate branching fractions, respectively.
Mode
,
,
,
Combined
The number of signal events, , is converted into a
branching fraction using the MC efficiency and the
number of events.
The measured branching fraction is given in Table 2.
We use the world average of Yao:2006px and calculate the ratio
(1)
Before comparing this result to the numerical prediction of given in Ref. Kim:2001cj — in which the calculation
is performed in the generalized factorization scheme and includes penguin effects — we rescale it by a factor
, where is the average value of meson decay constant
given in Refs. Yao:2006px ; Artuso:2006kz and is the value used in the original calculation.
The expected value is , where the uncertainty originates
from the dependence on the decay constant and form-factors, the former being the main source.
The ratio is consistent with unity.
If one does not include the penguin contributions Kim:2001cj to the amplitude for decay, the above ratio would be .
We observe no statistically significant signal in the decay mode.
The central value for the measured branching fraction is
.
We infer an upper limit on the from the total measured number of
reconstructed events and the number of background events in the signal region
( and , respectively),
and the measured sensitivity, . The latter error includes all systematic uncertainties given in Table 1. To estimate the upper
limit we use Bayes’s theorem with a flat-prior for the signal following the prescription in (Section 32.3.1 in Ref. Yao:2006px ):
(2)
The number of observed events is Poisson distributed around the sum of and :
,
where and are the expected number of signal and
background events, respectively.
In particular
can be written as ,
where and are true values of and the sensitivity
, respectively.
The true value of can only take non-negative values and is Gaussian distributed
around with variance . Hence
is a Gaussian function with a cut-off for .
The prior probability density
is assumed to be factorizable,
. For
we use
a flat-prior, and is again a Gaussian function
centered at , with a width of and with a cut-off for .
Integrating out the nuisance parameters and
we obtain the posterior , which already takes into account the
statistical error on , the systematic error due to the
parameterization of distribution in the fit,
and systematic uncertainties on the efficiency and on the number of
pairs.
The 90% C. L. upper limit on following
from this posterior is found to be
VI Conclusions
In conclusion, we have measured the branching fraction for decays. The measured value is
,
which represents a large improvement in accuracy as compared to previous
measurements Bortoletto:1991kz ; Albrecht:1991pa ; Gibaut:1995tu ; Aubert:2006nm .
Combining this result with the world average for Yao:2006px we obtain the ratio
. With present experimental and
theoretical uncertainties, the results are consistent with the factorization hypothesis for non-leptonic exclusive decays of mesons.
If one does not include the penguin contributions Kim:2001cj to the amplitude for decay, the above ratio is not consistent with unity.
For decays we found no statistically significant signal. We set an
upper limit of
at 90% C.L.
This result puts even more stringent limits on
than the recent measurement by the BaBar
collaboration Aubert:2005jv , severely challenges recent theoretical
estimates in Refs. Li:2003az ; Eeg:2005au
and implies that the weak annihilation contributions in
decay modes with two charmed mesons are small, as suggested in Ref. Chen:2005rp .
We thank the KEKB group for excellent operation of the
accelerator, the KEK cryogenics group for efficient solenoid
operations, and the KEK computer group and
the NII for valuable computing and Super-SINET network
support. We acknowledge support from MEXT and JSPS (Japan);
ARC and DEST (Australia); NSFC and KIP of CAS (China);
DST (India); MOEHRD, KOSEF and KRF (Korea);
KBN (Poland); MIST (Russia); ARRS (Slovenia); SNSF (Switzerland);
NSC and MOE (Taiwan); and DOE (USA).
References
(1)
P. Krokovny et al. [Belle Collaboration],
Phys. Rev. Lett. 89, 231804 (2002).
(2)
B. Aubert et al. [BABAR Collaboration],
Phys. Rev. Lett. 90, 181803 (2003).
(3)
A. Drutskoy et al. [Belle Collaboration],
Phys. Rev. Lett. 94, 061802 (2005).
(4)
Y. Li, C. D. Lu and Z. J. Xiao,
J. Phys. G 31, 273 (2005).
(5)
J. O. Eeg, S. Fajfer and A. Prapotnik,
Eur. Phys. J. C 42, 29 (2005).
(6)
C. S. Kim, Y. Kwon, J. Lee and W. Namgung,
Phys. Rev. D 65, 097503 (2002).
(7)
D. Bortoletto et al. [CLEO Collaboration],
Phys. Rev. D 45, 21 (1992).
(8)
H. Albrecht et al. [ARGUS Collaboration],
Z. Phys. C 54, 1 (1992).
(9)
D. Gibaut et al. [CLEO Collaboration],
Phys. Rev. D 53, 4734 (1996).
(10)
B. Aubert et al. [BABAR Collaboration],
Phys. Rev. D 74, 031103 (2006).
(11)
A. Abashian et al. [Belle Collaboration],
Nucl. Instrum. Meth. A 479, 117 (2002).
(12)
S. Kurokawa and E. Kikutani,
Nucl. Instrum. Meth. A 499, 1 (2003), and other papers included in this Volume.
(13) We use the EvtGen -meson decay generator developed by the CLEO
and BaBar Collaborations, see: http://www.slac.stanford.edu/lange/EvtGen/. The
detector response is simulated by a program based on GEANT-3, CERN program library
writeup W5013, CERN, (1993).
A small fraction of events are generated with the CLEO QQ generator,
see: http://www.lns.cornell.edu/public/CLEO/soft/QQ). For these events the detector response is also
simulated with GEANT, R. Brun et al., GEANT 3.21, CERN Report DD/EE/84-1, 1984.
(14)
Z. Natkaniec et al., [Belle SVD2 Group]
Nucl. Instrum. Meth. A 560, 1 (2006).
(15)
E. Nakano,
Nucl. Instrum. Meth. A 494, 402 (2002).
(16)
W.-M. Yao et al. [Particle Data Group],
J. Phys. G 33, 1 (2006).
(17)
G. C. Fox and S. Wolfram,
Phys. Rev. Lett. 41, 1581 (1978).
(18)
A. Drutskoy et al. [Belle Collaboration],
Phys. Lett. B 542, 171 (2002).
(19)
N. Adam et al. [CLEO Collaboration],
arXiv:hep-ex/0607079.
(20)
M. Artuso et al. [CLEO Collaboration],
arXiv:hep-ex/0607074.
(21)
B. Aubert et al. [BABAR Collaboration],
Phys. Rev. D 72, 111101 (2005).
(22)
C. H. Chen, C. Q. Geng and Z. T. Wei,
Eur. Phys. J. C 46, 367 (2006).
![[Uncaptioned image]](/html/hep-ex/0703040/assets/x1.png)