CP Violation in and Status of SU(3)-related Decays
Abstract
We present measurements from Belle and BABAR of the time-dependent -violation parameters and in decays. Both experiments observe mixing-induced violation with a significance of more than 5 standard deviations in this penguin dominated mode. We also compare with theoretical expectations and discuss the latest results for SU(3)-related decays which are useful for obtaining bounds on the expected values of and .
I Introduction
Because of the large rate for the process, the decay has proved to be the most precise outside of the system for determination of the value of through time-dependent -violation measurements. The dominant process is a penguin (loop) decay where new physics can enter through additional particles in the loop. There have been many predictions for the Standard-Model (SM) and non-SM expectations for this and related processes theory ; BN ; WZ ; GLNQ ; GRZ .
We report new results from BABAR babar and Belle belle . Both of these analyses observe mixing-induced violation with a significance of more than 5 standard deviations. We compare the results with theoretical expectations, some of which use data (summarized below) for decays of mesons to pairs of isoscalar mesons.
II Status of
When the decay was first observed CLEOetapobs , the measured branching was much larger than theoretical predictions involving naive factorization. The situation has changed substantially with more recent calculations. In QCD factorization calculations BN , it was pointed out that higher-order QCD corrections and slight tweaking of parameters can easily account for the large observed result, though theory errors are still large. In a paper involving QCD factorization, SCET and inputs from -decay data, the explanation of the large rate is thought to come from “charming-penguins”, long-distance effects involving the in the loop. While the details of the explanation for the large rate still differ somewhat, the recent calculations account for the large observed branching fraction with predominantly penguin amplitudes and the contribution from tree or penguin amplitudes involving is small. This feature is important as will be seen below.
III Experimental details
For these measurements, Belle uses a dataset with a luminosity of 492 (535 pairs). The corresponding numbers for BABAR are 349 and 384 pairs.
Both experiments use five final states of , denoted . Those with a decay use the decays (), (), and (), where and denote the decays and , respectively. Those with a use and . For the decays , both experiments use the mode while Belle additionally uses .
The quantities used in the analysis are similar for both experiments: a -mass variable (denoted for BABAR), (the asterisk denotes center-of-mass quantities), variables that discriminate between spherical -decay events and jetlike background, a tagging variable to determine the flavor of the “tag” (), and the difference of the proper decay times and of the and tag mesons, respectively. Maximum-likelihood (ML) fits are used to distinguish signal from background and to determine the parameters and via the time dependence (for BABAR—the formula for Belle is similar)
where is the eigenvalue of the final state ( for , for ). The upper (lower) sign denotes a decay accompanied by a () tag, is the mean lifetime, is the mixing frequency, and the mistag parameters and are the average and difference, respectively, of the probabilities that a true is incorrectly tagged as a or vice versa.
For the ML fits for BABAR use all of the inputs mentioned above; Belle uses all except the event shape (they cut on this quantity). The fits for are similar except that one of the pair [,] is not used in the fit. Instead both experiments perform a constrained fit to the -decay hypothesis since the energy is poorly measured.
| BABAR | Belle | |||||||
| Mode | ||||||||
| 11943 | 2870 | |||||||
| 664 | 634 | |||||||
| 177 | 125 | |||||||
| 13915 | 683 | |||||||
| 490 | 247 | |||||||
| 4199 | 4606 | |||||||
| 585 | ||||||||
IV Results from Belle and BABAR
G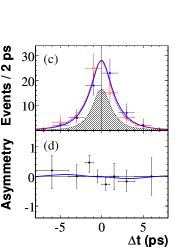
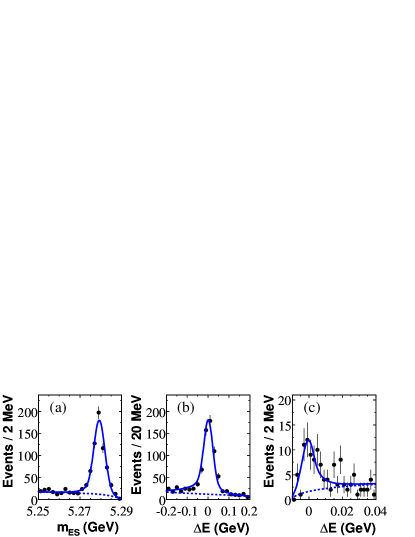
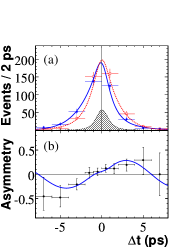
To illustrate the samples, we show in Fig. 1 projection plots for the signals from BABAR. The results of the fits for both experiments for all subsamples are shown in Table 1. The values of are inconsistent with zero at the level of 5.5 standard deviations () for BABAR and 5.6 for Belle. is consistent with zero for both experiments. Plots of the time-dependence for BABAR are shown in Fig. 2 and Belle in Fig. 3. The values of and for both experiments are now in good agreement with average values and HFAG .
| Mode | GLNQ Coeff. | GRZ Coeff. | BR or 90% CL ULs | |||
|---|---|---|---|---|---|---|
| BABAR | Belle | CLEO | GRZ UL | |||
| 0.96 | 0.87 | BABARetapeta | Belleetapeta | CLEOetapeta | ||
| 0.59 | 0.23 | BABARetapeta | Belleetappiz | CLEOetappiz | ||
| 0.53 | BABARetapetap | Belleetapeta | CLEOetapeta | |||
| 0.38 | BABARetapetap | Belleetaeta | CLEOetapeta | |||
| 0.33 | 0.83 | BABARetapeta | Belleetaeta | CLEOetappiz | ||
| 0.14 | BABARpizpiz | Bellepizpiz | CLEOpizpiz | |||
V Theoretical understanding
V.1 First-principles calculations
The theoretical expectation is that the value of (indicative of direct violation) is near zero while for the SM, should be nearly equal to . The world average for is HFAG . Small deviations from this value arise from tree or penguin amplitudes which have a different weak phase. The size of these deviations is expected to be ; when calculation parameters are varied, the range is theory .
V.2 SU(3)-related modes and theoretical limits
The above predictions are based on QCD factorization, PQCD, or SCET calculations. In 2003, Grossman, Ligeti, Nir, and Quinn (GLNQ) GLNQ showed that SU(3) and data from related decays can be used to limit the size of the amplitudes. In their analysis, data from the six processes , , , , , and are used. Measurements for these decays have improved substantially in recent years, with the current experimental situation summarized in Table 2.

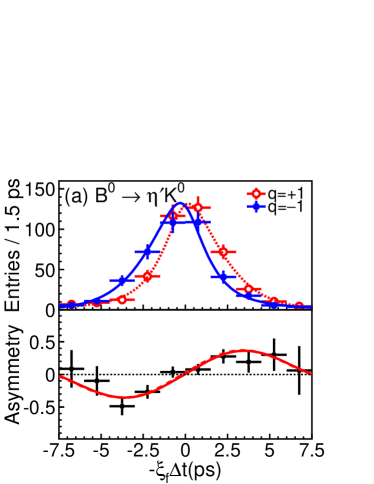
In this table, we also show the coefficients from the GLNQ calculation and order the modes from largest to smallest contributors to the limit on , deviation in the value of from . We also show in red the three decays that are used in a more recent update of the GLNQ calculation by Gronau, Rosner, and Zupan (GRZ) GRZ , where it is assumed that exchange and penguin annihilation amplitudes are small. They find the allowed ranges of and shown in Fig. 4. The range from the , , and decays is .
VI Summary
The BABAR and Belle experiments have each measured violation in the decay with significance greater than 5. Belle finds and while BABAR finds and . These measurements are in good agreement with the expectations of the Standard Model. While the precision of these measurements is much better than was anticipated a decade ago, substantial improvement in precision is needed in order to check for non-SM effects.
Acknowledgements.
I would like to thank the organizers for an enjoyable and productive meeting. It is also important to acknowledge all of the people at KEK-B and PEP-II for their superb efforts in producing luminosities beyond what we expected a decade ago. I also wish to thank colleagues on BABAR and Belle for their efforts in achieving the very impressive results presented here.References
- (1) Y. Grossman and M. P. Worah, Phys. Lett. B 395, 241 (1997); D. Atwood and A. Soni, Phys. Lett. B 405, 150 (1997); D. London and A. Soni, Phys. Lett. B 407, 61 (1997); M. Ciuchini et al., Phys. Rev. Lett. 79, 978 (1997); M. Beneke, Phys. Lett. B 620, 143 (2005); G. Buchalla et al., J. High Energy Phys. 0509, 074 (2005); H.-Y. Cheng, C.-K. Chua and A. Soni, Phys. Rev. D 72, 014006 (2005).
- (2) M. Beneke and M. Neubert, Nucl. Phys. B 675, 333 (2003).
- (3) A. R. Williamson and J. Zupan, Phys. Rev. D 74, 014003 (2006).
- (4) Y. Grossman, Z. Ligeti, Y. Nir and H. R. Quinn, Phys. Rev. D 68, 015004 (2003).
- (5) M. Gronau, J. L. Rosner, and J. Zupan, Phys. Rev. D 74, 093003 2006.
- (6) BABAR Collaboration, B. Aubert et al., Phys. Rev. Lett. 98, 031801 (2007).
- (7) Belle Collaboration, K. F. Chen et al., Phys. Rev. D 98, 031802 (2007).
- (8) CLEO Collaboration, B. H. Behrens et al., Phys. Rev. Lett. 80, 3710 (1998).
-
(9)
http://www.slac.stanford.edu/xorg/hfag/triangle/
ichep2006/index.shtml - (10) BABAR Collaboration, B. Aubert et al., Phys. Rev. D 73, 071102 (2006).
- (11) BABAR Collaboration, B. Aubert et al., Phys. Rev. D 74, 051106 (2006).
- (12) BABAR Collaboration, B. Aubert et al., hep-ex/0607106 (2006).
- (13) Belle Collaboration, J. Schümann, C. H. Wang, hep-ex/0701046, submitted to PRD (2007).
- (14) Belle Collaboration, J. Schümann, C. H. Wang, Phys. Rev. Lett. 97, 061802 (2006).
- (15) Belle Collaboration, P. Chang, Phys. Rev. D 71, 091106 (2005).
- (16) Belle Collaboration, K. Abe, hep-ex/0610065 (2006).
- (17) CLEO Collaboration, B. H. Behrens et al., Phys. Rev. Lett. 80, 3710 (1998).
- (18) CLEO Collaboration, S. J. Richichi et al., Phys. Rev. Lett. 85, 520 (2000).
- (19) CLEO Collaboration, A. Bornheim et al., Phys. Rev. D 68, 052002 (2003).