Spectroscopy and Decay of Hadrons at the Tevatron
Contribution to the proceedings of HQL06,
Munich, October 16th-20th 2006
Manfred Paulini
for the CDF and DO Collaboration
Carnegie Mellon University
Department of Physics
Pittsburgh, PA 15213, U.S.A.
1 Introduction
Traditionally, physics has been the domain of machines operating on the resonance or the pole. But the UA 1 Collaboration has already shown that physics is feasible at a hadron collider environment (see for example Ref. [1]). The first signal of fully reconstructed mesons at a hadron collider has been published by the CDF Collaboration in 1992 [2]. CDF reconstructed a handful of events in a data sample of 2.6 pb-1 taken during the Tevatron Run 0 at the end of the 1980’s. Since then experimental techniques improved significantly. Especially with the development of high precision silicon vertex detectors, the study of hadrons is now an established part of the physics program at hadron colliders.
The CDF and DO experiments can look back to an already successful physics program during the 1992-1996 Run I data taking period (for a review of physics results from, for example, CDF in Run I see Ref. [3]). Nowadays, physics results from a hadron collider are fully competitive with the factories. As discussed later in this review, with the operation of a hadronic track trigger, CDF reconstructs fully hadronic decay modes without leptons in the final state. In many cases, the measurements performed at the Tevatron Collider are complementary to the factories. For example, no mesons or baryons containing quarks are produced on the resonance.
hadrons not produced at the factories are the topics of this review. We discuss the spectroscopy of excited states (, ) and the observation of the baryon at the Tevatron. The second part of this review discusses the decays of hadrons and measurements of branching fractions. We focus on charmless two-body decays of . We end this article by summarizing our finding in the conclusions.
2 The Tevatron with the CDF & DO Experiments
The Fermilab accelerator complex has undergone a major upgrade in preparation for Tevatron Run II. The centre-of-mass energy has been increased to 1.96 TeV as compared to 1.8 TeV during Run I and the Main Injector, a new 150 GeV proton storage ring, has replaced the Main Ring as injector of protons and anti-protons into the Tevatron. The present bunch crossing time is 396 ns with a bunch operation. The luminous region of the Tevatron beam has an RMS of cm along the beamline (-direction) with a transverse beamwidth of about 25-30 m.
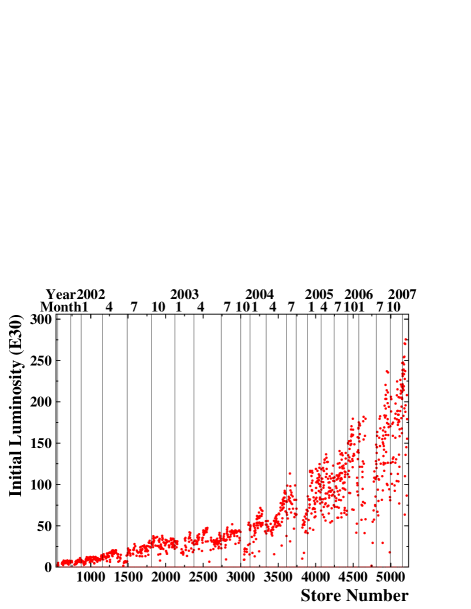
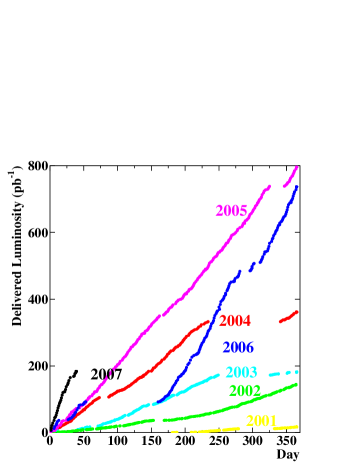
The initial Tevatron luminosity steadily increased from 2002 to 2006 as shown in Figure 1(a). By the end of 2006, the peak luminosity reached by the Tevatron is cm-2s-1. The increase in accelerator performance throughout Run II can also be seen by the delivered luminosity per calendar year as displayed in Figure 1(b). The total integrated luminosity delivered by the Tevatron to CDF and DO at the end of 2006 is fb-1 with about fb-1 recorded to tape by each the CDF and DO experiments. However, most results presented in this review use about 1 fb-1 of data.
The CDF detector improvements for Run II [4] were motivated by the shorter accelerator bunch spacing and the increase in luminosity by an order of magnitude. All front-end and trigger electronics has been significantly redesigned and replaced. A DAQ upgrade allows the operation of a pipelined trigger system. CDF’s tracking system was completely renewed for Run II. It consists of a Central Outer Tracker (COT) with 30 200 sense wires arranged in 96 layers, between 40 and 137 cm in radius, organized into eight alternating axial and stereo super-layers. The transverse momentum resolution is /(GeV/). The specific energy loss by ionization (dd) of charged particles in the COT is measured from the amount of charge collected by each wire. The Run II silicon vertex detector consists of seven double sided layers and one single sided layer mounted on the beam pipe covering a total radial area from 1.5-28 cm. The silicon vertex detector covers the full Tevatron luminous region and allows for standalone silicon tracking up to a pseudo-rapidity of 2. The forward calorimeters have been replaced by a new scintillator tile based plug calorimeter which gives good electron identification up to . The upgrades to the muon system almost double the central muon coverage and extend it up to . The most important improvements for physics in Run II are a Silicon Vertex Trigger (SVT) and a Time-of-Flight (ToF) system with a resolution of about 100 ps. The later employs 216 three-meter-long scintillator bars located between the outer radius of the COT and the superconducting solenoid. The Time-of-Flight system is most beneficiary for the identification of kaons with a 2 -separation between and for GeV.
The DO detector also went through a major upgrade before the beginning of Run II [5]. The inner tracking system was completely replaced and includes a new Silicon tracker surrounded by a Scintillating Fiber tracker, both of which are enclosed in a 2 Tesla solenoidal magnetic field. Pre-shower counters are located before the uranium/liquid-argon calorimeter to improve the electron and photon identification. The already excellent muon system has been further improved by adding more shielding to reduce beam background. The Run II DO detector has excellent tracking and lepton acceptance. Tracks with pseudo-rapidity as large as 2.5-3.0 () and transverse momentum as low as 180 MeV can be reconstructed. The muon system can identify muons within . The minimum of the reconstructed muons varies as a function of . In most of the results presented, muons were required to have GeV.
2.1 Triggers for Physics
The total inelastic cross section at the Tevatron is about three orders of magnitude larger than the quark production cross section. The CDF and DO trigger system is therefore the most important tool for finding decay products. In addition, the cross section for quark production is steeply falling. It drops by almost two orders of magnitude between a quark of about 8 GeV and 25 GeV. To find decay products in hadronic collisions, it is desirable to go as low as possible in the decay products transverse momentum, exploiting as much as possible of the steeply falling cross section. Of course, the limiting factor is the bandwidth of the experiment’s data acquisition system.
In Run I, all physics triggers at CDF and DO were based on leptons including single and dilepton triggers. In Run II, both experiments still exploit heavy flavour decays which have leptons in the final state. Identification of dimuon events down to very low momentum is possible, allowing for efficient triggers. As a consequence, both experiments are able to fully reconstruct decay modes involving ’s. Both experiments also use inclusive lepton triggers designed to accept semileptonic decays. DO has an inclusive muon trigger with excellent acceptance, allowing them to accumulate very large samples of semileptonic decays. The CDF semileptonic triggers require an additional displaced track associated with the lepton, providing cleaner samples with smaller yields.
In addition, the CDF detector has the ability to select events based upon track impact parameter. The Silicon Vertex Trigger gives CDF access to purely hadronic decays and makes CDF’s physics program fully competitive with the one at the factories. The hadronic track trigger is the first of its kind operating successfully at a hadron collider. It works as follows: With a fast track trigger at Level 1, CDF finds track pairs in the COT with GeV. At Level 2, these tracks are linked into the silicon vertex detector and cuts on the track impact parameter (e.g. m) are applied. The SVT track impact parameter resolution is about 50 m including a 33 m contribution from the transverse beam spreading. The original motivation for CDF’s hadronic track trigger was to select decays to be used for violation studies. With the different trigger strategies above, the Collider experiments are able to trigger and reconstruct large samples of heavy flavour hadrons.
3 Spectroscopy
3.1 Study of Orbitally Excited Mesons
The spectroscopy of excited meson states containing quarks is not well studied. Only the stable ground states , and and the excited state are established [6]. Quark models predict the existence of two wide ( and ) and two narrow ( and ) bound -states [7]. The wide states decay through an -wave and therefore have a large width of a couple of hundred MeV, which makes it difficult to distinguish such states from combinatoric background. The narrow states decay through a -wave () and thus should have a small width of around 1 MeV [8, 9]. Almost all previous observations [10, 11] of the narrow -states and have been made indirectly using inclusive or semi-exclusive decays which prevented the separation of both states and a precise measurement of their properties. In contrast, the masses, widths and decay branching fractions of these states are predicted with good precision by the theoretical models [8, 9].
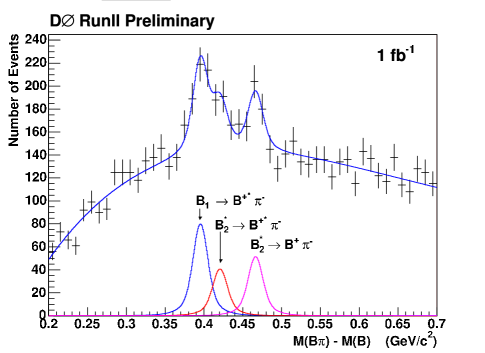
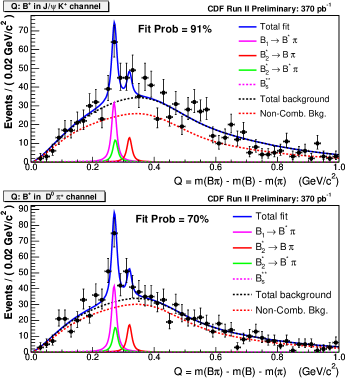
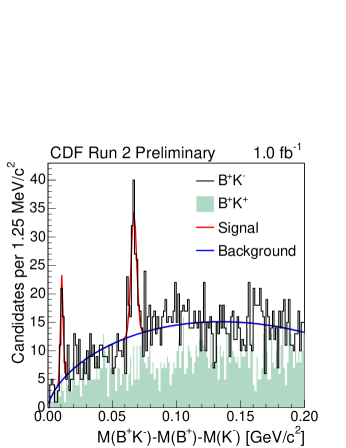
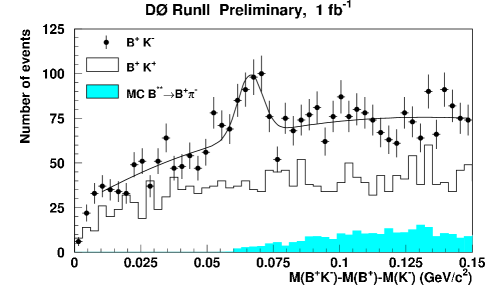
and candidates are reconstructed in the following decay modes: with and with as well as . In both cases the soft photon from the decay is not reconstructed resulting in a shift of about 46 MeV in the mass spectrum. DO reconstructs the candidates in the fully reconstructed mode with while CDF selects mesons in addition through the mode with . The CDF analysis is based on 360 pb-1 of data resulting in a signal of events and candidates in the channel. The DO measurement employs 1 fb-1 of Run II data and finds a signal peak of events attributed to the decay .
DO presents their measured mass distribution as as shown in Figure 2(a), while CDF plots as displayed in Fig. 2(b) and (c). Clear signals for the narrow excited states are observed: CDF reconstructs events in and events in the channel while DO observes a total of candidates for the narrow states. The measured masses are reported as MeV and MeV from DO, while CDF quotes MeV and MeV. Clearly these preliminary results are not in good agreement. CDF currently works on an update of their analysis using 1 fb-1 of data.
3.2 Observation of Orbitally Excited Mesons
The properties of excited meson states and the comparison with properties of excited states in the and systems provide good tests of various models of quark bound states. These models [7, 8, 12] predict the existence of two wide resonances ( and ) and two narrow ( and ) bound -states. The wide states decay through an -wave and therefore have a large width of a couple of hundred MeV. This makes it difficult to distinguish such states from combinatoric background. The narrow states decay through a -wave () and therefore should have a small width of around 10 MeV [9]. If the mass of the is large enough, then the main decay channel should be as the decay mode is not allowed by isospin conservation. Previous observations [10] of the narrow -states have been made indirectly preventing the separation of both states.
and candidates are reconstructed in the following decay modes: with and with as well as . In both cases the soft photon from the decay is not reconstructed resulting in a shift in the mass spectrum. DO reconstructs the candidates in the fully reconstructed mode with while CDF selects mesons in addition through the mode with . The CDF and DO measurements are each based on 1 fb-1 of Run II data. The CDF analysis finds events and candidates in the channel. DO uses a signal of events from the decay . Both experiments present their measured mass distribution in the quantity as displayed in Figure 3(a) and (b).
A clear signal at MeV is observed by CDF and DO (see Fig. 3), which is interpreted as the state. CDF reconstructs events in the peak at while DO reports events at . In addition, CDF observes events in a peak at which is interpreted as first evidence for the state. The measured masses are reported as MeV from DO, while CDF quotes MeV and MeV. The results from CDF and DO are in good agreement.
3.3 Observation of Baryons
Until recently only one bottom baryon, the , has been directly observed. At present the CDF collaboration has accumulated the world’s largest data sample of bottom baryons, due to a combination of two factors – the CDF displaced track trigger, and the of integrated luminosity delivered by the Tevatron. Using a sample of fully reconstructed candidates collected with the displaced track trigger, CDF searched for the decay .
The QCD treatment of quark-quark interactions significantly simplifies if one of the participating quarks is much heavier than the QCD confinement scale . In the limit of , where is the mass of the heavy quark, the angular momentum and flavour of the light quark become good quantum numbers. This approach, known as Heavy Quark Effective Theory (HQET), thus views a baryon made out of one heavy quark and two light quarks as consisting of a heavy static color field surrounded by a cloud corresponding to the light diquark system. In SU(3) the two quarks are in diquark form and according to the decomposition , leading to a generic scheme of baryon classification. Diquark states containing quarks in an antisymmetric flavour configuration, , are called -type whereas states with diquarks containing quarks in a flavour symmetric state, , are called -type.
In the -type ground state the light diquark system has isospin and . Together with the heavy quark this leads to a doublet of baryons with () and (). The ground state -type baryons decay strongly to -type baryons by emitting pions. In the limit , the spin doublet would be exactly degenerate since an infinitely heavy quark does not have a spin interaction with a light diquark system. As the heavy quark is not infinitely massive, there will be a small mass splitting between the doublet states and there is an additional isospin splitting between the and states [13]. There exist a number of predictions for the masses and isospin splittings of these states using HQET, non-relativistic and relativistic potential models, expansion, sum rules and lattice QCD. References [13, 14] contain some of the existing theoretical estimates, while Table 1 summarizes the range of predictions. The natural width of baryons is expected to be dominated by single pion transitions. Decays of the type are expected to have significantly smaller () partial widths than the single pion transition, and are thus negligible. The partial width of the -wave one-pion transition thus depends on the available phase space.
| property | Expected value [] |
|---|---|
| m() - m() | 180 - 210 |
| 10 - 40 | |
| 5 - 7 | |
| , | 8, 15 |
In analogy with the meson hadronization chain, in this analysis events are separated into “same charge” or SC and “opposite charge” or OC combinations. As the is neutral, the charge of the soft pion track determines the charge of the baryon, and there will be signals for both positive and negative pions. SC (OC) is defined as events where the pion has the same (opposite) charge as the pion from the decay. With these definitions, the SC distribution contains all and candidates while OC contains and .
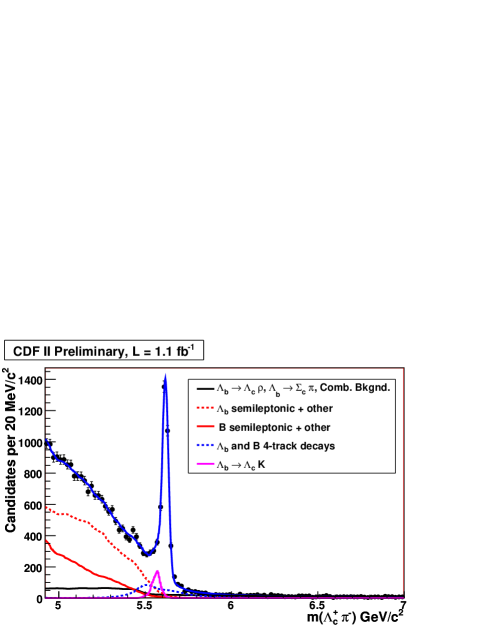
The present analysis is based on events collected by the CDF detector from 2002 through February 2006, with an integrated luminosity of . Events collected on the two track trigger are used to reconstruct the decay chain . CDF reconstructs a yield of approximately 2800 candidates in the signal region , with the mass plot shown in Figure 4.
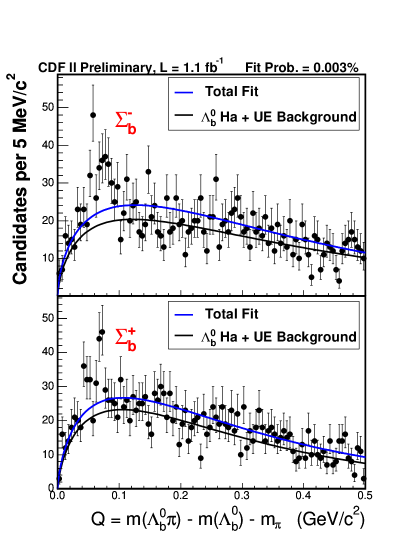
To separate out the resolution on the mass of each candidate, CDF searches for narrow resonances in the mass difference distribution of . Unless explicitly stated, refers to both the () and () states. There is no transverse momentum cut applied to the pion from the decay, since these tracks are expected to be very soft. In order to perform an unbiased search, the cuts for the reconstruction are optimized first with the signal region blinded. From theoretical predictions the signal region is chosen as , while the upper and lower sideband regions of and represent the background. The signal for the optimization is taken from a PYTHIA Monte Carlo sample, with the decays forced.
The backgrounds under the signal region in the mass distribution will also be present in the -distribution. The primary sources of background are hadronization and underlying event, hadronization and underlying event of other meson reflections and combinatorial background underneath the peak. The percentage of each background component in the signal region is derived from the mass fit, and is determined as 86% signal, 9% backgrounds and 5% combinatorial background. Other backgrounds (e.g. from 5-track decays where one track is taken as the candidate) are negligible, as confirmed in inclusive single--hadron Monte Carlo samples.
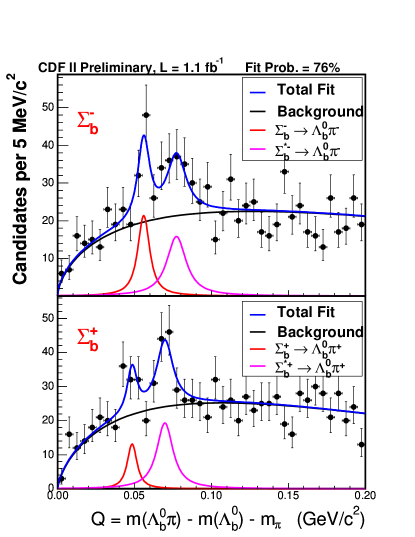
Upon unblinding the signal region, there is an excess observed in data over predicted backgrounds. The excess over background is shown in Table 2. CDF performs a simultaneous unbinned likelihood fit to SC and OC data. To the already described background components, four peaks are added, one for each of the expected states. Each peak is a sum of two Breit-Wigner shapes, each convoluted with two Gaussian resolution functions. The detector resolution has a dominant narrow core and a small broader shape describing the tails where the PDF for each peak takes both into account. Due to low statistics, CDF constrains and to be the same. The results of the fit are given in Tab. 3 and displayed in Fig. 5(a).
| Sample | Data events | Bkg events | Data excess over bkg |
|---|---|---|---|
| Same charge | 416 | 268 | 148 |
| Opposite charge | 406 | 298 | 108 |
| Parameter | Value | Parabolic Error | MINOS Errors |
|---|---|---|---|
| () | 48.4 | 2.02 | (+2.02, -2.29) |
| () | 55.9 | 0.963 | (+0.990, -0.959) |
| - () | 21.3 | 1.93 | (+2.03, -1. 94) |
| events | 29 | 12.0 | (+12.4, -11.6) |
| events | 60 | 14.3 | (+14.8, -13.8) |
| events | 74 | 16.8 | (+17.2, -16.3) |
| events | 74 | 17.8 | (+18.2, -17.4) |
| -ln(Likelihood) | -24553.5 | – | – |
All systematic uncertainties on the mass difference measurements are small compared to their statistical errors. The systematic errors from the tracking sources are determined by comparing the mean and the width of the peak in between data and Monte Carlo simulation split up in several regions of track . The largest discrepancy of the peak is which is taken as the systematic error for all four peaks. The discrepancy in the mass resolution could be as large as . The effect of a broader resolution is evaluated via a sample of Toy Monte Carlo experiments. The remaining systematics come from assumptions made in the fit to the data, such as the use of fixed background shapes. For the parameters associated with an individual systematic uncertainty, Toy MC samples are generated where these parameters are varied. The sample is then fit with both the default fit and the fit with varied parameters. The difference between fit parameter values in the varied fit and the default fit is caused by the systematic variation and constitutes the associated systematic error.
To evaluate the significance of the measurement, the null hypothesis is tested. The data is fit with no signal and with the standard fit using four peaks. Then the likelihood ratio is computed as , where is the four signal peak hypothesis and is the corresponding hypothesis with no peaks. The result of this fit is shown in Figure 5(b) and a likelihood ratio of is obtained indicating the observation of the states.
To summarize, the lowest lying charged resonant states are
observed in 1 fb-1 of data collected by the CDF detector. These are
consistent with the lowest lying charged baryons. The
values of and , and the - mass difference, are
measured to be:
- (stat)
(syst) MeV,
- (stat)
(syst) MeV,
- (stat) (syst) MeV.
Using the best CDF mass measurement for the mass, which is
(stat) (syst) MeV, the absolute mass
values and number of events are:
- (stat) (syst) MeV,
N( (stat) (syst),
- (stat) (syst) MeV,
N( (stat) (syst),
- (stat) (syst) MeV,
N( (stat) (syst),
- (stat) (syst) MeV,
N( (stat) (syst).
4 Decay of Hadrons
In this Section we focus on a new CDF result involving the branching fractions and time-integrated direct asymmetries for and decay modes into pairs of charmless charged hadrons .
4.1 Results from Charmless Two-Body Decays
The decay modes of mesons into pairs of charmless pseudo-scalar mesons are effective probes of the quark-mixing matrix (CKM) and sensitive to potential new physics effects. The large production rate of hadrons at the Tevatron allows measuring such decays in new modes, which are important to supplement our understanding of meson decays. The still unobserved decay mode could be used to measure the angle [15] of the CKM unitarity triangle and its asymmetry could be a powerful model-independent test of the source of direct violation in the meson system [16]. This may provide useful information to solve the current discrepancy between the asymmetries observed in the neutral and charged modes [17]. The and decay channels proceed only through annihilation diagrams, which are currently poorly known and constitute a source of significant uncertainty in many theoretical calculations [18, 19]. A measurement of both modes would allow a determination of the strength of penguin-annihilation diagrams [20].
4.1.1 Data Selection
CDF analysed a sample (integrated luminosity fb-1) of pairs of oppositely charged particles with GeV and GeV, used to form meson candidates. In addition, the trigger required a transverse opening-angle between the two tracks, to reject background from particle pairs within the same jet and from back-to-back jets. In addition, both charged particles are required to originate from a displaced vertex with a large impact parameter (100 m mm), while the meson candidate is required to be produced in the primary interaction ( m) and to have traveled a transverse distance m.
In the offline analysis, an unbiased optimization procedure determines a tightened selection on track-pairs fit to a common decay-vertex. CDF chooses selection cuts minimizing directly the expected uncertainty (through several pseudo-experiments) of the physics observables to be measured. CDF decided to use two different sets of cuts, optimizing separately the measurements of and (). For the latter, the sensitivity for discovery and limit setting [21] was optimized rather than the statistical uncertainty on the particular observational parameter, since this mode had not yet been observed. It is verified that the former set of cuts is also adequate to measure other decay rates of the larger yield modes (, ), while the latter, tighter set of cuts, is well suited to measure the decay rates and asymmetries related to the rare modes (, , , ).
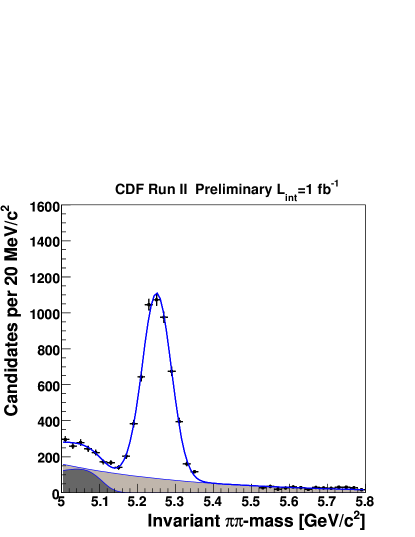
In addition to tightening the trigger cuts in the offline analysis, other discriminating variables such as the isolation of the meson and the information provided by the 3D reconstruction capability of the CDF tracking system are used, allowing a great improvement in the signal purity. Isolation is defined as , in which the sum runs over every other track within a cone of radius one in the space around the meson flight-direction. By requiring the background is reduced by a factor four while keeping almost 80% of the signal. The 3D silicon tracking allows to resolve multiple vertices along the beam direction and to reject fake tracks reducing the background by another factor of two, with small inefficiency on the signal. The resulting invariant mass distribution shown in Figure 6(a) display a clean signal of decays. In spite of a good mass resolution (), the various modes overlap into an unresolved mass peak.
4.1.2 Fit of Sample Composition
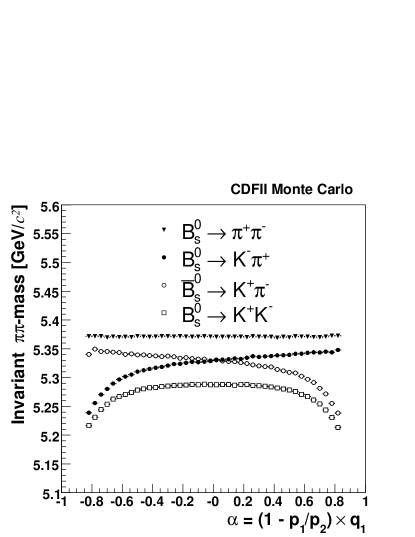
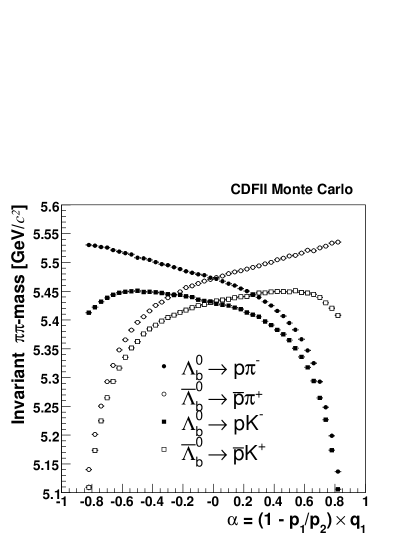
The resolution in invariant mass and in particle identification is not sufficient for separating individual decay modes on an event-by-event basis. Therefore CDF performs an unbinned maximum likelihood fit, combining kinematic and particle identification information, to statistically determine the contribution of each mode and the asymmetries. For the kinematic portion, CDF uses three loosely correlated observables to summarize the information carried by all possible values of invariant mass of the candidate, resulting in different mass assignments to the two outgoing particles. These are: (a) the mass calculated with the charged pion mass assignment to both particles, (b) the signed momentum imbalance , where () is the lower (higher) of the particle momenta, and is the sign of the charge of the particle of momentum , and (c) the scalar sum of the particle momenta . Using these three variables, the mass of any particular mode can be written as:
| (1) |
| (2) |
where () is the mass of the lower (higher) momentum particle. For simplicity Eq. (1) is written as a function of and instead of and but in the likelihood fit it is used as a function of and .
Particle identification (PID) information is summarized by a single observable for each track defined as
| (3) |
With the chosen observables, the likelihood contribution of the event is written as:
| (4) |
where:
| (5) |
| (6) |
| (7) |
| (8) |
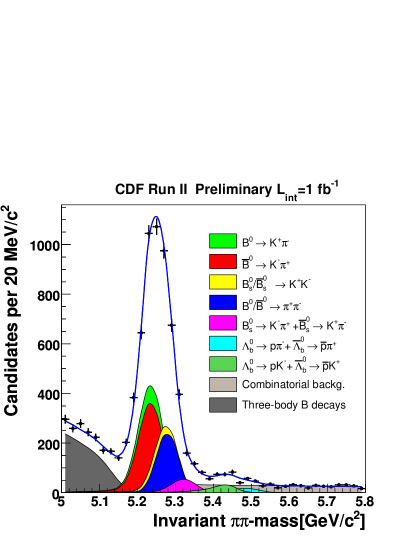
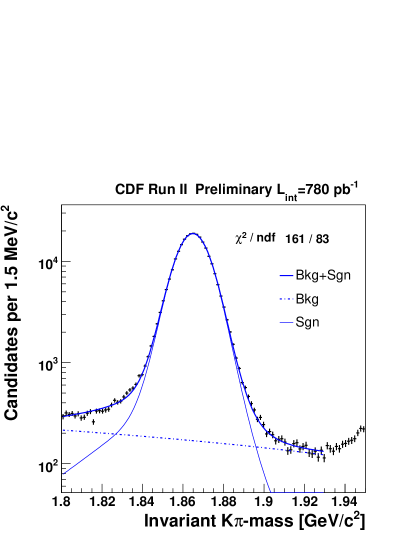
The index ‘’ labels the physical (combinatorial) background-related quantities, the index runs over the twelve distinguishable and modes (Fig. 7), and are their respective fractions, to be determined by the fit together with the total background fraction and with the fraction of the physical (combinatorial) background . The conditional probability density is the mass resolution function of each mode when the correct mass is assigned to both tracks. In fact, the average mass is the value of obtained from Eq. (1) by setting the appropriate particle masses for each decay mode . Making a simple variable change, is obtained where is the invariant mass computed with the correct mass assignment to both particles for each mode . is parameterized using the detailed detector simulation [22]. To take into account non-Gaussian tails due to the emission of photons in the final state, CDF includes in the simulation soft photon emission of particles in agreement with recent QED calculations [23]. CDF checks the quality of the mass resolution model using about 500K decays as shown in Figure 8(a). The mass line-shape of the peak is fitted fixing the signal shape from the model, only allowing to vary the background function. CDF obtains good agreement between data and simulation. In Eq. (5) the nominal , and masses as measured by CDF [24] are used in order to cancel common systematic uncertainties. The background mass distribution is determined in the fit by varying the parameters , and in Eq. (6,7). The probability is the joint probability distribution of and is parameterized for each mode by a product of polynomial and exponential functions fitted to Monte Carlo samples produced by a detailed detector simulation [22]. The background function is obtained from the mass sidebands of the data.
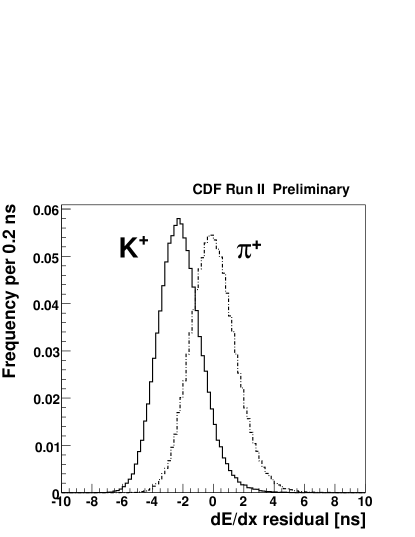
A sample of 1.5M decays, where the decay products are identified by the charge of the pion, was used to calibrate the dd response over time and over the entire tracking volume, and to determine the functions in Eq. (8). Using a pure sample, CDF obtains a separation between kaons and pions as shown in Fig. 8(b), corresponding to an uncertainty on the measured fraction of each class of particles that is just 60% worse than the uncertainty attainable with ideal separation. The background term in Eq. (8) is similar to the signal terms, but allows for independent pion, kaon, proton, and electron components, which are free to vary independently. Muons are indistinguishable from pions with the available dd resolution.
4.1.3 Fit Results
CDF performs two separate fits. The first one uses the cuts optimized to measure the direct and the second one is optimized to measure (). Significant signals are seen for the , , and modes, previously observed by CDF [25]. Three new rare modes are observed for the first time: , and , while no evidence is obtained for the and decay channels.
To convert the yields returned from the fit into relative branching fractions, CDF applies corrections for efficiencies of trigger and offline selection requirements for the different decay modes. The relative efficiency corrections between various modes do not exceed 20%. Most corrections are determined from the detailed detector simulation [22], with some exceptions which are measured using data. A momentum-averaged relative isolation efficiency between and mesons of is determined from fully-reconstructed samples of , , , and . The lower specific ionization of kaons with respect to pions in the drift chamber is responsible for a % lower efficiency to reconstruct a kaon. This effect is measured in a sample of decays triggered with the two track trigger, using the unbiased third track. The only correction needed by the direct asymmetries and is a shift due to the different probability for and to interact with the tracker material. This correction uses a sample of 1M prompt decays reconstructed and selected with the same criteria as the decays. Assuming the Standard Model expectation , the difference between the number of reconstructed decays and provides a measurement of the detector-induced asymmetry between and final states. Since CDF uses the same fit technique developed for the decays, this measurement provides also a robust check on all possible charge asymmetry biases of the detector and dd parameterizations.
The and modes require a special treatment, since they contain a superposition of the flavour eigenstates of the meson. Their time evolution might differ from the one of the flavour-specific modes if the width difference between the mass eigenstates is significant. The current result is derived under the assumption that both modes are dominated by the short-lived component, that means , and [26, 27]. The latter uncertainty is included in estimating the overall systematic uncertainty.
The dominant contributions to the systematic uncertainty are as follows. The statistical uncertainty on the isolation efficiency ( modes), the uncertainty on the dd calibration and parameterization and the uncertainty of the combinatorial background model. The first one is the larger systematics of all measurements with the meson in the initial state except for . This uncertainty is preliminary and conservative, a significant improvement is expected for the final results. The second one, due to dd, is a large systematics of all measurements, although the parameterization of the specific ionization is very accurate. The fit of the sample composition is very sensitive to the PID information. The third systematic error is due to the statistical uncertainty of the possible combinatorial background models and it is a dominant systematics for the observables of the rare modes. Smaller systematic uncertainties are assigned for the trigger efficiencies, physical background shapes and kinematics, and the meson masses and lifetimes.
| Mode | Nsignal | Quantity | Measurement | [] |
|---|---|---|---|---|
| ( @ 90% CL) | ||||
| ( @ 90% CL) | ||||
The measured relative branching fractions are listed in Table 4, where and indicate the respective production fractions of and mesons from the fragmentation of quarks in collisions. An upper limit is also quoted for modes in which no significant signal is observed [28]. The absolute branching fraction results listed are obtained by normalizing the data to the world-average of () [17].
CDF reports the first observation of three new rare charmless decays , and with a significance respectively of , and . The significance includes both statistical and systematic uncertainty. The statistical uncertainty to evaluate the significance is estimated using several pseudo-experiments with no contributions from rare signals.
The rate of the newly observed mode is in agreement with the latest theoretical expectation [29] which is lower than previous predictions [18, 30]. CDF measures for the first time in the meson system the direct asymmetry . This value favors a large violation in mesons, on the other hand it is also compatible with zero. Ref. [16] suggests a robust test of Standard Model expectations versus new physics comparing the direct asymmetries in the and decay modes. Using HFAG input [17], CDF measures (where is the decay width) in agreement with the Standard Model expectation of one. Assuming that the relationship above yields one and using as input the branching fraction () measured in this analysis, the world average for and the () [17], the expected value for is estimated in agreement with the CDF measurement.
The rate of the mode is in agreement with the latest theoretical expectation [31, 32] and with the previous CDF measurement [25]. An improved systematic uncertainty is expected for the final analysis of the same sample. The results for the meson are in agreement with world average values [17]. The measurement is the world’s second best measurement and the significance of the new world average moved from 6 to 7. CDF updates the upper limits and quotes also the absolute branching fractions of the currently unobserved annihilation-type modes: and . The rate has the same uncertainty as the current measurements [17], while the upper limit (already the world’s best limit [25]) is improved by a factor of 1.3, approaching the expectations from recent calculations [19, 33]. CDF also reports the first observation of two new baryon charmless modes and , and measures in agreement with expectations from Ref. [34].
5 Summary
We review recent result on heavy quark physics focusing on Run II measurements of hadron spectroscopy and decay at the Tevatron. A wealth of new physics measurements from CDF and DO has been available. These include the spectroscopy of excited states (, ) and the observation of the baryon. The discussion of the decays of hadrons and measurements of branching fractions focuses on charmless two-body decays of . We report several new and decay channels.
Acknowledgments
I would like to thank the organizers of this stimulating meeting for an excellent conference. I also thank my colleagues from the CDF and DO collaboration for their help in preparing this talk as well as these proceedings. I also would like to thank Ann, Emma and Helen, a constant source of inspiration and support, for their continuous understanding about the life of a traveling particle physicist. This work was supported in part by the U.S. Department of Energy under Grant No. DE-FG02-91ER40682.
References
- [1] N. Ellis and A. Kernan, Phys. Rept. 195 (1990) 23.
- [2] F. Abe et al. [CDF Collaboration], Phys. Rev. Lett. 68 (1992) 3403.
- [3] M. Paulini, Int. J. Mod. Phys. A 14 (1999) 2791 [arXiv:hep-ex/9903002].
- [4] D. Acosta et al. [CDF Collaboration], Phys. Rev. D 71 (2005) 032001 [arXiv:hep-ex/0412071].
- [5] V. M. Abazov et al. [D0 Collaboration], Nucl. Instrum. Meth. A 565 (2006) 463 [arXiv:physics/0507191].
- [6] W. M. Yao et al. [Particle Data Group], J. Phys. G 33 (2006) 1.
- [7] E. J. Eichten, C. T. Hill and C. Quigg, Phys. Rev. Lett. 71 (1993) 4116 [arXiv:hep-ph/9308337].
- [8] D. Ebert, V. O. Galkin and R. N. Faustov, Phys. Rev. D 57, 5663 (1998) [Erratum-ibid. D 59, 019902 (1999)] [arXiv:hep-ph/9712318].
- [9] N. Isgur, Phys. Rev. D 57 (1998) 4041. M. Di Pierro and E. Eichten, Phys. Rev. D 64 (2001) 114004 [arXiv:hep-ph/0104208].
- [10] R. Akers et al. [OPAL Collaboration], Z. Phys. C 66 (1995) 19.
- [11] P. Abreu et al. [DELPHI Collaboration], Phys. Lett. B 345 (1995) 598. D. Buskulic et al. [ALEPH Collaboration], Z. Phys. C 69 (1996) 393. R. Barate et al. [ALEPH Collaboration], Phys. Lett. B 425 (1998) 215. A. A. Affolder et al. [CDF Collaboration], Phys. Rev. D 64 (2001) 072002.
- [12] A. F. Falk and T. Mehen, Phys. Rev. D 53 (1996) 231 [arXiv:hep-ph/9507311].
- [13] J. L. Rosner, Phys. Rev. D 75 (2007) 013009 [arXiv:hep-ph/0611207].
- [14] D. P. Stanley and D. Robson, Phys. Rev. Lett. 45, 235 (1980). D. P. Stanley and D. Robson, Phys. Rev. D 21, 3180 (1980). J. L. Basdevant and S. Boukraa, Z. Phys. C 30 (1986) 103. A. Martin and J. M. Richard, Phys. Lett. B 185, 426 (1987). W. Y. P. Hwang and D. B. Lichtenberg, Phys. Rev. D 35 (1987) 3526. W. Kwong, J. L. Rosner and C. Quigg, Ann. Rev. Nucl. Part. Sci. 37, 325 (1987). J. G. Korner, M. Kramer and D. Pirjol, Prog. Part. Nucl. Phys. 33 (1994) 787 [arXiv:hep-ph/9406359]. K. C. Bowler et al. [UKQCD Collaboration], Phys. Rev. D 54, 3619 (1996) [arXiv:hep-lat/9601022]. E. Jenkins, Phys. Rev. D 54, 4515 (1996) [arXiv:hep-ph/9603449]. N. Mathur, R. Lewis and R. M. Woloshyn, Phys. Rev. D 66, 014502 (2002) [arXiv:hep-ph/0203253]. C. Albertus, J. E. Amaro, E. Hernandez and J. Nieves, Nucl. Phys. A 740, 333 (2004) [arXiv:nucl-th/0311100]. D. Ebert, R. N. Faustov and V. O. Galkin, Phys. Rev. D 72, 034026 (2005) [arXiv:hep-ph/0504112].
- [15] M. Gronau and J. L. Rosner, Phys. Lett. B 482 (2000) 71 [arXiv:hep-ph/0003119].
- [16] H. J. Lipkin, Phys. Lett. B 621 (2005) 126 [arXiv:hep-ph/0503022].
- [17] E. Barberio et al. [Heavy Flavor Averaging Group (HFAG)], arXiv:hep-ex/0603003.
- [18] M. Beneke and M. Neubert, Nucl. Phys. B 675 (2003) 333 [arXiv:hep-ph/0308039].
- [19] Y. D. Yang, F. Su, G. R. Lu and H. J. Hao, Eur. Phys. J. C 44 (2005) 243 [arXiv:hep-ph/0507326].
- [20] A. J. Buras, R. Fleischer, S. Recksiegel and F. Schwab, Nucl. Phys. B 697 (2004) 133 [arXiv:hep-ph/0402112].
- [21] G. Punzi, In the Proceedings of PHYSTAT2003: Statistical Problems in Particle Physics, Astrophysics, and Cosmology, Menlo Park, California, 8-11 Sep 2003, pp MODT002 [arXiv:physics/0308063].
- [22] E. Gerchtein and M. Paulini, Proceedings of 2003 Conference for Computing in High-Energy and Nuclear Physics (CHEP 03), La Jolla, California, 24-28 Mar 2003, pp TUMT005 [arXiv:physics/0306031].
- [23] E. Baracchini and G. Isidori, Phys. Lett. B 633 (2006) 309 [arXiv:hep-ph/0508071].
- [24] D. Acosta et al. [CDF Collaboration], Phys. Rev. Lett. 96 (2006) 202001 [arXiv:hep-ex/0508022].
- [25] A. Abulencia et al. [CDF Collaboration], Phys. Rev. Lett. 97 (2006) 211802 [arXiv:hep-ex/0607021].
- [26] M. Beneke, G. Buchalla, C. Greub, A. Lenz and U. Nierste, Phys. Lett. B 459 (1999) 631 [arXiv:hep-ph/9808385].
- [27] A. Lenz, arXiv:hep-ph/0412007.
- [28] G. J. Feldman and R. D. Cousins, Phys. Rev. D 57 (1998) 3873 [arXiv:physics/9711021].
- [29] A. R. Williamson and J. Zupan, Phys. Rev. D 74 (2006) 014003 [Erratum-ibid. D 74 (2006) 03901] [arXiv:hep-ph/0601214].
- [30] X. Q. Yu, Y. Li and C. D. Lu, Phys. Rev. D 71 (2005) 074026 [Erratum-ibid. D 72 (2005) 119903] [arXiv:hep-ph/0501152].
- [31] S. Descotes-Genon, J. Matias and J. Virto, Phys. Rev. Lett. 97 (2006) 061801 [arXiv:hep-ph/0603239].
- [32] S. Baek, D. London, J. Matias and J. Virto, JHEP 0612 (2006) 019 [arXiv:hep-ph/0610109].
- [33] Y. Li, C. D. Lu, Z. J. Xiao and X. Q. Yu, Phys. Rev. D 70 (2004) 034009 [arXiv:hep-ph/0404028].
- [34] R. Mohanta, A. K. Giri and M. P. Khanna, Phys. Rev. D 63 (2001) 074001 [arXiv:hep-ph/0006109].