EUROPEAN ORGANIZATION FOR NUCLEAR RESEARCH
CERN-PH-EP/2007-002
13 February 2007
Measurement of the Dalitz plot slope parameters of the decay
The NA48/2 Collaboration
J.R. Batley,
A.J. Culling,
G. Kalmus,
C. Lazzeroni,
D.J. Munday,
M.W. Slater,
S.A. Wotton
Cavendish Laboratory, University of Cambridge, Cambridge, CB3 0HE, U.K. 111Funded by the U.K. Particle Physics and Astronomy Research Council
R. Arcidiacono, G. Bocquet, N. Cabibbo, A. Ceccucci, D. Cundy 222Present address: Istituto di Cosmogeofisica del CNR di Torino, I-10133 Torino, Italy, V. Falaleev, M. Fidecaro, L. Gatignon, A. Gonidec, W. Kubischta, A. Norton, A. Maier, M. Patel, A. Peters
CERN, CH-1211 Genève 23, Switzerland
S. Balev, P.L. Frabetti, E. Goudzovski 333Present address: Scuola Normale Superiore, I-56100 Pisa, Italy, P. Hristov 444Present address: CERN, CH-1211 Genève 23, Switzerland, V. Kekelidze, V. Kozhuharov, L. Litov, D. Madigozhin, E. Marinova, N. Molokanova, I. Polenkevich, Yu. Potrebenikov, S. Stoynev, A. Zinchenko
Joint Institute for Nuclear Research, 141980 Dubna, Russian Federation
E. Monnier 555Also at Centre de Physique des Particules de Marseille, IN2P3-CNRS, Université de la Méditerranée, Marseille, France, E. Swallow, R. Winston
The Enrico Fermi Institute, The University of Chicago, Chicago,
Illinois, 60126, U.S.A.
P. Rubin,
A. Walker
Department of Physics and Astronomy, University of Edinburgh, JCMB King’s Buildings, Mayfield Road, Edinburgh, EH9 3JZ, U.K.
W. Baldini, A. Cotta Ramusino, P. Dalpiaz, C. Damiani, M. Fiorini, A. Gianoli, M. Martini, F. Petrucci, M. Savrié, M. Scarpa, H. Wahl
Dipartimento di Fisica dell’Università e Sezione dell’INFN di Ferrara, I-44100 Ferrara, Italy
A. Bizzeti 666Also Istituto di Fisica, Università di Modena, I-41100 Modena, Italy, M. Calvetti, E. Celeghini, E. Iacopini, M. Lenti, F. Martelli 777Istituto di Fisica, Università di Urbino, I-61029 Urbino, Italy, G. Ruggiero 444Present address: CERN, CH-1211 Genève 23, Switzerland, M. Veltri 777Istituto di Fisica, Università di Urbino, I-61029 Urbino, Italy
Dipartimento di Fisica dell’Università e Sezione dell’INFN di Firenze, I-50125 Firenze, Italy
M. Behler, K. Eppard, K. Kleinknecht, P. Marouelli, L. Masetti, U. Moosbrugger, C. Morales Morales, B. Renk, M. Wache, R. Wanke, A. Winhart
Institut für Physik, Universität Mainz, D-55099 Mainz, Germany 888Funded by the German Federal Minister for Education and research under contract 05HK1UM1/1
D. Coward 999Permanent address: SLAC, Stanford University, Menlo Park, CA 94025, U.S.A., A. Dabrowski, T. Fonseca Martin 444Present address: CERN, CH-1211 Genève 23, Switzerland, M. Shieh, M. Szleper, M. Velasco, M.D. Wood 101010Present address: UCLA, Los Angeles, CA 90024, U.S.A.
Department of Physics and Astronomy, Northwestern
University, Evanston Illinois 60208-3112, U.S.A.
G. Anzivino,
P. Cenci,
E. Imbergamo,
A. Nappi,
M. Pepe,
M.C. Petrucci,
M. Piccini,
M. Raggi,
M. Valdata-Nappi
Dipartimento di Fisica dell’Università e Sezione dell’INFN di Perugia, I-06100 Perugia, Italy
C. Cerri, G. Collazuol, F. Costantini, L. DiLella, N. Doble, R. Fantechi, L. Fiorini, S. Giudici, G. Lamanna, I. Mannelli, A. Michetti, G. Pierazzini, M. Sozzi
Dipartimento di Fisica dell’Università, Scuola Normale Superiore e Sezione dell’INFN di Pisa, I-56100 Pisa, Italy
B. Bloch-Devaux, C. Cheshkov 444Present address: CERN, CH-1211 Genève 23, Switzerland, J.B. Chèze, M. De Beer, J. Derré, G. Marel, E. Mazzucato, B. Peyaud, B. Vallage
DSM/DAPNIA - CEA Saclay, F-91191 Gif-sur-Yvette, France
M. Holder, M. Ziolkowski
Fachbereich Physik, Universität Siegen, D-57068 Siegen, Germany 111111Funded by the German Federal Minister for Research and Technology (BMBF) under contract 056SI74
S. Bifani, C. Biino, N. Cartiglia, M. Clemencic 444Present address: CERN, CH-1211 Genève 23, Switzerland, S. Goy Lopez, F. Marchetto
Dipartimento di Fisica Sperimentale dell’Università e Sezione dell’INFN di Torino, I-10125 Torino, Italy
H. Dibon, M. Jeitler, M. Markytan, I. Mikulec, G. Neuhofer, L. Widhalm
Österreichische Akademie der Wissenschaften, Institut für Hochenergiephysik, A-10560 Wien, Austria 121212Funded by the Austrian Ministry for Traffic and Research under the contract GZ 616.360/2-IV GZ 616.363/2-VIII, and by the Fonds für Wissenschaft und Forschung FWF Nr. P08929-PHY
Submitted to Physics Letters B.
Abstract
The distribution of the decays in the Dalitz plot has been measured by the NA48/2 experiment at the CERN SPS with a sample of fully reconstructed events. With the standard Particle Data Group parameterization the following values of the slope parameters were obtained: , , . The quality and statistical accuracy of the data have allowed an improvement in precision by more than an order of magnitude, and are such as to warrant a more elaborate theoretical treatment, including pion-pion rescattering, which is in preparation.
Introduction
The decay can be described [1] in terms of the Lorentz invariant kinematic variables and defined as
| (1) |
Here is the charged pion mass, is the charged kaon mass, are the pion four-momenta, the indices correspond to the two pions of the same electric charge (“even” pions), and the index to the other (“odd”) pion. The experimental Dalitz plot distribution of the decay has been up to now experimentally analyzed [2, 3] in terms of a polynomial expansion in powers of and :
| (2) |
Here , , are the linear and quadratic slope parameters (terms proportional to odd powers of are forbidden by Bose symmetry, and the variable is defined only up to a sign), and is the Coulomb factor [4]:
| (3) |
where are the pion charges, is the fine structure constant, and is the relative velocity of the pions and , expressed via the squared invariant mass of the pion pair as
| (4) |
Among the measurements of the slope parameters performed in the past, the most precise are reported in [2] based on decays, and in [3] based on decays.
The primary goal of the NA48/2 experiment at CERN SPS is the search for direct CP-violating charge asymmetries of Dalitz plot linear slopes in [5] and [6] decays. However, the large data sample collected also allows a study of the Dalitz plot distributions to be performed at a new level of precision, estimating the detector acceptance with a detailed Monte Carlo (MC) simulation.
The parameterization (2) of the decay distribution takes into account electromagnetic interactions only in the first approximation [4] and totally neglects pion rescattering effects [7]–[10], which were recently shown by NA48/2 to contribute significantly to the distribution of decays [11]. The current study aims to measure the Dalitz plot slopes within the conventional framework (2), and represents a first step towards a more complete description of the decay distribution. In particular, the presence of radiative effects and strong final state interactions, both ignored in the current work, imply that the slope parameters obtained, while fully comparable to those defined in the Particle Data Group compilation [1], should not be attributed any precise physical significance as far as the parameterization of the weak decay in terms of more fundamental parameters is concerned; this would require an improved theoretical framework which is just being developed [8], and its implementation is postponed for a forthcoming analysis.
NA48/2 collected data during two runs in 2003 and 2004, with about 50 days of efficient data-taking in each run. This analysis is based on fully reconstructed events, corresponding to 55% of the data sample collected during the NA48/2 run of 2003.
1 Beams and detectors
A beam line providing two simultaneous charged beams of opposite signs overlapping in space all along the decay volume was designed and built in the high intensity hall (ECN3) at the CERN SPS. The beam line is a key element of the experiment, as it allows decays of and to be recorded at the same time, and therefore leads to cancellation of several systematic uncertainties for the charge asymmetry measurement. Regular alternation of magnetic fields in all the beam line elements was adopted. The layout of the beams and detectors is shown schematically in Fig. 1. The setup is described in a right-handed orthogonal coordinate system with the axis directed downstream along the beam, and the axis directed vertically up.
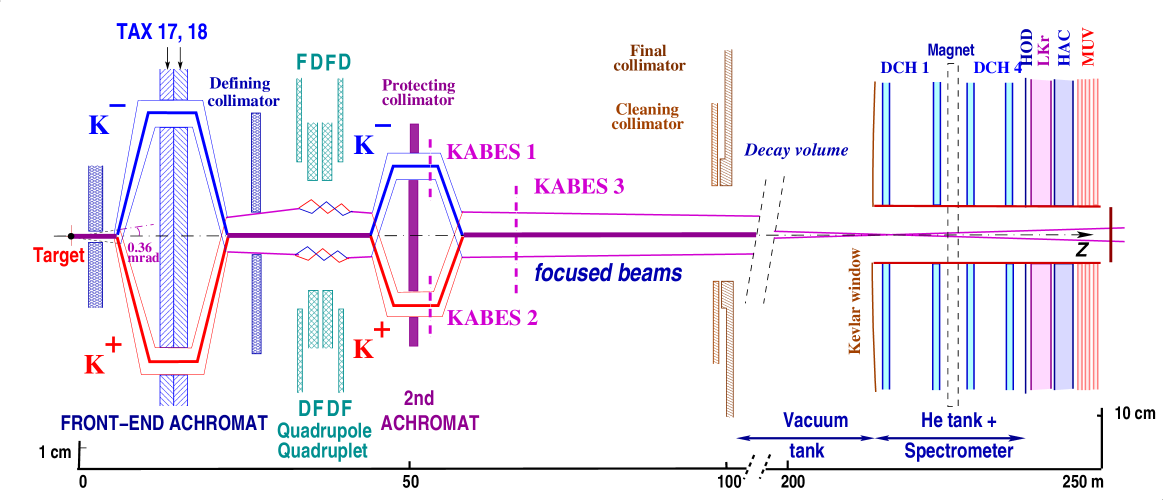
The beams are produced by 400 GeV/ protons impinging at zero incidence angle on a beryllium target of 40 cm length and 2 mm diameter. Charged particles with momentum GeV/ are selected in a charge-symmetric way by an achromatic system of four dipole magnets with zero total deflection (‘achromat’), which splits the two beams in the vertical plane and then recombines them on a common axis. Then the beams pass through a defining collimator and a series of four quadrupoles designed to produce focusing of the beams towards the detector. Finally the two beams are again split in the vertical plane and recombined in a second achromat, where three stations of a Micromega-type [12] detector form a kaon beam spectrometer [13] (not used in the present analysis).
After passing the cleaning and the final collimators, the beams enter the decay volume housed in a 114 m long cylindrical vacuum tank with a diameter of 1.92 m for the first 65 m, and 2.4 m for the rest. Both beams follow the same path in the decay volume: their axes coincide within 1 mm, while the transverse size of the beams is about 1 cm. With protons incident on the target per burst of s duration, the positive (negative) beam flux at the entrance of the decay volume is () particles per pulse, of which () are (). The flux ratio is about . The fraction of beam kaons decaying in the decay volume at nominal momentum is .
The decay volume is followed by a magnetic spectrometer used for reconstructing decays. The spectrometer is housed in a tank filled with helium at nearly atmospheric pressure, separated from the vacuum tank by a thin () Kevlar composite window. A thin-walled aluminium beam pipe of 16 cm outer diameter traversing the centre of the spectrometer (and all the following detectors) allows the undecayed beam particles and the muon halo from decays of beam pions to continue their path in vacuum. The spectrometer consists of four drift chambers (DCH): DCH1, DCH2 located upstream, and DCH3, DCH4 downstream of a dipole magnet. The magnet has a field integral Tm, thus providing a horizontal transverse momentum kick for charged particles. The DCHs have the shape of a regular octagon with a transverse size of about 2.8 m and a fiducial area of about 4.5 m2. Each chamber is composed of eight planes of sense wires arranged in four pairs of staggered planes oriented horizontally, vertically, and along each of the two orthogonal directions. The spatial resolution of each DCH is m. The nominal momentum resolution of the magnetic spectrometer is parameterized as ( expressed in GeV/). The measured resolution on the reconstructed invariant mass varied during the running period corresponding to the considered data sample in the range of MeV/, depending on DCH performance.
The magnetic spectrometer is followed by a plastic scintillator hodoscope (HOD) used to produce fast trigger signals and to provide precise time measurements of charged particles. The hodoscope has a regular octagonal shape with a transverse size of about 2.4 m. It consists of a plane of horizontal and a plane of vertical strip-shaped counters. Each plane consists of 64 counters arranged in four quadrants. Each quadrant is subdivided into 4 segments taking part in the trigger logic. Counter widths (lengths) vary from 6.5 cm (121 cm) for central counters to 9.9 cm (60 cm) for peripheral ones.
The hodoscope is followed by a liquid krypton electromagnetic calorimeter (LKr), a hadronic calorimeter (HAC) and a muon detector (MUV), all of which are not used in the present analysis. A detailed description of the components of the NA48 detector can be found elsewhere [14].
The events are triggered with a two-level system. At the first level (L1), the rate of kHz is reduced to kHz by requiring coincidences of hits in the two planes of the HOD in at least two of the 16 non-overlapping segments. The second level (L2) is based on a hardware system computing coordinates of hits from DCH drift times, and a farm of asynchronous microprocessors performing fast reconstruction of tracks and running a selection algorithm, which requires at least two tracks to originate in the decay volume with the closest distance of approach less than 5 cm. L1 triggers not satisfying this condition are examined further and accepted nevertheless if there is a reconstructed track which is not kinematically compatible with a decay of a having momentum of 60 GeV/ directed along the beam axis. The resulting trigger rate is about 10 kHz.
2 Data analysis
Reconstruction and selection
Event reconstruction is based entirely on the magnetic spectrometer information. Tracks are reconstructed from hits in DCHs using the measured magnetic field map rescaled according to the recorded value of electric current in the spectrometer analyzing magnet. Three-track vertices, compatible with a decay, are reconstructed by extrapolation of track segments from the upstream part of the spectrometer back into the decay volume, taking into account the stray magnetic fields due to the Earth’s field and parasitic magnetization of the vacuum tank, and multiple scattering in the Kevlar window. The stray field correction is based on a three-dimensional field map measured in the entire vacuum tank, and reduces the amplitude of the observed sinusoidal variation of the reconstructed invariant mass on the azimuthal orientation of the odd pion by more than an order of magnitude to a level below 0.05 MeV/. The event kinematics is calculated using measured momenta and track directions extrapolated to the decay vertex.
The principal selection criteria applied to the reconstructed variables are the following:
-
•
Total charge of the three pion candidates: ;
-
•
Transverse momentum: GeV/;
-
•
Longitudinal vertex position within the decay volume: ;
-
•
Transverse vertex radius within the beam area: cm;
-
•
Kaon momentum within the nominal range: .
To improve the resolution on the kinematic variables, and to reduce the impact of differences between data and MC resolutions, the events were passed through a kinematic fitting procedure with three constraints (constraining the initial kaon direction to by along the axis, and the invariant mass to the kaon mass). Events with the quality of the kinematic fit corresponding to probability were rejected. The fraction of these rejected events increases as a function of deviation of the reconstructed mass from the PDG kaon mass ; in particular, all the events with MeV/ are outside the signal region, i.e. rejected by the above condition.
The geometric acceptance for the decays is mainly determined by the beam pipe traversing the centres of the DCHs, and the material in the central region of each DCH where central DCH wires terminate. This material defines a region of high DCH inefficiency111The acceptance is not biased by the finite outer size of the DCHs due to a relatively small -value of the decay: MeV.. This inefficiency together with beam optics performance and variations influences the acceptance, and is difficult to reproduce accurately with a MC simulation. To minimize the effects of this problem, it is required that the transverse positions of each pion in DCH1 and DCH4 planes () satisfy the condition cm, where is the position of the momentum-weighted average of the three pions’ impact points: (for DCH4 plane, trajectories of pions are linearly extrapolated from DCH1 and DCH2 planes). corresponds to the transverse position of the line of flight of the initial kaon. The value of 18 cm was chosen to exclude safely the inefficient central region taking into account the beam sizes and variations of their average transverse positions. The described selection criterion costs about of the statistics; however an appropriate MC description of the experimental conditions is more important than the sample size for the present analysis222In a different case, the charge asymmetry analysis [5] is performed with soft cuts maximizing the selected data sample, and is based on cancellation, rather than simulation, of the systematic effects.. As will be shown below in the discussion leading to the results presented in Fig. 3, the MC simulation of the experimental conditions reproduces the data distributions to a level of a few parts per mille.
The selection leaves a sample of events, which is practically background free, as is by far the dominant decay mode of the charged kaon with more than one charged particle in the final state. The fact that backgrounds due to other decays of beam kaons and pions are negligible was also checked with a MC simulation.
The distribution of the reconstructed invariant mass of data events (before the kinematic fitting) and its comparison with MC are presented in Fig. 2a. The non-Gaussian tails of the mass distribution are primarily due to decays in flight, and are well understood in terms of MC simulation. The ratio of MC to data mass spectra is presented in Fig. 2b. It demonstrates the imperfection of resolution description in MC, and a deficit of MC events in the low mass region, which however contains a small fraction of the events, and is mostly outside the signal region. The Dalitz plot distribution of the selected data events (after the kinematic fitting) used for the subsequent analysis is presented in Fig. 2c. The bin sizes of the Dalitz plot distributions used in the analysis are .
Correction for trigger inefficiency
To simplify the treatment of the trigger inefficiency, stable trigger performance was the main condition used to select the sample to be used for the analysis333As it was already noted, the size of the data sample is not a limitation for this analysis.. Inefficiencies of both L1 and L2 trigger components were directly measured as functions of () using control data samples of prescaled low bias triggers collected along with the main triggers, which allowed a correction of the observed () distributions, and propagation of the statistical errors of trigger inefficiencies into the result.
The L1 trigger condition requiring a coincidence of hits in two of the 16 non-overlapping HOD segments is loose, as there are three charged particles in a fully reconstructed event, providing a rather low (and stable in time) inefficiency of for the selected event sample. However, the L1 inefficiency depends rather strongly on the kinematic variables. The primary mechanism generating such a dependence is the enhancement of inefficiency for topologies with two pions hitting the same HOD segment; such events preferably belong to the kinematic regions characterized by small relative velocity of a certain pair in the kaon rest frame.
The L2 inefficiency, which is due to local DCH inefficiencies affecting the trigger more strongly than the off-line reconstruction due to lower redundancy and trigger timing effects, was measured to be (the error indicates the maximum size of its variation during the data taking period). It did not exhibit any significant correlation to the kinematic variables, due to relative complexity of the decision-making algorithm.
Monte Carlo simulation
A detailed GEANT-based MC simulation was developed, which includes full detector geometry and material description, simulation of stray magnetic fields, DCH local inefficiencies and misalignment, the beam line (which allows a reproduction of the kaon momentum spectra and beam profiles), and relative fluxes. Moreover, time variations of the above effects during the running period were simulated. A production of events distributed according to the matrix element (2) with PDG values of the slope parameters [1] was performed to determine the detector acceptance. A sample of MC events (almost 2.5 times larger than the data sample) passes the selection.
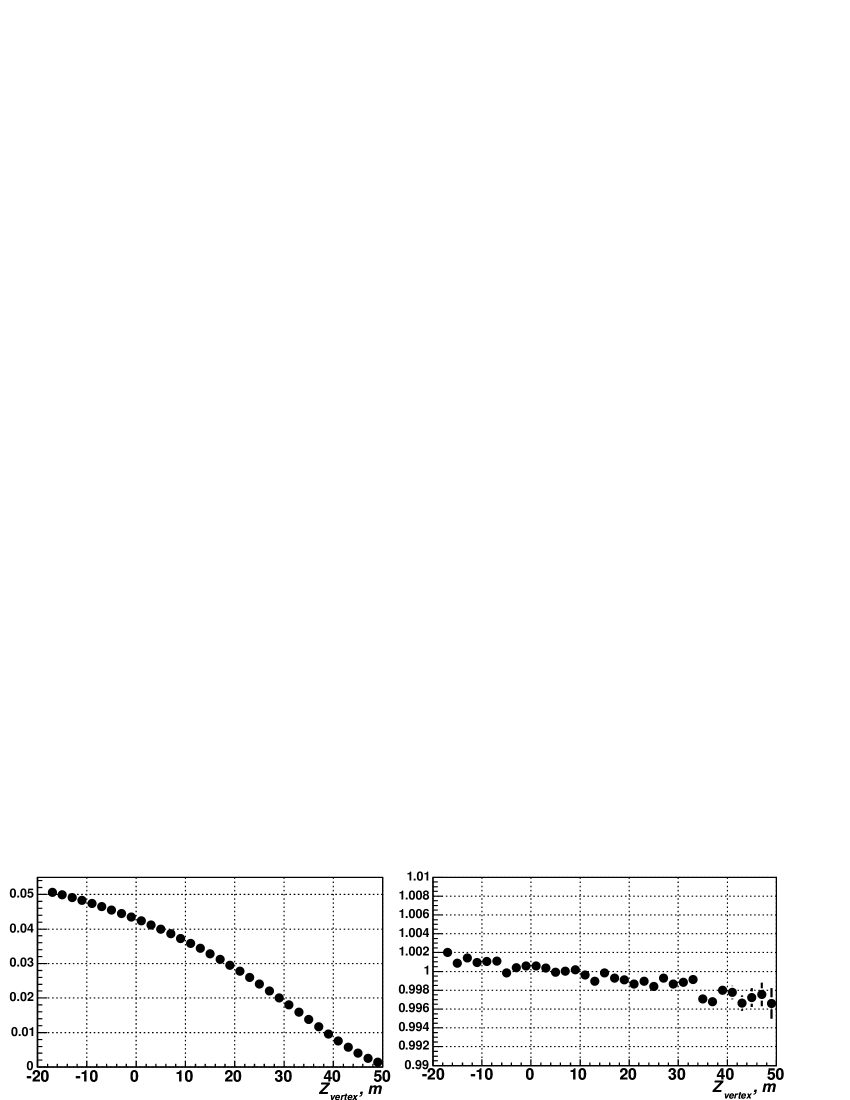
Comparison of data and MC distributions in such significant variables as longitudinal decay vertex position and illuminations of DCH1 and DCH4 planes by pions is presented in Fig. 3, and demonstrates that MC simulation reproduces the data distributions to a level of a few units of . The precision of the data description can be improved by tighter cuts on pion radial positions.
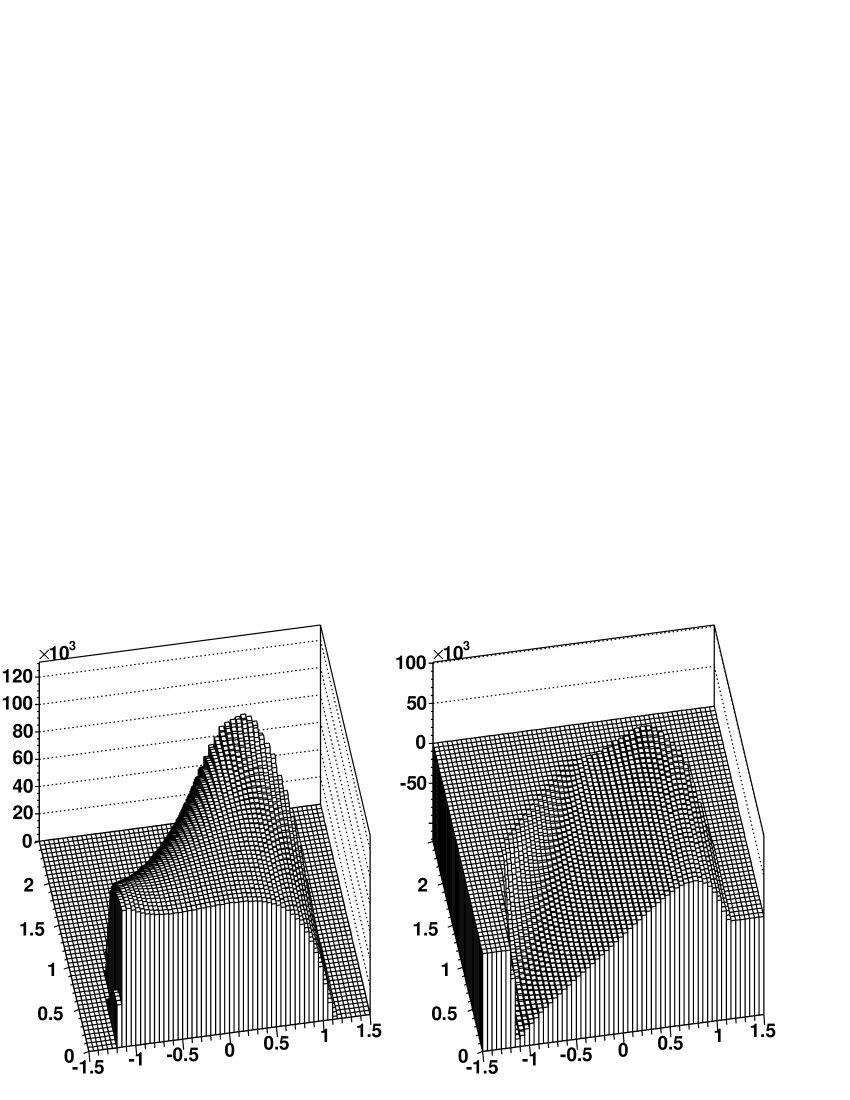
Fitting procedure
The measurement method is based on fitting the binned reconstructed data distribution presented in Fig. 2c with a sum of four reconstructed MC components generated according to the four terms in the polynomial (2) presented in Fig. 4. Let us denote these reconstructed MC distributions as , , , and . To obtain them, the MC sample (distributed in kinematic variables according to the PDG slope parameters) was divided into four subsamples444The relative sizes of the four subsamples were subject of optimization in order to minimize the statistical error of the measurement. The , , and samples are of equal sizes, while the sample is 5 times larger than each of the former three., and events in each subsample were assigned appropriate weights depending on the generated () to obtain the desired distributions.
The following functional defining the agreement of the shapes of data and MC distributions is minimized using the MINUIT package [15] in order to measure the values of the slope parameters :
| (5) |
The sum is evaluated over all the bins of reconstructed distributions with at least 1000 data events, which eliminates the necessity to include non-Gaussian behaviour of errors. Here is an uncertainty of the number of data events in a given bin (composed of a statistical part and a trigger efficiency part added in quadrature), is a MC population of a bin for given values of :
and is its statistical error:
Here , , and are the normalization constants computed taking into account the numbers of generated events in each of the four MC subsamples, and the integrals of the four terms in (2) over the Dalitz plot. The free parameters of the functional (5) are the slope parameters and an overall MC normalization parameter .
The minimization yields , corresponding to a satisfactory probability of 7.0%. The results of the fit and the trigger corrections are presented in Table 1. The non-zero values of the corrections arise mostly from the L1 trigger inefficiency dependence on kinematic variables, while their statistical errors receive contributions of similar sizes from L1 and L2 trigger efficiency uncertainties.
| Parameter | Value | Uncertainties | Trigger correction | |||||
|---|---|---|---|---|---|---|---|---|
| statistical | MC stat. | |||||||
| 0.009 | 0.008 | 0.005 | ||||||
| 0.015 | 0.013 | 0.009 | ||||||
| 0.005 | 0.004 | 0.003 | ||||||
Keeping only the linear term in (2) yields a fit of unacceptable quality: . Including the terms proportional to and (the only cubic terms allowed by Bose symmetry) yields values for the corresponding cubic slope parameters compatible with zero.
Stability checks
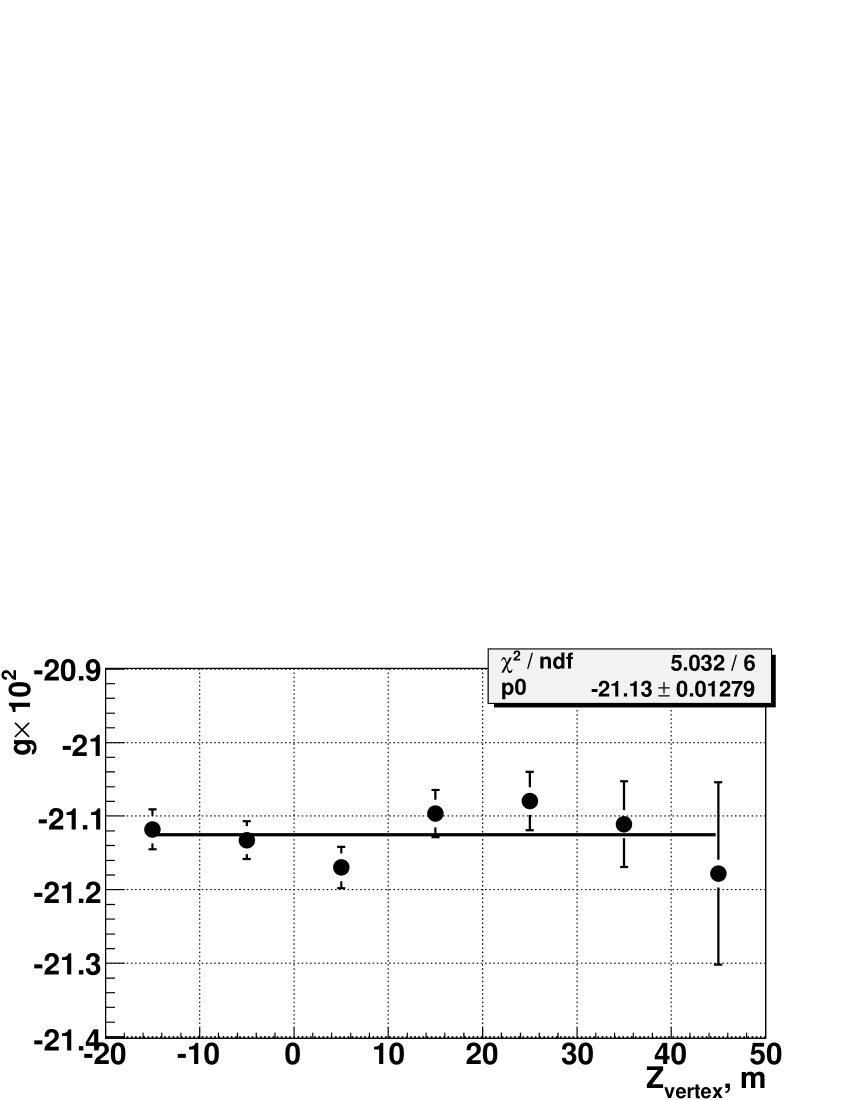
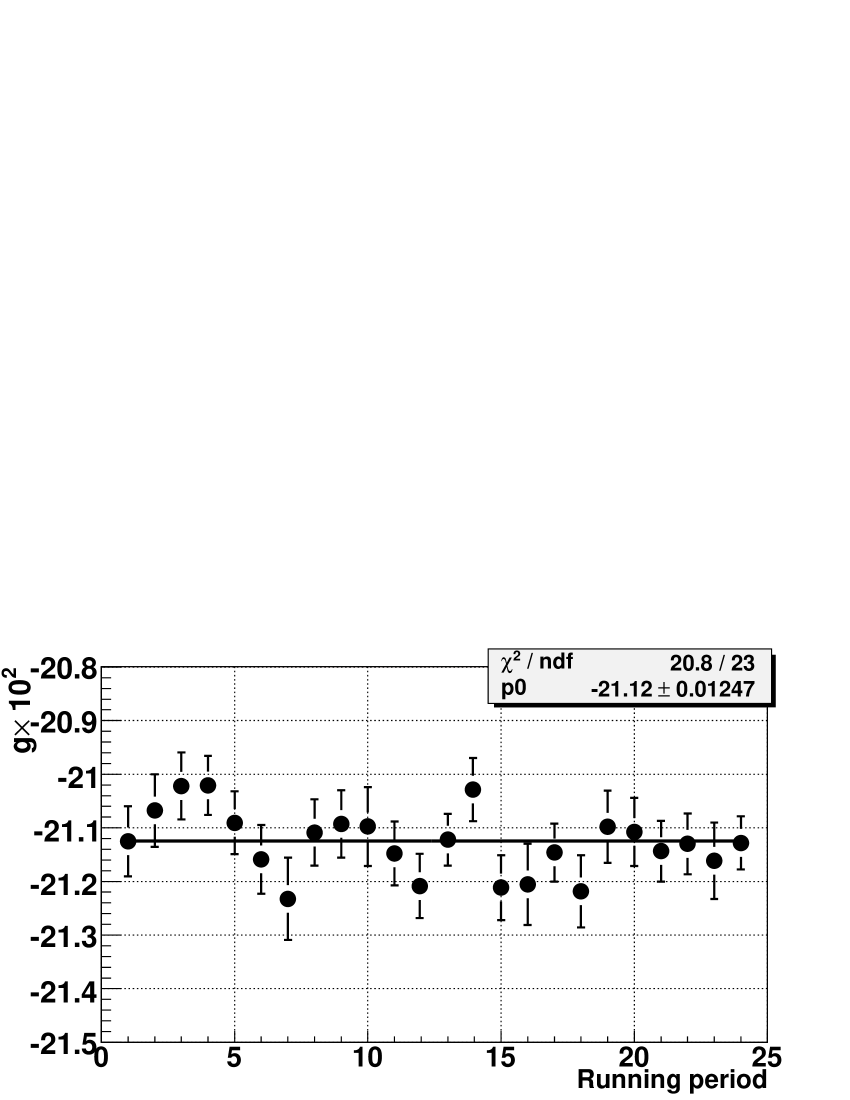
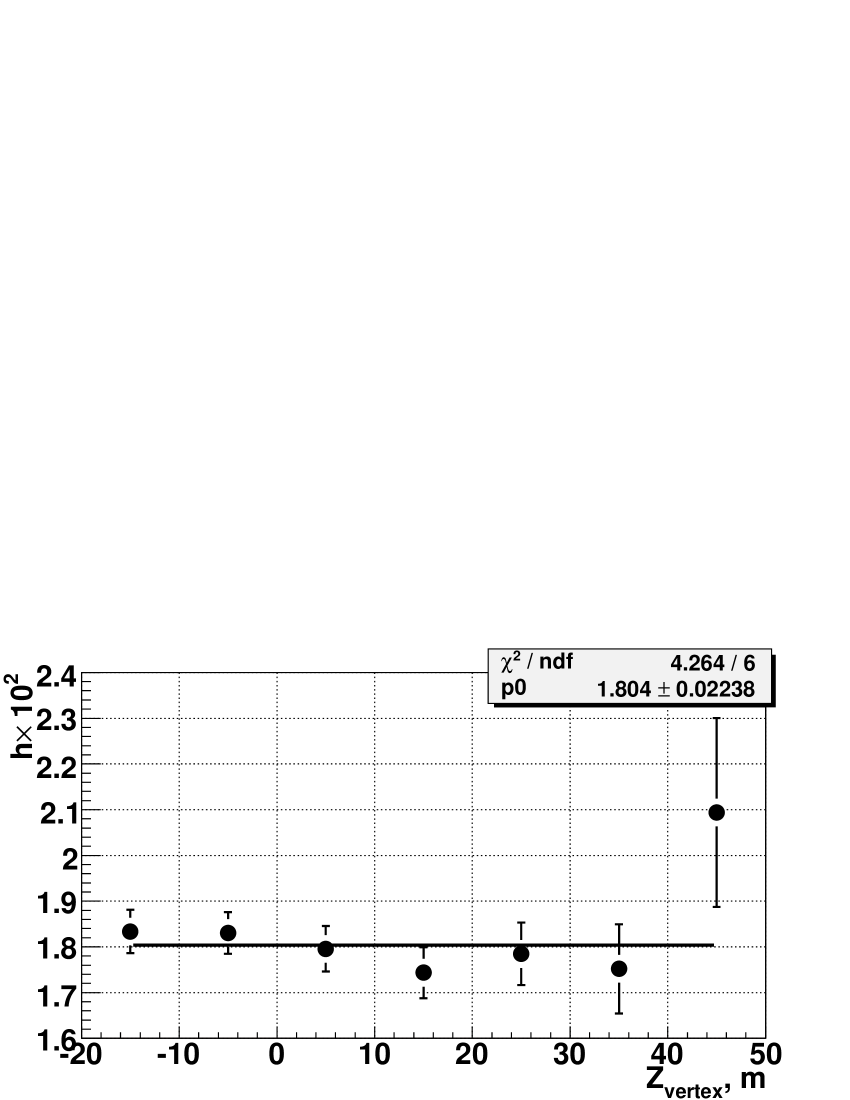
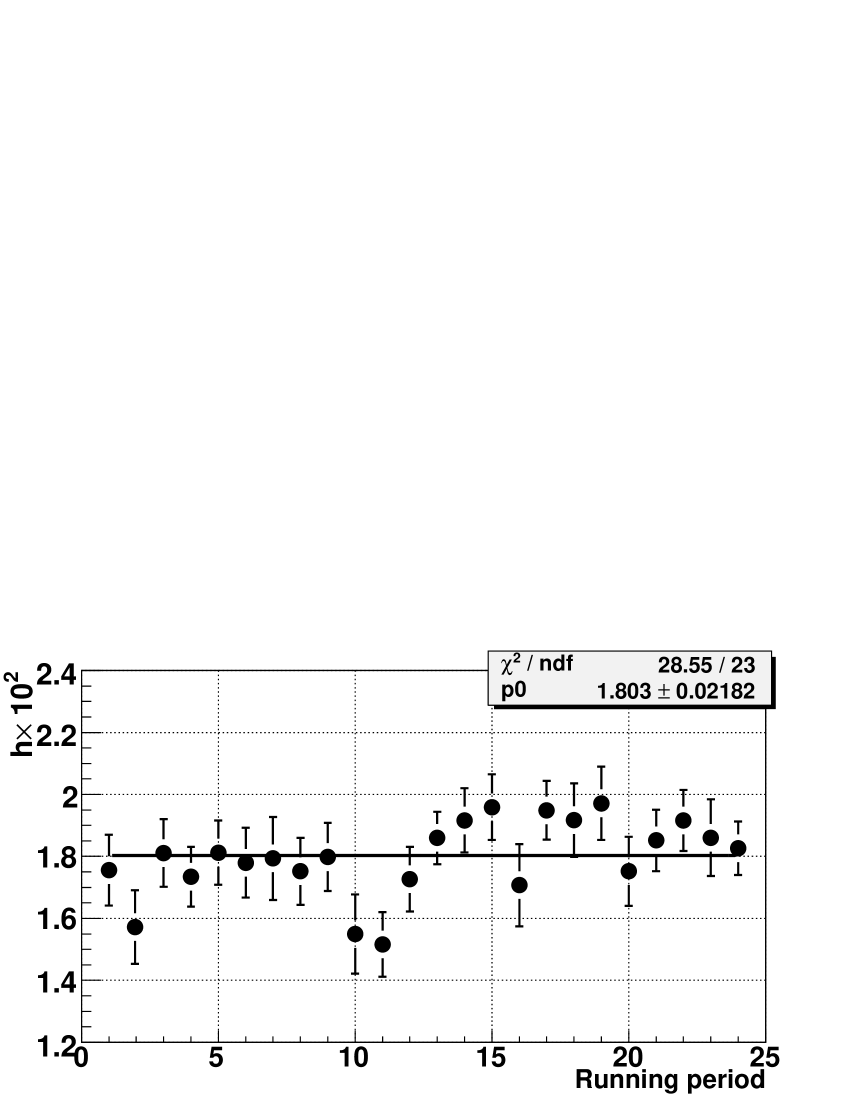
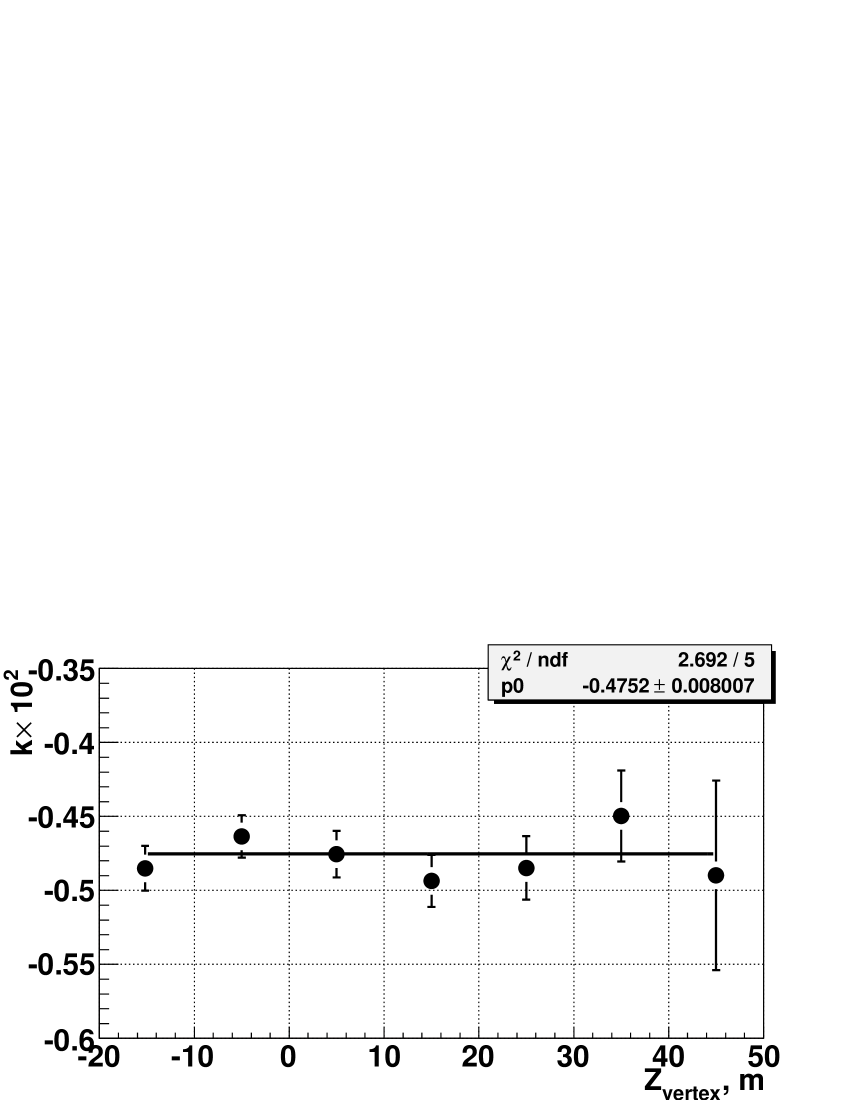
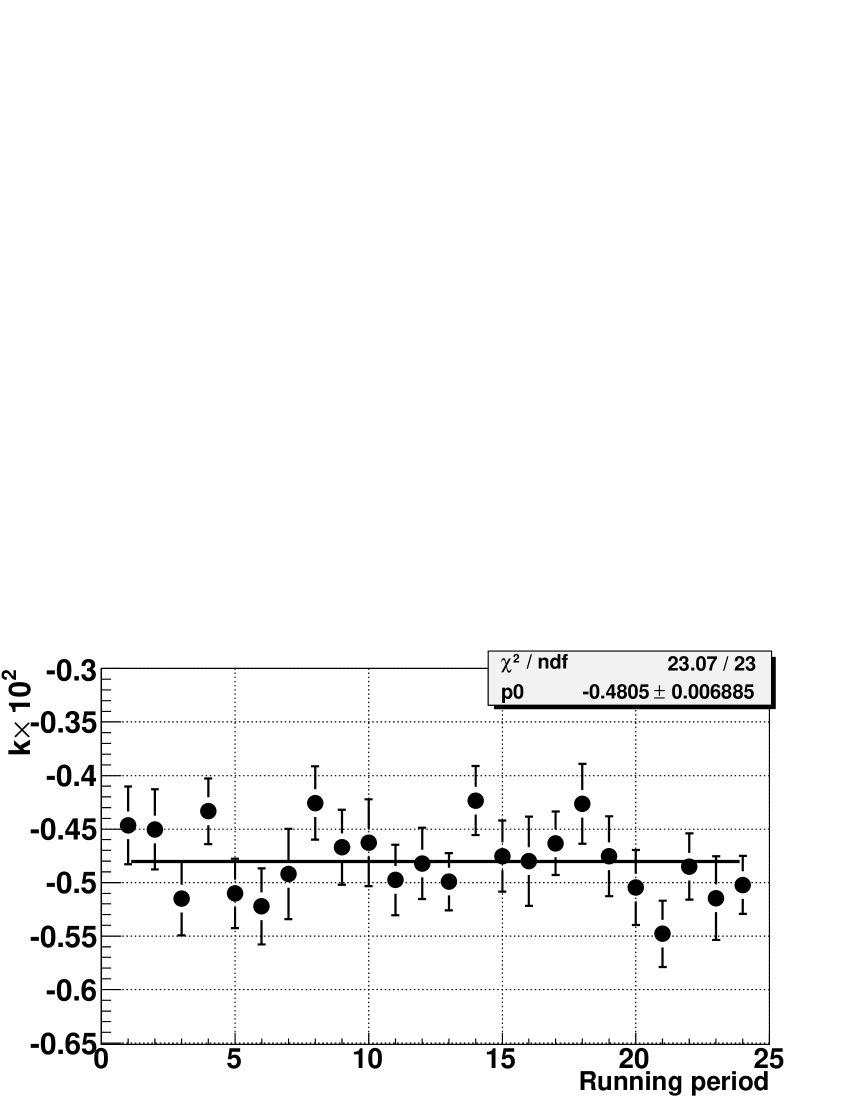
Stability of the results with respect to variations of the selection conditions on vertex fit quality, , , and , and binning variations was checked. Stability with respect to exclusion of (, ) bins with large deviations of the Coulomb factor (3) from unity and with respect to kaon sign555Combined and sample is used to obtain the result. Stability of the slope parameters with respect to kaon sign is a consequence of the experimental fact [5] that CP invariance holds at the discussed level of precision. was checked as well. No statistically significant dependencies were found. Stability with respect to various ways of binning the data was checked; comparison of slope measurements in bins of reconstructed longitudinal coordinate of decay vertex (since the acceptance depends strongly on this variable), and in data taking periods are shown in Fig. 5 as the most significant examples.
Systematic uncertainties
The Coulomb factor (3) used in description of the event density contains a pole corresponding to a pair of opposite sign pions having zero relative velocity. The implemented Monte Carlo simulation involves a certain approximation to in the pole region. In view of that, sensitivity of the result to treatment of the pole was studied, in particular, by using an alternative fitting method involving projections of the distributions in each of kinematic variables. The assigned conservative systematic uncertainties due to the fitting procedure are listed in Table 2. They are expected to be diminished to a negligible level in a future analysis of the full statistics.
| Effect | |||
|---|---|---|---|
| Fitting procedure | 0.009 | 0.007 | 0.006 |
| Pion momentum resolution | 0.004 | 0.031 | 0.009 |
| Spectrometer magnetic field | 0.002 | 0.008 | 0.004 |
| Spectrometer misalignment | 0.002 | 0.002 | 0.001 |
| Stray magnetic field | 0.001 | 0.002 | 0.001 |
| Total | 0.010 | 0.033 | 0.012 |
An important source of systematic uncertainty is the imperfect description of the resolution in pion momentum, which can be observed in Fig. 2b as a slight disagreement of the shapes of the reconstructed spectra for data and MC in the signal region666As was discussed above, a large disagreement at low values is outside the signal region.. To evaluate the corresponding effect, two different plausible ways of introducing smearing of the MC resolution were used: either by increasing the smearing of DCH space points from 90m to 100m, or by adding an extra layer of matter in the position of the Kevlar window (the former correction is more realistic). The sizes of the added perturbations are such as to correct for the “double bump” shape of the ratio in the signal region. Both methods lead to similar systematic uncertainties on the slope parameters attributed to description of resolution in pion momentum. These uncertainties are listed in Table 2.
Effects due to imperfect knowledge of the magnetic field in the spectrometer magnet were evaluated. The variation of the magnet current can be monitored with a relative precision of . Smaller variations are continuously controlled with a precision of by the deviation of the measured charge-averaged kaon mass from the nominal PDG value. A time-dependent correction is introduced by scaling the reconstructed pion momenta, decreasing the effect of overall field scale to a negligible level. To account for possible differences between the shape of the field map used for simulation and the true field, variations of the MC field map were artificially introduced, consistently with the known precision of field measurement of . The corresponding uncertainties are listed in Table 2.
The transverse positions of DCHs and individual wires were controlled and realigned at the level of reconstruction software every 2–4 weeks of data taking using data collected in special runs in which muon tracks were recorded with no magnetic field in the spectrometer. This allows an alignment precision of m to be reached. However, time variations of DCH alignment on a shorter time scale can bias the measurement. These variations were measured by the difference between the average reconstructed invariant masses for and decays, and taken into account. The precision with which these effects are simulated leads to systematic uncertainties presented in Table 2.
The effects due to limited precision of measurement of the stray magnetic field in the decay volume were estimated by variation of the stray field map used for decay vertex reconstruction; the corresponding systematic effects are presented in Table 2.
The kaon momentum spectra were carefully simulated, and the related residual uncertainties were found to be negligible. Possible differences between data and MC transverse scales were found to have a negligible influence on the result.
The total systematic errors were obtained by summing the above contributions in quadrature, and are presented in Table 2.
Conclusions
The Dalitz plot slope parameters of the decays measured with a fraction of NA48/2 data sample ignoring radiative effects (apart from the Coulomb factor) and strong rescattering effects, are:
These values are in agreement with the world averages777The PDG averages results separately for and [1]; averaging the PDG data between and decays should take into account correlated systematic uncertainties of the and measurements by the same experiment [2]., and have an order of magnitude smaller uncertainties. This is the first measurement of a non-zero value of the quadratic slope parameter . The compatibility of the measured distribution with the PDG polynomial parameterization [1] appears still to be acceptable at an improved level of precision; no significant higher order slope parameters were found.
The measurement of the slope parameters is in agreement with a full next-to-leading order computation [16]:
The whole NA48/2 sample suitable for Dalitz plot distribution analysis contains at least three times more data; a more elaborate analysis is foreseen when the corresponding theoretical framework is available.
Acknowledgements
It is a pleasure to thank the technical staff of the participating laboratories, universities and affiliated computing centres for their efforts in the construction of the NA48 apparatus, in operation of the experiment, and in data processing.
References
- [1] W.-M. Yao et al. (PDG), J. Phys. G33 (2006) 1.
- [2] W.T. Ford et al., Phys. Lett. B38 (1972) 335.
- [3] B. Devaux et al., Nucl. Phys. B126 (1977) 11.
- [4] A.A. Bel’kov et al., hep-ph/9311295.
- [5] J.R. Batley et al. (NA48/2), Phys. Lett. B634 (2006) 474.
-
[6]
J.R. Batley et al. (NA48/2), Phys. Lett. B638 (2006)
22.
Erratum-ibid. B640 (2006) 297. - [7] N. Cabibbo and G. Isidori, JHEP 03 (2005) 021.
- [8] G. Colangelo et al., Phys. Lett. B638 (2006) 187.
- [9] I. Scimemi, E. Gámiz and J. Prades, hep-ph/0602023, hep-ph/0610364.
- [10] S.R. Gevorkyan et al., hep-ph/0702154.
- [11] J.R. Batley et al. (NA48/2), Phys. Lett. B633 (2006) 173.
- [12] Y. Giomataris et al., Nucl. Instr. Methods A376 (1996) 29.
- [13] B. Peyaud et al., Nucl. Instr. Methods A535 (2004) 247.
- [14] V. Fanti et al. (NA48), NIMA-D-07-00056 (2007).
- [15] F. James and M. Roos, Comp. Phys. Comm. 10 (1975) 343.
- [16] E. Gámiz, J. Prades and I. Scimemi, JHEP 10 (2003) 042.