Determining the inelastic proton-proton cross section at the Large Hadron Collider using minimum bias events.
Abstract
Described in this paper is a new method for determining the non-diffractive part of the inelastic proton-proton cross section, at the LHC centre of mass energy of TeV. The method is based on counting the number of inelastic proton-proton interactions in the collision regions. According to preliminary investigation, this measurement will be best suited for the initial low luminosity phase of the LHC. The dominant uncertainty on this measurement comes from knowledge of the proton-proton luminosity.
1 Introduction
The Large Hadron Collider (LHC) has been designed to collide protons at a centre of mass energy TeV, providing experiments with a TeV-scale reach for new physics. Also possible at the LHC are measurements of soft interaction physics processes, using so called minimum bias data OurPaper . The study of soft interactions in proton-proton interactions at TeV, and comparison with results obtained at lower centre of mass energies, should improve our understanding of the structure of the proton in the non-perturbative QCD regime.
The proton-proton () interaction rate at the LHC is given by
| (1) |
where is the total cross section and is the luminosity. The cross section has contributions from elastic, diffractive and non-diffractive inelastic processes GoodBook , so that . The diffractive cross section can be subdivided further, with the dominant contributions coming from single and double diffractive dissociation.
The CDF experiment measured the total and elastic antiproton-proton cross sections at TeV to be mb and mb respectively CDF1 ; CDF2 . Also at TeV, the E710 experiment measured the total cross section to be mb E710 . These measurements confirmed the rise in total cross section observed at lower centre of mass energies. However the difference in the CDF and E710 results means that the form of the rise in total cross section is ambiguous at the TeV scale. Cross section measurements at the LHC energy TeV should therefore provide an important insight into the nature of this rise.
Described in this paper is a new method for measuring the non-diffractive part of the inelastic cross section, using minimum bias events. A description of minimum bias events and their selection is given in Sec. 2. The method is based on determining the mean number of inelastic collisions in a bunch crossing. In the interaction regions of the LHC experiments ATLAS and CMS, nearly every bunch crossing will contain at least one inelastic collision. The subject of collision multiplicity is discussed in Sec. 3. If individual collisions can be identified and counted, then the mean can be determined. We use the example of the ATLAS experiment to show in Secs. 4-6 that the identification of each collision should be possible using charged particles produced within the acceptance of the Inner Detector. A discussion of uncertainties is given in Sec. 7, and in Sec. 8 we present our conclusions.
2 Minimum bias events
In hadron collider experiments, inelastic events are selected using a minimum bias (MB) trigger. Typically the MB trigger accepts non-diffractive and double diffractive inelastic events, but rejects single diffractive events. The MB events are therefore commonly identified with non-single diffractive inelastic (NSD) events.
At the LHC, the inelastic collision can also be collected by triggering on randomly selected bunch crossings. These data will contain both non-diffractive and diffractive events, which can be analysed offline. Single diffractive events can be removed to create NSD data sets similar to the MB trigger data. An advantage of the random trigger is that no trigger bias is introduced in the event selection. In this paper, events selected with either the MB trigger or the random trigger are referred to as MB events. It is assumed that non-diffractive inelastic events can be extracted from MB events, although the double diffractive component in the NSD data will require further consideration.
3 Collision multiplicities
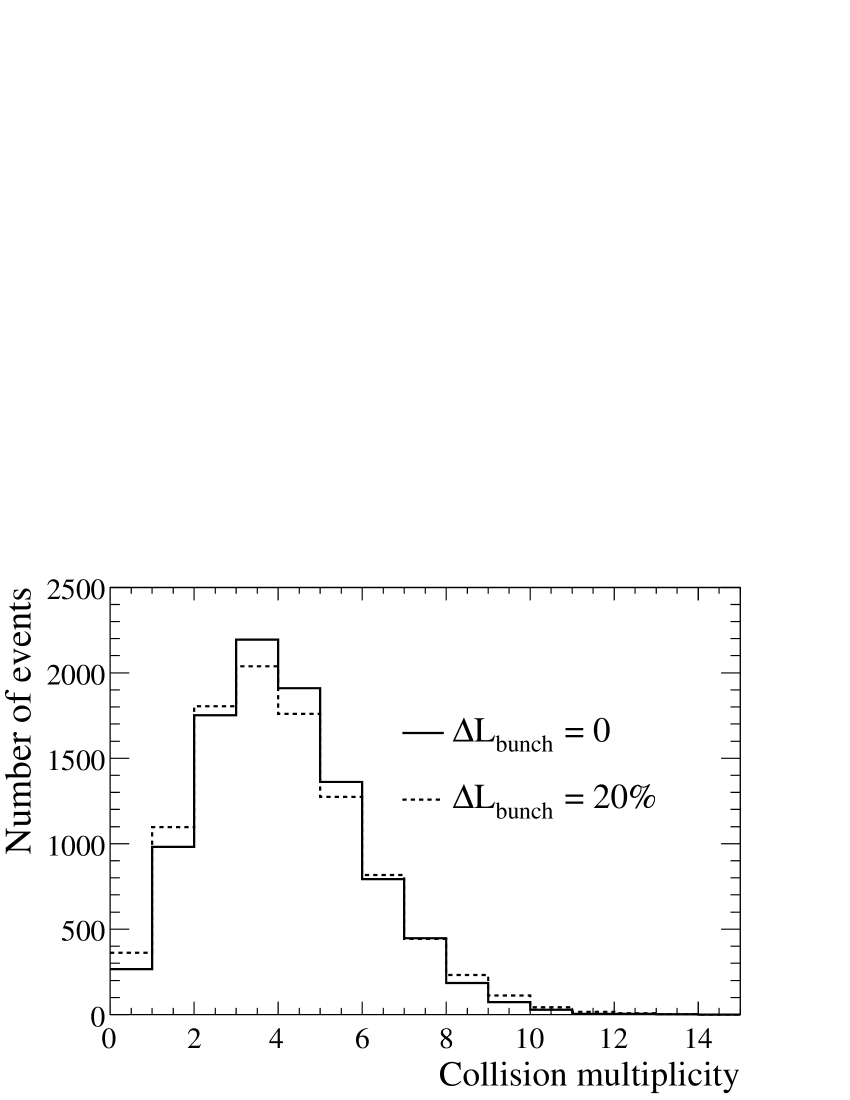
The design luminosity at the LHC is cm-2 s-1, corresponding to an average proton luminosity per bunch crossing of approximately 3 cm-2 LHC . The number of interactions per bunch crossing will vary according to Poisson statistics, with a mean value determined by Eq. 1. For a cross section mb, this would give a mean of inelastic non-diffractive events per bunch crossing. During the early stages of the LHC, the plan is to run at the lower luminosity of . Assuming the same number of proton bunches, this would give an average of interactions per bunch crossing in the case of mb. We refer to this initial luminosity phase as low luminosity, and high luminosity for the case of cm-2 s-1.
Shown in the Fig. 1 is a Poisson distribution representing the number of interactions per bunch crossing for the low luminosity case (solid line). The dashed line represents the distribution obtained from varying the mean of the Poisson according to a Gaussian distribution. This latter case represents a 20% uncertainty in luminosity for different proton bunches. It can be noted that while the variance of the multiplicity distribution changes, the mean does not.
4 Particle multiplicity
As discussed above, the proposed method is based on determining the mean number of collisions in a bunch crossing. This requires identifying and counting the number of primary vertices of interactions with high efficiency. A successful reconstruction of primary vertices requires that in each collision at least several charged particles are produced within the acceptance of a detector and that the reconstruction of their trajectories is efficient.
In the paper of OurPaper , the predictions of two Monte Carlo event generators PYTHIA PYTHIA and PHOJET PHOJET were compared with minimum bias and underlying event data for a wide range of centre of mass energies. Both of these generators have successful models for describing both the soft and hard scattering components in inelastic interactions. A new set of tunings were developed and used to extrapolate the Monte Carlo predictions to LHC energies.
Shown in Fig. 2 are the distributions of charged particle multiplicity for inelastic non-diffractive events, as predicted by PYTHIA 6.214. The distributions are presented for three different combinations of cuts on particle transverse momentum and pseudorapidity 111The angular coverage of the ATLAS and CMS Inner Detectors corresponds to a pseudorapidity range , where and is the polar angle to the beam axis.. These combinations correspond to different regions of phase space where track reconstructing should be possible with the tracking detector of ATLAS.
It can be noted that within the angular acceptance of , the average numbers of charged particles per event for transverse momenta MeV/c and MeV/c are and respectively. It is also important that the probability of finding no particles per collision is small: % for the case of MeV/c, and only % for the case of MeV/c. These two facts give the motivation to reconstruct tracks starting from the lowest possible. In addition, the fact that at least one charged particle will be produced in nearly every collision makes efficient primary vertex finding possible.
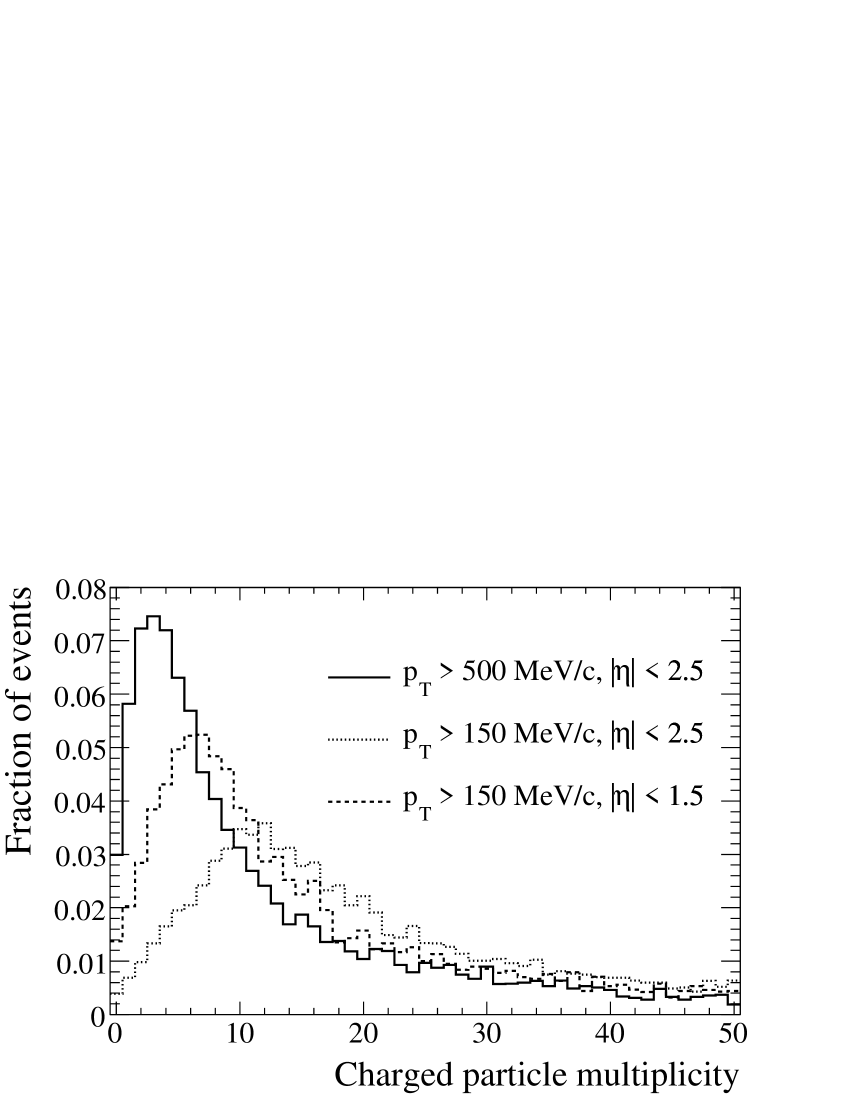
Also shown in Fig. 2 is the multiplicity distribution for charged particles with MeV/c produced in the reduced pseudorapidity range (usually referred to as the central tracking region). The number of particles produced in event is . It is expected that trajectories of charged particles reconstructed in the central region of the ATLAS tracker will have a better position resolutions ATLAS-Phys , allowing for more accurate vertex counting. This point is discussed further in the following sections.
5 Track reconstruction
For the purpose of vertex counting, it is important that the trajectories of charged particles are reconstructed efficiently and fake rates are kept low. In general, reconstruction inefficiencies are related to the performance of detector and track reconstruction algorithms. In the case of charged pions, which dominate the spectrum of charged particles in inelastic collisions, there are also losses of efficiency due to hadronic interactions in the detector material and decays. According to ATLAS performance simulations ATLAS-Phys , reconstruction efficiencies of approximately % are obtained for charged pions with transverse momenta MeV/c.
The resolution on the reconstructed track parameters is also crucial for vertex counting. Of particular importance is resolution on the impact parameter222The impact parameter is the longitudinal (along the beam axis) distance between the point of the closest approach of a reconstructed trajectory of a charged particle and a reference point with respect to which the parameters of this trajectory are calculated.. In order to distinguish different collisions within the same bunch crossing, we need the resolution on to be smaller than the typical distance between adjacent interactions. For charged tracks with MeV/c produced in the central tracking region of the ATLAS Inner Detector, the resolution on the impact parameters is found to be ATLAS-Phys . However, the resolution degades rapidly for , and reaches a few mm in the most forward regions.
As discussed in Sec. 4, there is motivation to reconstruct charged tracks with transverse momenta below MeV/c. The trajectory of a charged particle with MeV/c, travelling in a tesla magnetic field, has a transverse radius of curvature of approximately cm. Ignoring decays and inelastic hadron interactions in the detector material, this particle will reach the outer layers of the ATLAS silicon tracker, providing up to measurements along its trajectory ATLAS-Phys . Therefore it should be possible to reconstruct particle trajectories with transverse momenta significantly below MeV/c.
6 Primary vertex counting
The number of inelastic interactions in a bunch crossing will vary according to Poisson statistics, as discussed in Sec. 2. The space distribution of the interactions produced in a bunch crossing will depend on the proton bunch profile. In the direction of the beam (defined as the -axis) the collisions in bunch crossing will be distributed according to a Gaussian with standard deviation cm. The transverse dimensions of a bunch crossing region and are much smaller, . If the displacement in between two adjacent interactions in a bunch crossing is greater than the resolutions on the impact parameter of the reconstructed tracks, then associating tracks to vertices should be possible.
Shown in the Fig. 3 are the distances between pairs of adjacent interactions in an LHC bunch crossing, for cm, for the high and low luminosity cases. In the low luminosity case, the probability of finding two interactions closer than mm ( mm) to each other is % (%). As discussed in Sec. 5, in the central region of the ATLAS Inner Detector the resolution on the impact parameter for tracks with MeV/c is about . A correct association of tracks to their production vertices should thus be possible. In the high luminosity mode, the reconstruction of the number of interaction vertices should also be possible in ATLAS, given that the resolution on the impact parameter is not expected to degrade.
As mentioned above, increases in the most forward regions up to a few mm. It is expected that the efficiency of the vertex finding will degrade due to the charged tracks produced in this region. The optimal geometrical cuts required for the effective vertex finding should be established through a dedicated analysis. It should be noted however, that in the low luminosity regime, the degradation in question will be predominantly small. A careful inspection of the Fig. 3 shows that only % of pairs of adjacent interactions will have distances less than mm.
7 Uncertainties
The main uncertainties associated with using the vertex counting method to determine the inelastic cross section are the following:
-
1.
The luminosity. At the LHC the expected precision for measuring the average luminosity is ATLAS-Lumi . This is likely to dominate the inelastic cross section measurement uncertainty.
The uncertainty associated with fluctuations on the bunch crossing luminosity is expected to be small. If the fluctuations are distributed symmetrically around a mean, then the mean value of the event multiplicity distribution does not change, as discussed in Sec. 3. A Gaussian distribution is anticipated due to the many proton bunches at the LHC. The variance is not expected to exceed %. Indeed, measuring the deviation of the event multiplicity variance from that of a Poisson distribution will give a measure of the bunch-bunch luminosity fluctuations.
-
2.
Diffractive events. The predictions of PHOJET for single and double diffractive cross sections in scattering at the LHC are 11 mb and 4.1 mb respectively. These values can be compared to the prediction for the non-diffractive inelastic cross section of 69.5 mb. The event topology of diffractive events is distinctive because of so called rapidity gaps, where particles are produced in the very forward regions with little event activity in the central rapidity region. In contrast, particles are produced predominantly in the central rapidity region in non-diffractive inelastic events.
Determining the fraction of diffractive events in the minimum bias data sample, and their rejection, will require a dedicated analysis. The contamination in the final data sample is expected to be small, along with the corresponding uncertainty on the cross section measurement. We note that at the UA1 experiment at TeV the background contribution from single diffractive events in their minimum bias data was estimated to be less than 2% UA1 .
-
3.
Beam gas interactions. The contribution of beam-gas interactions in MB data samples will have to be studied. This background is usually easy to discriminate against due to the asymmetry in pseudorapidity. For example, the CDF experiment estimated the contamination of misidentified beam-gas interactions in their final data sample to be less than 0.5% at TeV and less than 2.5% at GeV.
-
4.
Detector acceptance. Not all inelastic events result in particles being produced within the detector acceptance. However, as discussed in Sec. 4, less than 5% of events have no particle produced within the detector acceptance for MeV/c. For the lower transverse momenta, the fraction of these events will be even smaller. It can be therefore concluded that the corrections associated with detector acceptance will be small and so will be the corresponding uncertainty on the cross section measurement.
-
5.
The vertex counting efficiency. The uncertainty related to the efficiency of vertex counting depends strongly on the resolutions on the impact parameter of the reconstructed tracks. In order to estimate this contribution, a dedicated analysis is required. However, as mentioned in the Sec. 6, only % of interactions will have distances within mm of each other along the -axis. This distance is much bigger than the typical resolutions of tracks, discussed in Sec. 4. The associated uncertainty is therefore not expected to be more than a few percent.
8 Conclusions
In this paper we have described a new method for measuring the inelastic non-diffractive cross section, which can be applied at LHC experiments. We have argued that the accuracy of the measurement will be at the level of and that the dominant uncertainty will come from knowledge of the luminosity.
We have shown that the ATLAS experiment provides an excellent laboratory for testing this new approach. We have also suggested that the reconstruction of particle trajectories to lower transverse momenta should be beneficial for finding the primary vertices associated with the inelastic collisions. We therefore recommend the development of track reconstruction algorithms into this low- regime. Similar arguments apply to the CMS experiment, although its prospects for low- track measurement are more challenging due to the higher magnetic field in the CMS Inner Detector.
We note that measurements of the total and elastic cross sections are being planned by the TOTEM experiment at the LHC using a luminosity independent method based on the Optical Theorem TOTEM . These measurements require dedicated instrumentation in the very forward regions. Diffractive physics measurements will also feature strongly. The inelastic non-diffractive cross section can be obtained by subtracing the elastic and diffractive components from the total cross section. This measurement should complement our more direct measurement.
Finally we would like to point out that, while we have proposed the vertex counting method for making a measurement of the inelastic non-diffractive cross section, this method can be used equally for luminosity measurement. Once we have some knowledge of at TeV, either from ATLAS or from TOTEM, then the efficient reconstruction of the number of minimum bias events should allow measurements of the LHC luminosity.
References
- (1) A. Moraes et al., Eur. Phys. J. C (2007)
- (2) P. Collins and A. Martin, Rep. Prog. Phys. 45, (1982) 335
- (3) F. Abe et al., Phys. Rev. D. 50, (1994) 5550
- (4) F. Abe et al., Phys. Rev. D. 50, (1994) 5518
- (5) N. M. Amos et al., Phys. Rev. Lett. 68, (1992) 2433
- (6) The Large Hadron Collider, CERN/AC/95-05, (1995)
- (7) T. Sjöstrand et al., Comput. Phys. Comm. 135, (2001) 238
- (8) R. Engel, Z. Phys. C. 66, (1995) 203
- (9) ATLAS Detector and Physics Performance TDR, Vol. 1, Chapter 3, CERN/LHCC/99-14 (1999)
- (10) ATLAS Detector and Physics Performance TDR, Vol. 1, Chapter 13, CERN/LHCC/99-14 (1999)
- (11) C. Albajar et al., Nucl. Phys. B. 336, (1990) 261
- (12) TOTEM TDR, CERN/LHCC/2004-002 (2004)