Measurement of in tree-dominated -decays and ambiguity removal
Abstract
The most recent results from the -factories on the time-dependent asymmetries measured in -decays mediated by quark-transitions are reviewed. The Standard Model interpretation of the results in terms of the parameter leads to a four-fold ambiguity on the unitarity triangle which can be reduced to a two-fold ambiguity by measuring the sign of the parameter . The results on obtained so far are reviewed.
1 INTRODUCTION
Within the Standard Model, quark flavor-mixing is described by the unitary Cabibbo-Kobayashi-Maskawa (CKM) matrix [1]. The size of violation carried by the CKM matrix is quantified by the imaginary part of the apex, , of the unitarity triangle. Constraints on the parameter () can be obtained from the measurement of time-dependent decay rates of neutral -mesons into eigenstates mediated by quark transitions. The time-dependent rate asymmetry between and decays is given by , where is the mass difference between the heavy () and the light () neutral mass eigenstate, and and where the parameter is used by the BABAR collaboration and by the Belle collaboration. The parameter , given by , being the eigenvalue of the final state, is a phase-convention-independent quantity which contains possible sources of violation in mixing (), direct violation (), and violation in the interference between decay with and without mixing (). In the system, to a very good approximation and -violation in mixing is expected to be small, which is confirmed by the experimental constraints: [2]. For the decay , the dominant amplitude is a tree-mediated quark-transition. There are also contributions from penguin amplitudes. In the case of the - and -penguin, the CKM phases are equal or almost equal, respectively, to the tree-decay phase (). Only in the case of the -quark penguin the CKM phase () differs significantly from the tree amplitude. However, it is doubly-Cabibbo suppressed with respect to the tree amplitude. An additional effect comes from -violation in the system, however which changes the relative phase by only a small amount. Hence, for the asymmetry, one expects to a very good approximation .
2 MEASUREMENTS OF
The most precise determinations of are coming currently from the -factory experiments BABAR and Belle thanks to the excellent performance of their accelerators PEP II and KEKB. The new peak luminosity records achieved in 2006 are for PEP II and for KEKB. By summer 2006, PEP II/BABAR had collected of data while KEKB/Belle had collected a data sample of . This results in a sum of events written to tape. Both experiments have updated their analyses recently [3, 4].
At the -factories, the resonance is produced in collisions with asymmetric electron and positron beam energies resulting in a boost factor of at PEP II and at KEKB, respectively. The decays in about of the cases to neutral -meson pairs, produced in a coherent quantum state. The time-dependent asymmetry is measured by determining the decay-time difference between the decay of one to a eigenstate () and the decay of the other meson () to flavour-specific final states. These final states are not reconstructed exclusively and the flavor of is determined (“tagged”) only on a statistical basis by determining the sign of the charge mainly from high-energy leptons, and kaons and low-energy pions mutually stemming from decays. The figure of merit for the tagging performance is given by the quality factor , where is the tagging efficiency and the mistag fraction in tagging category . enlarges the statistical uncertainty of the decay-rate asymmetry measurements and has been measured by BABAR (Belle) to be (). The decay-time difference is estimated from the distance between the two -decay vertices in the beam-direction . Due to the boost, can be measured with sufficient precision by means of silicon vertex detectors. The average is of order at Belle and about at BABAR. The resolution is dominated by the vertex resolution and is of order .
The most recent BABAR analysis [3] was performed on a sample of events. The -odd final states () used are where , , and . The -even final state is also reconstructed. Compared to the high-purity sample , this final state suffers from a significantly higher background level.
In addition, the vector-vector final state with is used. A recent angular analysis performed by BABAR finds an effective eigenvalue of for this final state [5]. For the -odd final states the result is , for the final state it is (see Fig. 1). The average of all modes including results in .
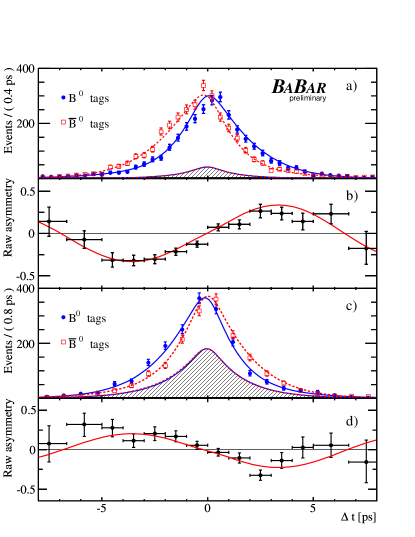
The main systematic uncertainties are due to the content of the background, the resolution functions, the background in , the differences in the mistag fractions between and , and the knowledge of the event-by-event beam spot position. For the final state , which has the highest purity (), BABAR fits and simultaneously and finds , translating into a deviation from zero. The dominant systematic uncertainty in this case () is due to the interference between the suppressed amplitude and the amplitude for certain hadronic decays.
The Belle analysis [4] uses a sample of million events where only the -odd final state and the -even final state are considered. Both results for the and coefficients are consistent: and , respectively, and . The averages between both results are: and . The dominant systematic uncertainties on come from the vertex reconstruction, the resolution function, the background fraction, flavor tagging, and the effect of the tag-side interference. The systematic uncertainty on , as in the case of BABAR, is dominated by the tag-side interference ().
The world average computed by the Heavy Flavor Averaging Group (HFAG) [2] is , where most of the systematic uncertainties have been treated as uncorrelated. Correlated error sources like the -lifetime, the mixing frequency or the effect of the tag-side interference play only a minor role at this stage. This suggests that on the time scale of 2008, when an integrated luminosity of order is expected from BABAR and Belle together, the total uncertainty on will fall below . Theoretical estimates for the difference between the measured coefficient and the true value are of order or below [6]. The average value of BABAR and Belle for the cosine coefficient is and hence consistent with zero as expected in the Standard Model at this level of precision. The systematic uncertainty is dominated by the tag-side interference effect. Under the assumption that both measurements have estimated their uncertainties correctly and that the uncertainties are Gaussian-like, the p-value (denoted by HFAG [2]) to find a deviation between the two experiments as large as or larger than the one observed is 0.02.
3 MEASUREMENTS OF
Since only the parameter is measured, there are four different solutions for . Two solutions correspond to , or , while the ones corresponding to are or . The constraints on the unitarity triangle excluding as an input result is [7], suggesting that is the correct solution. However, this argument relies on the validity of the Standard Model. If one allows for New Physics contributions in mixing a new phase, , is introduced. As a result, the measured parameter is and the new degree of freedom invalidates the argument given above. Only the measurement of a positive sign of allows a restriction of the possible solutions to or . Even then the allowed space for and is quite large and can only be reduced by adding other experimental inputs (see e.g. Ref. [7]).
3.1
The first constraints on have been obtained from a time-dependent angular analysis of the final state . Since this is a vector-vector mode there are three amplitudes contributing to this final state: two -even amplitudes, and , and a -odd amplitude , where the represent strong phases. The sizes and relative strong phases of these amplitudes can be measured from the angular distributions (usually described in the transversity basis) of the decay products of the and . The measured time-dependent decay-rate asymmetry in the three-dimensional phase space of the transversity angles is sensitive to due to the interference between the -even amplitudes and , and the -odd amplitude . However, there is an ambiguity in the solution of the strong phase differences resulting in a sign ambiguity which seems to spoil the extraction.
BABAR has performed such a time-dependent angular analysis on a sample of pairs [8] and finds and . When fixing as their best measured value, BABAR finds . The sign ambiguity in has been resolved in BABAR’s analysis by taking advantage of the interference in the system between the -wave coming from the decay and the underlying -wave.
Belle has also performed a time-dependent angular analysis on a sample of pairs [9] and finds and . When fixing , is found. The sign ambiguity in has not been resolved. Instead, Belle uses the theoretical argument of -quark helicity conservation [10] to select the solution for the strong phase difference. This solution is consistent with BABAR’s experimental result on the strong phase difference and leads to the positive sign for .
3.2
It has been proposed recently [11] that the sign of can also be extracted from a time-dependent Dalitz plot analysis of the decay where denotes a light neutral meson. These color-suppressed decay topologies are mediated by tree diagrams. If one neglects doubly-Cabibbo suppressed diagrams, the leading relevant quark transitions are for , and for , respectively. Interference between these amplitudes is obtained by reconstructing the neutral mesons in the common final state . We assume no violation in the system and denote for the and for the decay amplitudes, respectively. Then, the time-dependent decay amplitudes are given by:
where also direct violation as well as violation in mixing in the neutral system has been neglected. Here, is the eigenvalue of and is the relative orbital angular momentum in the system. Due to the interference between and over the Dalitz plane, the time-dependent decay-rate asymmetry allows us to extract simultaneously and once the model for the Dalitz plot amplitudes is fixed.
A time-dependent Dalitz plot analysis on a sample of million pairs has been first performed by Belle [12] by reconstructing with and with and . The measured Dalitz plot is shown in Fig. 2.
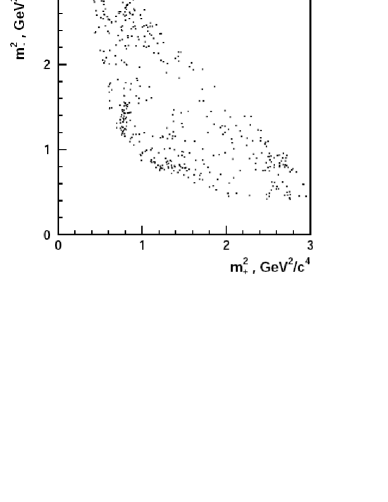
A simultaneous fit results in and .
In a similar BABAR analysis on a sample of million pairs, the decays with and with and have been reconstructed [13]. BABAR finds and . In this fit also has been determined and found to be consistent with 1 (). This is as expected due to the smallness of the neglected doubly-Cabibbo suppressed tree-amplitudes carrying a different CKM phase with respect to the dominant tree amplitudes. In principle, the neglected amplitude could be taken into account in the analysis but this is likely to be impractical since the ratio of amplitudes is expected to be of order . With higher statistics the precision on might be dominated by the systematic uncertainty on the Dalitz plot model which is already the largest systematic error.
3.3
Another possible way to extract and simultaneously has been proposed in Ref. [14] and has then been studied in more detail in Ref. [15]. The method uses the final state . The time-dependent asymmetry is given by:
The are integrals of functions of the amplitudes and over the half Dalitz space in the variables and :
The parameter can be measured if . This could be realized if a broad intermediate resonance contributed. In this case, one expects that becomes large.
The BABAR collaboration has performed such an analysis [16]. In the invariant spectrum there is a evidence for the narrow width resonance. In addition, there is evidence for a broad structure below (Fig. 3).
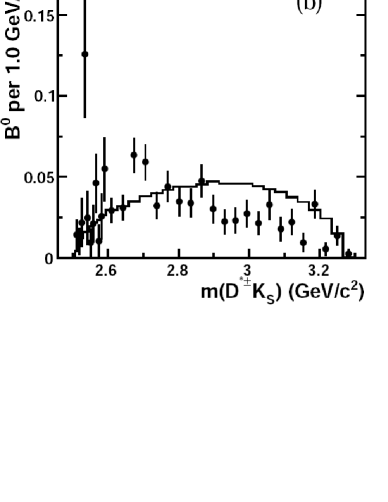
The results of the time-dependent analysis are , being consistent with the presence of a broad resonance in the system, , and . In Ref. [15], it has been predicted that the sign of is positive which would lead to a positive sign for .
An interesting question is the nature of the broad structure in the spectrum. Besides the resonance a second state is expected. A possible candidate for this state is the which however lies below the threshold. In this case, the nature of this possible broad resonance is unclear.
| Mode | BABAR | Belle |
|---|---|---|
| Not quantified | ||
| Not measured |
3.4 Summary of determinations
The analyses reviewed here have not extracted a confidence level as a function of . Instead, the BABAR analysis [8] has calculated a p-value for , where corresponds to the value obtained from the the precise measurement. For the p-value is small (). However, since the BABAR-measured value lies outside the physical region, also the p-value for is small (). For this reason, also the likelihood ratio has been considered where is the probability density function value for the measured value if the true value is . This likelihood ratio has then been interpreted in the framework of Bayesian statistics by assuming equal a-priori probabilities for the two hypotheses, and , and denoted a confidence level. The other analyses discussed in this review followed this procedure and the confidence levels obtained are summarized in Table 1.
An average of all measurements is beyond the scope of this review. In some cases the results have central values outside the physical region and large asymmetric uncertainties which makes an average cumbersome. The interpretation of the result relies on a theoretical assumption which requires further investigation, including the understanding of the Dalitz plot structure. The systematic uncertainty due to the Dalitz plot model in should be reduced since more statistics will come in the future. This channel provides a good opportunity to check whether is measured to be the same to a good approximation in and transitions.
Besides the above quantitative difficulties, the qualitative results suggest that the prefered solution is or , in agreement with the Standard Model. This finding removes half of the possible range in the New Physics parameter .
References
- [1] N. Cabibbo, Phys. Rev. Lett. 10 (1963) 531; M. Kobayashi and T. Maskawa, Prog. Theor. Phys. 49 (1973) 652.
- [2] Heavy Flavour Averaging Group, E. Barberio et al., hep-ex/0603003, updated (ICHEP06): http://www.slac.stanford.edu/xorg/hfag/
- [3] BABAR collaboration (B. Aubert et al.), hep-ex/0607107.
-
[4]
Belle collaboration (K.-F. Chen et al.),
hep-ex/0608039. -
[5]
BABAR collaboration (B. Aubert et al.),
hep-ex/0607081. - [6] See e.g. Y. Grossman, A. Kagan and Z. Ligeti, Phys. Lett. B538 (2002) 327; H. Boos, T. Mannel and J. Reuter, Phys. Rev. D71 (2004) 036006; M. Ciuchini, M. Pierini and L. Silvestrini, Phys. Rev. Lett. 95 (2005) 221804; H.-n. Li and S. Mishima, hep-ph/0610120.
- [7] The CKMfitter Group (J. Charles et al.), Eur. Phys. J. C41 (2005) 1; updated in http://ckmfitter.in2p3.fr/.
-
[8]
BABAR collaboration (B. Aubert et al.),
Phys. Rev. D71 (2005) 032005. -
[9]
Belle colaboration (R. Itoh et al.),
Phys. Rev. Lett. 95 (2005) 091601. - [10] M. Suzuki, Phys. Rev. D64 (2001) 117503.
- [11] A. Bondar, T. Gershon and P. Krokovny, Phys. Lett. B624 (2005) 1.
-
[12]
Belle colaboration (P. Krokovny et al.),
Phys. Rev. Lett. 97 (2006) 081801. -
[13]
BABAR collaboration (B. Aubert et al.),
hep-ex/0607105. - [14] J. Charles et al., Phys. Lett. B425 (1998) 375; Erratum-ibid B433 (1998) 441.
- [15] T.E. Browder et al., Phys. Rev. D61 (2000) 054009.
-
[16]
BABAR collaboration (B. Aubert et al.),
hep-ex/0608016.