Measurement of meson production
in scattering at low
Abstract
The production of (2010) mesons in scattering in the range of exchanged photon virtuality has been measured with the ZEUS detector at HERA using an integrated luminosity of 82 pb-1. The decay channels with and corresponding antiparticle decay were used to identify mesons and the ZEUS beampipe calorimeter was used to identify the scattered electron. Differential cross sections as functions of , inelasticity, , transverse momentum of the meson, , and pseudorapidity of the meson, , have been measured in the kinematic region , and . The measured differential cross sections are in agreement with two different NLO QCD calculations. The cross sections are also compared to previous ZEUS measurements in the photoproduction and DIS regimes.
DESY–07–012
The ZEUS Collaboration
S. Chekanov1,
M. Derrick,
S. Magill,
S. Miglioranzi2,
B. Musgrave,
D. Nicholass2,
J. Repond,
R. Yoshida
Argonne National Laboratory, Argonne, Illinois 60439-4815, USA n
M.C.K. Mattingly
Andrews University, Berrien Springs, Michigan 49104-0380, USA
M. Jechow, N. Pavel †, A.G. Yagües Molina
Institut für Physik der Humboldt-Universität zu Berlin,
Berlin, Germany
S. Antonelli, P. Antonioli,
G. Bari,
M. Basile,
L. Bellagamba,
M. Bindi,
D. Boscherini,
A. Bruni,
G. Bruni,
L. Cifarelli,
F. Cindolo,
A. Contin,
M. Corradi3,
S. De Pasquale,
G. Iacobucci,
A. Margotti,
R. Nania,
A. Polini,
L. Rinaldi,
G. Sartorelli,
A. Zichichi
University and INFN Bologna, Bologna, Italy e
D. Bartsch,
I. Brock,
S. Goers4,
H. Hartmann,
E. Hilger,
P. Irrgang5,
H.-P. Jakob,
M. Jüngst,
O.M. Kind,
E. Paul6,
R. Renner,
U. Samson,
V. Schönberg,
R. Shehzadi,
M. Wlasenko
Physikalisches Institut der Universität Bonn,
Bonn, Germany b
N.H. Brook,
G.P. Heath,
J.D. Morris,
T. Namsoo
H.H. Wills Physics Laboratory, University of Bristol,
Bristol, United Kingdom m
M. Capua,
S. Fazio,
A. Mastroberardino,
M. Schioppa,
G. Susinno,
E. Tassi
Calabria University,
Physics Department and INFN, Cosenza, Italy e
J.Y. Kim7,
K.J. Ma8
Chonnam National University, Kwangju, South Korea g
Z.A. Ibrahim,
B. Kamaluddin,
W.A.T. Wan Abdullah
Jabatan Fizik, Universiti Malaya, 50603 Kuala Lumpur, Malaysia r
Y. Ning,
Z. Ren,
F. Sciulli
Nevis Laboratories, Columbia University, Irvington on Hudson,
New York 10027 o
J. Chwastowski,
A. Eskreys,
J. Figiel,
A. Galas,
M. Gil,
K. Olkiewicz,
P. Stopa,
L. Zawiejski
The Henryk Niewodniczanski Institute of Nuclear Physics, Polish Academy of Sciences, Cracow,
Poland i
L. Adamczyk,
T. Bołd,
I. Grabowska-Bołd,
D. Kisielewska,
J. Łukasik,
M. Przybycień,
L. Suszycki
Faculty of Physics and Applied Computer Science,
AGH-University of Science and Technology, Cracow, Poland p
A. Kotański9,
W. Słomiński
Department of Physics, Jagellonian University, Cracow, Poland
V. Adler,
U. Behrens,
I. Bloch,
C. Blohm,
A. Bonato,
K. Borras,
N. Coppola,
A. Dossanov,
J. Fourletova,
A. Geiser,
D. Gladkov,
P. Göttlicher10,
I. Gregor,
T. Haas,
W. Hain,
C. Horn,
B. Kahle,
U. Klein11,
U. Kötz,
H. Kowalski,
E. Lobodzinska,
B. Löhr,
R. Mankel,
I.-A. Melzer-Pellmann,
A. Montanari,
D. Notz,
A.E. Nuncio-Quiroz,
I. Rubinsky,
R. Santamarta,
U. Schneekloth,
A. Spiridonov12,
H. Stadie,
D. Szuba13,
J. Szuba14,
T. Theedt,
G. Wolf,
K. Wrona,
C. Youngman,
W. Zeuner
Deutsches Elektronen-Synchrotron DESY, Hamburg, Germany
W. Lohmann, S. Schlenstedt
Deutsches Elektronen-Synchrotron DESY, Zeuthen, Germany
G. Barbagli,
E. Gallo,
P. G. Pelfer
University and INFN, Florence, Italy e
A. Bamberger,
D. Dobur,
F. Karstens,
N.N. Vlasov15
Fakultät für Physik der Universität Freiburg i.Br.,
Freiburg i.Br., Germany b
P.J. Bussey,
A.T. Doyle,
W. Dunne,
J. Ferrando,
D.H. Saxon,
I.O. Skillicorn
Department of Physics and Astronomy, University of Glasgow,
Glasgow, United Kingdom m
I. Gialas16
Department of Engineering in Management and Finance, Univ. of
Aegean, Greece
T. Gosau,
U. Holm,
R. Klanner,
E. Lohrmann,
H. Salehi,
P. Schleper,
T. Schörner-Sadenius,
J. Sztuk,
K. Wichmann,
K. Wick
Hamburg University, Institute of Exp. Physics, Hamburg,
Germany b
C. Foudas,
C. Fry,
K.R. Long,
A.D. Tapper
Imperial College London, High Energy Nuclear Physics Group,
London, United Kingdom m
M. Kataoka17,
T. Matsumoto,
K. Nagano,
K. Tokushuku18,
S. Yamada,
Y. Yamazaki
Institute of Particle and Nuclear Studies, KEK,
Tsukuba, Japan f
A.N. Barakbaev,
E.G. Boos,
N.S. Pokrovskiy,
B.O. Zhautykov
Institute of Physics and Technology of Ministry of Education and
Science of Kazakhstan, Almaty, Kazakhstan
D. Son
Kyungpook National University, Center for High Energy Physics, Daegu,
South Korea g
J. de Favereau,
K. Piotrzkowski
Institut de Physique Nucléaire, Université Catholique de
Louvain, Louvain-la-Neuve, Belgium q
F. Barreiro,
C. Glasman19,
M. Jimenez,
L. Labarga,
J. del Peso,
E. Ron,
M. Soares,
J. Terrón,
M. Zambrana
Departamento de Física Teórica, Universidad Autónoma
de Madrid, Madrid, Spain l
F. Corriveau,
C. Liu,
R. Walsh,
C. Zhou
Department of Physics, McGill University,
Montréal, Québec, Canada H3A 2T8 a
T. Tsurugai
Meiji Gakuin University, Faculty of General Education,
Yokohama, Japan f
A. Antonov,
B.A. Dolgoshein,
V. Sosnovtsev,
A. Stifutkin,
S. Suchkov
Moscow Engineering Physics Institute, Moscow, Russia j
R.K. Dementiev,
P.F. Ermolov,
L.K. Gladilin,
I.I. Katkov,
L.A. Khein,
I.A. Korzhavina,
V.A. Kuzmin,
B.B. Levchenko20,
O.Yu. Lukina,
A.S. Proskuryakov,
L.M. Shcheglova,
D.S. Zotkin,
S.A. Zotkin
Moscow State University, Institute of Nuclear Physics,
Moscow, Russia k
I. Abt,
C. Büttner,
A. Caldwell,
D. Kollar,
W.B. Schmidke,
J. Sutiak
Max-Planck-Institut für Physik, München, Germany
G. Grigorescu,
A. Keramidas,
E. Koffeman,
P. Kooijman,
A. Pellegrino,
H. Tiecke,
M. Vázquez17,
L. Wiggers
NIKHEF and University of Amsterdam, Amsterdam, Netherlands h
N. Brümmer,
B. Bylsma,
L.S. Durkin,
A. Lee,
T.Y. Ling
Physics Department, Ohio State University,
Columbus, Ohio 43210 n
P.D. Allfrey,
M.A. Bell, A.M. Cooper-Sarkar,
A. Cottrell,
R.C.E. Devenish,
B. Foster,
K. Korcsak-Gorzo,
S. Patel,
V. Roberfroid21,
A. Robertson,
P.B. Straub,
C. Uribe-Estrada,
R. Walczak
Department of Physics, University of Oxford,
Oxford United Kingdom m
P. Bellan,
A. Bertolin, R. Brugnera,
R. Carlin,
R. Ciesielski,
F. Dal Corso,
S. Dusini,
A. Garfagnini,
S. Limentani,
A. Longhin,
L. Stanco,
M. Turcato
Dipartimento di Fisica dell’ Università and INFN,
Padova, Italy e
B.Y. Oh,
A. Raval,
J. Ukleja22,
J.J. Whitmore23
Department of Physics, Pennsylvania State University,
University Park, Pennsylvania 16802 o
Y. Iga
Polytechnic University, Sagamihara, Japan f
G. D’Agostini,
G. Marini,
A. Nigro
Dipartimento di Fisica, Università ’La Sapienza’ and INFN,
Rome, Italy
J.E. Cole,
J.C. Hart
Rutherford Appleton Laboratory, Chilton, Didcot, Oxon,
United Kingdom m
H. Abramowicz24,
A. Gabareen,
R. Ingbir,
S. Kananov,
A. Levy
Raymond and Beverly Sackler Faculty of Exact Sciences,
School of Physics, Tel-Aviv University, Tel-Aviv, Israel d
M. Kuze
Department of Physics, Tokyo Institute of Technology,
Tokyo, Japan f
R. Hori,
S. Kagawa25,
N. Okazaki,
S. Shimizu,
T. Tawara
Department of Physics, University of Tokyo,
Tokyo, Japan f
R. Hamatsu,
H. Kaji26,
S. Kitamura27,
O. Ota,
Y.D. Ri
Tokyo Metropolitan University, Department of Physics,
Tokyo, Japan f
M.I. Ferrero,
V. Monaco,
R. Sacchi,
A. Solano
Università di Torino and INFN, Torino, Italy e
M. Arneodo,
M. Ruspa
Università del Piemonte Orientale, Novara, and INFN, Torino,
Italy e
S. Fourletov,
J.F. Martin
Department of Physics, University of Toronto, Toronto, Ontario,
Canada M5S 1A7 a
S.K. Boutle16,
J.M. Butterworth,
C. Gwenlan28,
R. Hall-Wilton17,
T.W. Jones,
J.H. Loizides,
M.R. Sutton28,
C. Targett-Adams,
M. Wing
Physics and Astronomy Department, University College London,
London, United Kingdom m
B. Brzozowska,
J. Ciborowski29,
G. Grzelak,
P. Kulinski,
P. Łużniak30,
J. Malka30,
R.J. Nowak,
J.M. Pawlak,
T. Tymieniecka,
A. Ukleja31,
A.F. Żarnecki
Warsaw University, Institute of Experimental Physics,
Warsaw, Poland
M. Adamus,
P. Plucinski32
Institute for Nuclear Studies, Warsaw, Poland
Y. Eisenberg,
I. Giller,
D. Hochman,
U. Karshon,
M. Rosin
Department of Particle Physics, Weizmann Institute, Rehovot,
Israel c
E. Brownson,
T. Danielson,
A. Everett,
D. Kçira,
D.D. Reeder6,
P. Ryan,
A.A. Savin,
W.H. Smith,
H. Wolfe
Department of Physics, University of Wisconsin, Madison,
Wisconsin 53706, USA n
S. Bhadra,
C.D. Catterall,
Y. Cui,
G. Hartner,
S. Menary,
U. Noor,
J. Standage,
J. Whyte
Department of Physics, York University, Ontario, Canada M3J
1P3 a
1 supported by DESY, Germany
2 also affiliated with University College London, UK
3 also at University of Hamburg, Germany, Alexander
von Humboldt Fellow
4 self-employed
5 now at Siemens, Lindau, Germany
6 retired
7 supported by Chonnam National University in 2005
8 supported by a scholarship of the World Laboratory
Björn Wiik Research Project
9 supported by the research grant no. 1 P03B 04529 (2005-2008)
10 now at DESY group FEB, Hamburg, Germany
11 now at University of Liverpool, UK
12 also at Institut of Theoretical and Experimental
Physics, Moscow, Russia
13 also at INP, Cracow, Poland
14 on leave of absence from FPACS, AGH-UST, Cracow, Poland
15 partly supported by Moscow State University, Russia
16 also affiliated with DESY
17 now at CERN, Geneva, Switzerland
18 also at University of Tokyo, Japan
19 Ramón y Cajal Fellow
20 partly supported by Russian Foundation for Basic
Research grant no. 05-02-39028-NSFC-a
21 EU Marie Curie Fellow
22 partially supported by Warsaw University, Poland
23 This material was based on work supported by the
National Science Foundation, while working at the Foundation.
24 also at Max Planck Institute, Munich, Germany, Alexander von Humboldt
Research Award
25 now at KEK, Tsukuba, Japan
26 now at Nagoya University, Japan
27 Department of Radiological Science
28 PPARC Advanced fellow
29 also at Łódź University, Poland
30 Łódź University, Poland
31 supported by the Polish Ministry for Education and Science grant no. 1
P03B 12629
32 supported by the Polish Ministry for Education and
Science grant no. 1 P03B 14129
† deceased
| a | supported by the Natural Sciences and Engineering Research Council of Canada (NSERC) |
|---|---|
| b | supported by the German Federal Ministry for Education and Research (BMBF), under contract numbers HZ1GUA 2, HZ1GUB 0, HZ1PDA 5, HZ1VFA 5 |
| c | supported in part by the MINERVA Gesellschaft für Forschung GmbH, the Israel Science Foundation (grant no. 293/02-11.2) and the U.S.-Israel Binational Science Foundation |
| d | supported by the German-Israeli Foundation and the Israel Science Foundation |
| e | supported by the Italian National Institute for Nuclear Physics (INFN) |
| f | supported by the Japanese Ministry of Education, Culture, Sports, Science and Technology (MEXT) and its grants for Scientific Research |
| g | supported by the Korean Ministry of Education and Korea Science and Engineering Foundation |
| h | supported by the Netherlands Foundation for Research on Matter (FOM) |
| i | supported by the Polish State Committee for Scientific Research, grant no. 620/E-77/SPB/DESY/P-03/DZ 117/2003-2005 and grant no. 1P03B07427/2004-2006 |
| j | partially supported by the German Federal Ministry for Education and Research (BMBF) |
| k | supported by RF Presidential grant N 8122.2006.2 for the leading scientific schools and by the Russian Ministry of Education and Science through its grant Research on High Energy Physics |
| l | supported by the Spanish Ministry of Education and Science through funds provided by CICYT |
| m | supported by the Particle Physics and Astronomy Research Council, UK |
| n | supported by the US Department of Energy |
| o | supported by the US National Science Foundation. Any opinion, findings and conclusions or recommendations expressed in this material are those of the authors and do not necessarily reflect the views of the National Science Foundation. |
| p | supported by the Polish Ministry of Science and Higher Education |
| q | supported by FNRS and its associated funds (IISN and FRIA) and by an Inter-University Attraction Poles Programme subsidised by the Belgian Federal Science Policy Office |
| r | supported by the Malaysian Ministry of Science, Technology and Innovation/Akademi Sains Malaysia grant SAGA 66-02-03-0048 |
1 Introduction
The production of charm quarks at HERA has been studied both in deep inelastic scattering (DIS) [1, 2, 3, 4, 5] and photoproduction [6, 7, 8, 9, 10]. In general, reasonable agreement is seen with next-to-leading-order (NLO) QCD predictions.
This paper presents measurements of the cross section in the range . The beampipe calorimeter of ZEUS [11, 12] was used for the measurement of the scattered lepton, which allows the first measurements of the transition region between photoproduction (photon virtuality, ) and DIS (). The cross sections are compared to the predictions of two different NLO QCD calculations, one designed for DIS, the other for the photoproduction region. This paper investigates whether the calculations remain valid in this transition region.
2 Experimental set-up
This analysis was performed with data taken from 1998 to 2000, when HERA collided electrons or positrons111Hereafter, both electrons and positrons are referred to as electrons. with energy with protons of energy . The combined data sample has an integrated luminosity of pb-1.
A detailed description of the ZEUS detector can be found elsewhere [13]. A brief outline of the components that are most relevant for this analysis is given below.
Charged particles are tracked in the central tracking detector (CTD) [14, *npps:b32:181, *nim:a338:254], which operates in a magnetic field of provided by a thin superconducting coil. The CTD consists of 72 cylindrical drift chamber layers, organized in nine superlayers covering the polar-angle222The ZEUS coordinate system is a right-handed Cartesian system, with the axis pointing in the proton beam direction, referred to as the “forward direction”, and the axis pointing left towards the centre of HERA. The coordinate origin is at the nominal interaction point. region . The transverse-momentum resolution for full-length tracks is , with in GeV.
The high-resolution uranium-scintillator calorimeter (CAL) [17, *nim:a309:101, *nim:a321:356, *nim:a336:23] consists of three parts: the forward (FCAL), the barrel (BCAL) and the rear (RCAL) calorimeters. Each part is subdivided transversely into towers and longitudinally into one electromagnetic section and either one (in RCAL) or two (in BCAL and FCAL) hadronic sections. The smallest subdivision of the calorimeter is called a cell. The CAL energy resolutions, as measured under test-beam conditions, are for electrons and for hadrons, with in GeV.
The scattered electron was detected in the beampipe calorimeter (BPC). The BPC allowed the detection of low- events, where the electron is scattered through a small angle. The BPC was used in previous measurements of the proton structure function, , at low [11, 12]. It originally consisted of two tungsten–scintillator sampling calorimeters with the front faces located at , the centre at , and the inner edge of the active area at , as close as possible to the electron-beam trajectory. At the end of 1997 one of the two BPC calorimeters was removed; hence, for the analysis in this paper, only the calorimeter located on the side of the beampipe was utilised. It had an active area of in and a depth of radiation lengths. The relative energy resolution as determined in test-beam measurements with 1 – 6 GeV electrons was .
The luminosity was measured from the rate of the bremsstrahlung process , where the photon was measured in a lead–scintillator calorimeter[21, *zfp:c63:391, *acpp:b32:2025] placed in the HERA tunnel at Z=-107m.
A three-level trigger system was used to select events online[13, 24]. At all three levels, the event was required to contain a scattered electron candidate in the BPC. Additionally, at the third level, a reconstructed candidate was required for the event to be kept for further analysis. The efficiency of the online reconstruction, determined relative to an inclusive DIS trigger, was above 95[5].
3 Kinematic reconstruction and event selection
Deep inelastic electron-proton scattering, , can be described in terms of two kinematic variables, chosen here to be and , where is the inelasticity. They are defined as and , where and are the four-momenta of the incoming electron and proton, respectively, and is the four-momentum of the scattered electron. The inelasticity, which is the fractional energy transferred to the proton in its rest frame, is related to the Bjorken scaling variable and by , where is the square of the electron-proton centre-of-mass energy of 318 GeV.
The values of and were calculated using the measured electron scattering angle and the energy deposited in the BPC as detailed in a previous analysis[11], which also describes the method used for the energy calibration of the BPC. A time dependent re-calibration of the energy response was necessary [25], as radiation damage of the scintillator resulted in a degradation of about by the end of the 2000 running period.
A series of cuts was applied to reject background. The events were required to have a primary vertex within 50 cm in of the nominal interaction point. The electron candidates in the BPC were required to have , as the trigger efficiency is low below this energy. The electron impact point on the face of the BPC was required to be more than 0.7 cm from the inner edge to ensure good shower containment. Photoproduction events were efficiently rejected by requiring the events to have , where is summed over all CAL deposits, including the scattered electron candidate in the BPC. Finally, events with an additional well-reconstructed electron candidate in the CAL with energy greater than 5 GeV were rejected to reduce background from DIS events with .
The measured kinematic region in and was restricted to the range of high acceptance, , . With these cuts, the reconstructed invariant mass of the hadronic system, , lies between 50 and 300 GeV, with a mean of 190 GeV.
4 Selection of candidates
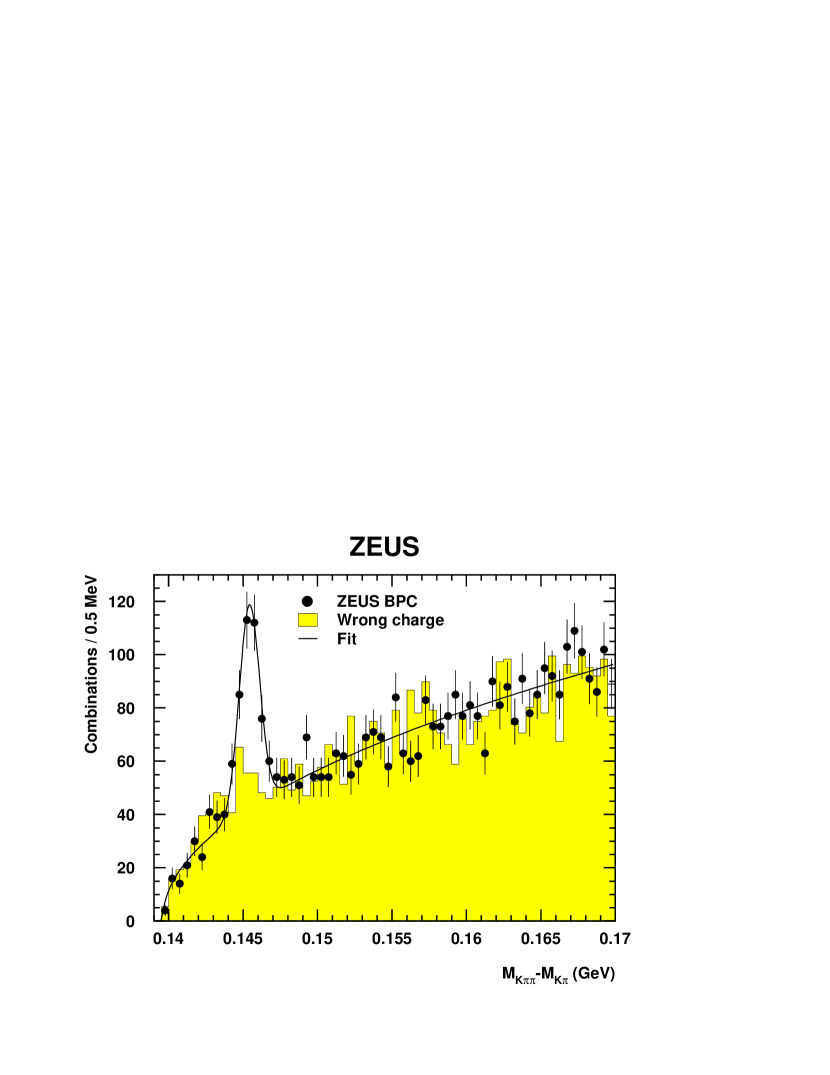
The mesons were identified using the decay channel with the subsequent decay and the corresponding antiparticle decay chain, where refers to a low-momentum (“slow”) pion accompanying the .
Charged tracks measured by the CTD and assigned to the primary event vertex333The resolution of such tracks is not good enough to separate primary and secondary vertices from and hadron decays. were selected. The transverse momentum was required to be greater than 0.12 GeV. The cut was raised to 0.25 GeV for a data subsample corresponding to , for which the low-momentum track-reconstruction efficiency was lower due to the operating conditions of the CTD[26]. Each track was required to reach at least the third superlayer of the CTD. These restrictions ensured that the track acceptance was high and the momentum resolution was good. Tracks in the CTD with opposite charges and transverse momenta were combined in pairs to form candidates. The tracks were alternately assigned the kaon and the pion mass and the invariant mass of the pair, , was determined. Each additional track, with charge opposite to that of the kaon track, was assigned the pion mass and combined with the -meson candidate to form a candidate.
A mass window for the signal region of the varying from to was used, reflecting the dependence of the CTD resolution on . The signal region for the reconstructed mass difference was . The requirement of was also applied, where is the transverse energy outside a cone of defined with respect to the proton direction. This cut rejects background without significantly affecting the signal.
The mesons were selected in the kinematic region and . The distribution for events with an electron reconstructed in the BPC is shown in Fig. 1. To extract the number of mesons, the distribution was fit using an unbinned likelihood method, with a Gaussian to describe the signal and a threshold function to describe the combinatorial background. A first estimate of the background was given by candidates with wrong-sign combinations, in which both tracks forming the candidates have the same charge and the third track has the opposite charge. These are shown as the shaded region in Fig. 1. The number of mesons obtained from the fit was .
5 Acceptance corrections and systematic uncertainties
The acceptances were calculated using the Herwig 6.1 [27, *cpc:67:465] and Rapgap 2.08 [29] Monte Carlo (MC) models. Both models simulate charm and beauty production and include contributions from both direct and resolved photoproduction. In direct photoproduction the photon participates as a point-like particle in the hard scattering process, while in resolved photoproduction a parton in the photon scatters on a parton in the proton. The generated events were passed through a full simulation of the detector, using Geant 3.13 [30] and then processed and selected with the same programs as used for the data. The CTEQ5L [31] parton density function (PDF) was used for the proton and GRV-LO [32] was used for the photon. The charm-quark mass was set to 1.5 GeV.
The Herwig predictions are in good agreement with the data distributions for both the scattered lepton and hadronic variables and so this Monte Carlo was used to correct the data for detector effects. For the kinematic region of the measurement , , , and the acceptance was . This includes the geometrical acceptance of the BPC, which was about 9%, and the reconstruction efficiency for the decay chain.
The Rapgap MC gives a similarly good representation of the data and was used to estimate part of the systematic uncertainties, as described below.
The differential cross section for a given observable was determined using
where is the number of events in a bin of size , is the acceptance (which takes into account migrations and efficiencies for that bin) and is the integrated luminosity. The product, , of the appropriate branching ratios for the and decays was set to [33].
The systematic uncertainties of the measured cross sections were determined by changing in turn the selection cuts or the analysis procedure within their uncertainties and repeating the extraction of the cross sections [34]. The major experimental sources of systematic uncertainty were (the variation of the total cross section is given in parentheses): the BPC alignment () and energy scale (); the uncertainty in the CTD momentum scale () and the CAL energy scale (); the cut () and the signal extraction (). The uncertainty due to the MC model () was determined by using Rapgap to evaluate the acceptance correction rather than Herwig, as well as by varying the fraction of resolved and direct photoproduction processes in the simulation.
All the above errors were added in quadrature separately for the positive and negative variations to determine the overall systematic uncertainty. The overall normalisation has additional uncertainties of 2.2% due to the luminosity measurement and 2.0% due to knowledge of branching ratios. These are included in the error quoted for the total cross section but not in the systematic uncertainties of the differential cross sections.
6 Theoretical predictions
Two different calculations were used to evaluate the theoretical expectation for charm production.
The HVQDIS program [35] implements an NLO calculation of charm production in DIS. At low , the hadron-like structure of the photon, not included in HVQDIS, is needed to regularise the NLO calculation. Therefore predictions from this program are expected to lose accuracy in the limit . The ZEUS measurements of production in DIS for are in good agreement with the HVQDIS prediction [5].
The FMNR program [36] implements an NLO calculation of charm photoproduction which includes the hadron-like component of the photon. Electroproduction cross sections can be obtained with FMNR using the Weizsäcker-Williams approximation [37] and are therefore expected to be reliable only at low , where this approximation is valid. The FMNR predictions are in reasonable agreement with ZEUS measurements of photoproduction [7], considering the theoretical uncertainties.
It is therefore interesting to see whether these calculations are able to reproduce the data in the transition region between photoproduction and DIS. The following parameters were used in the calculations for both programs. They were chosen to be the same as in a previous publication [5]. A variant of the ZEUS-S NLO QCD global fit [38] to structure-function data was used as the parameterisation of the proton PDFs. This fit was repeated in the fixed-flavour-number scheme, FFNS, in which the PDF has three active quark flavours in the proton, and is set to 0.363 GeV. The mass of the charm quark was set to 1.35 GeV. The renormalisation and factorisation scales were set to in HVQDIS, while for FMNR they were set to the usual choice of , where is the average transverse momentum squared of the charm quarks. The charm fragmentation to a is carried out using the Peterson function [39]. The hadronisation fraction, , was taken to be [40, *epj:c44:351] and the Peterson parameter, , was set to 0.035[42]. The parameters used here for the FMNR calculation are different from those used in a previous photoproduction analysis [7] (which used ) leading to a 20% larger predicted photoproduction cross section.
For the FMNR calculation the electroproduction cross section, , was obtained from the photoproduction cross section, , using
where
| (1) |
is the photon flux and , , , define the measurement range in and .
The NLO QCD predictions for production are affected by systematic uncertainties, which were also evaluated as in a previous ZEUS paper [5]444For the HVQDIS case, following [5], the minimum value for the scales was set to .. The sources of systematic uncertainties on the total cross section are: charm quark mass ( for HVQDIS, for FMNR); renormalisation and factorisation scale ( for HVQDIS, for FMNR); ZEUS PDF (); fragmentation (). For both programs, the systematic uncertainties were added in quadrature and are displayed as a band in the figures.
Theoretical calculations of the total charm cross section in this range can not be compared to the present data since are only measured in a limited and range.
7 Cross section measurements
The total cross section for , , and is:
where the first uncertainty is statistical, the second from systematic effects (including the luminosity uncertainty) and the third from the uncertainties in the branching ratios.
The prediction from the HVQDIS program is , in agreement with the data, while the prediction from FMNR is 555The contribution from the hadron-like component of the photon is 9%., also in good agreement.
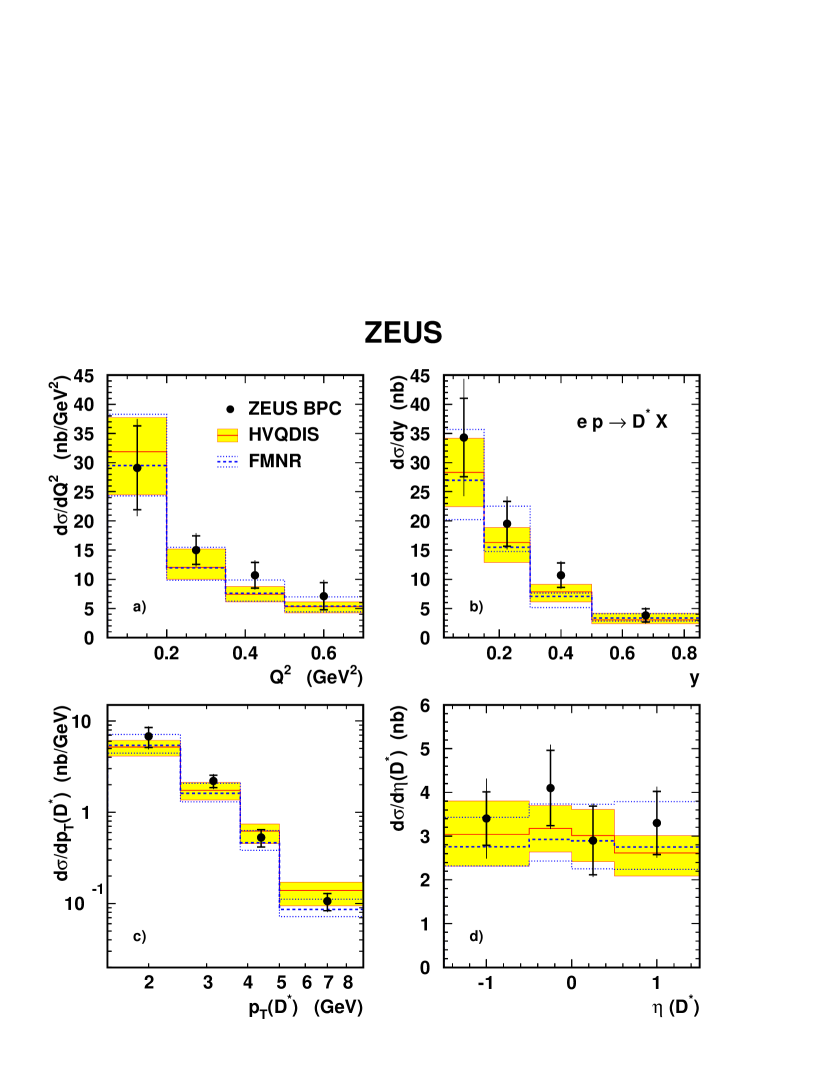
The measured differential cross sections as a function of , , and for the data are shown in Fig. 2 and given in Table 1. The predictions of the NLO calculations, including their uncertainties, are shown as bands. The measured differential cross sections are well described over the full measured kinematic region by both calculations.
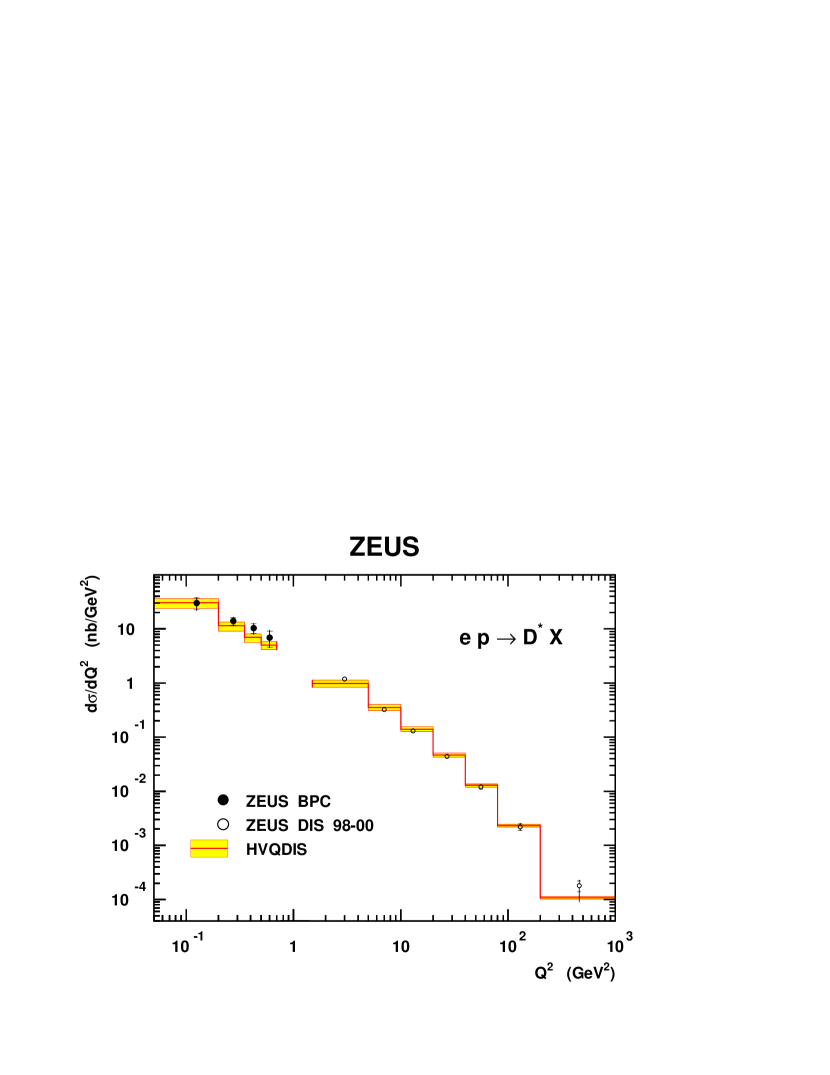
This analysis was also compared to previous ZEUS measurements of production in DIS [5] made in the kinematic region , , and . In order to directly compare with the results presented there, the cross sections were recalculated in the modified kinematic region . No correction was made for the different upper cut on , as the size of the effect is .
For this modified kinematic region, the differential cross section as a function of is presented in Fig. 3 and given in Table 2. The systematic errors were assumed to be the same as those in the full range. Figure 3 also shows the previous ZEUS measurement and the HVQDIS prediction. The combination of both measurements shows that the slope of changes with ; at high the slope is steeper than at low . The NLO calculation describes the measured data well over the full range.
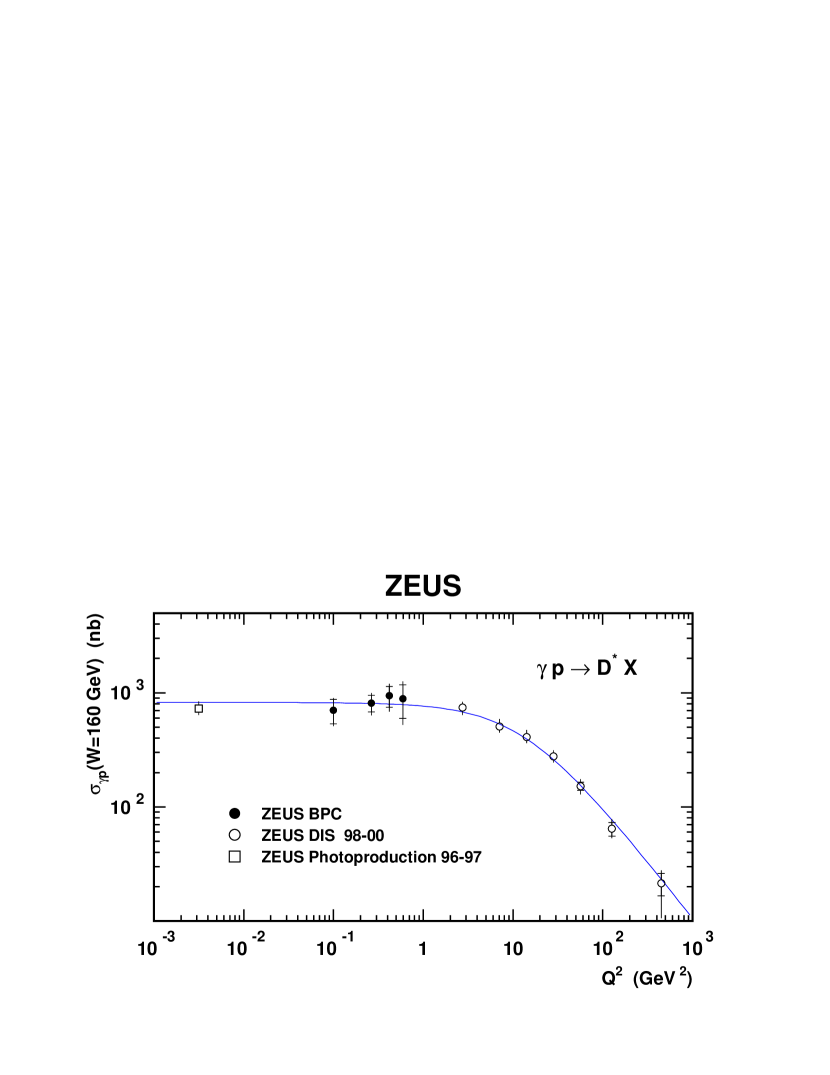
The electroproduction cross sections were converted to cross sections, , in the range and (measured in the laboratory frame) using the photon flux from Eq. 1. The cross sections are given for , which corresponds to , close to the mean of the measured cross sections. The dependence of was evaluated from the data. The uncertainty of this procedure was estimated to be 10%. A comparison of the charm photoproduction cross section [7], this measurement and the DIS cross sections [5] is shown in Fig. 4. The numbers are tabulated in Table 3. The photoproduction point was corrected for the different kinematic range and centre-of-mass energy used here using the FMNR program. As can be seen, the present measurements are consistent with the photoproduction cross section. A fit using a function of the form , where is the photoproduction cross section at and is the scale at which the cross section changes from the photoproduction value to the DIS behaviour, gives a good description of the data over the whole range with and . The value of found here for charm production is close to [43] and significantly larger than that found for inclusive data [12].
8 Conclusions
Charm production has been measured as a function of , , and in the kinematic region , , and . These measurements extend the previous ZEUS measurements in DIS to lower . The measured differential cross sections are well described by two different NLO QCD calculations: one (FMNR) is designed for the photoproduction region; while the other (HVQDIS) is designed for DIS. Both calculations predict similar cross sections in the intermediate region measured here, which agree well with the measurements. The measurements, converted to cross sections, also agree well with the photoproduction data.
Acknowledgements
We would like to thank B. Harris, E. Laenen and S. Frixione for helpful discussions on the application of QCD calculations in this intermediate regime. We thank the DESY Directorate for their strong support and encouragement. The remarkable achievements of the HERA machine group were essential for the successful completion of this work. The design, construction and installation of the ZEUS detector have been made possible by the effort of many people who are not listed as authors.
10
References
- [1] ZEUS Collaboration, J. Breitweg et al., Phys. Lett. B 407 (1997) 402
- [2] H1 Collaboration, C. Adloff et al., Nucl. Phys. B 545 (1999) 21
- [3] ZEUS Collaboration, J. Breitweg et al., Eur. Phys. J. C 12 (2000) 35
- [4] H1 Collaboration, C. Adloff et al., Phys. Lett. B 528 (2002) 199
- [5] ZEUS Collaboration, S. Chekanov et al., Phys. Rev. D 69 (2004) 012004
- [6] H1 Collaboration, S. Aid et al., Nucl. Phys. B 472 (1996) 32
- [7] ZEUS Collaboration, J. Breitweg et al., Eur. Phys. J. C 6 (1999) 67
- [8] ZEUS Collaboration, S. Chekanov et al., Nucl. Phys. B 729 (2005) 492
- [9] H1 Collaboration, A. Aktas et al., Eur. Phys. J. C 47 (2006) 597
- [10] H1 Collaboration, A. Aktas et al., Preprint hep-ex/0608042, 2006. Submitted to Eur. Phys. J. C
- [11] ZEUS Collaboration, J. Breitweg et al., Phys. Lett. B 407 (1997) 432
- [12] ZEUS Collaboration, J. Breitweg et al., Phys. Lett. B 487 (2000) 53
- [13] ZEUS Collaboration, U. Holm (ed.), The ZEUS Detector. Status Report (unpublished), DESY (1993), available on http://www-zeus.desy.de/bluebook/bluebook.html
- [14] N. Harnew et al., Nucl. Inst. Meth. A 279 (1989) 290
- [15] B. Foster et al., Nucl. Phys. Proc. Suppl. B 32 (1993) 181
- [16] B. Foster et al., Nucl. Inst. Meth. A 338 (1994) 254
- [17] M. Derrick et al., Nucl. Inst. Meth. A 309 (1991) 77
- [18] A. Andresen et al., Nucl. Inst. Meth. A 309 (1991) 101
- [19] A. Caldwell et al., Nucl. Inst. Meth. A 321 (1992) 356
- [20] A. Bernstein et al., Nucl. Inst. Meth. A 336 (1993) 23
- [21] J. Andruszków et al., Preprint DESY-92-066, DESY, 1992
- [22] ZEUS Collaboration, M. Derrick et al., Z. Phys. C 63 (1994) 391
- [23] J. Andruszków et al., Acta Phys. Pol. B 32 (2001) 2025
- [24] W.H. Smith, K. Tokushuku and L.W. Wiggers,. Proc. Computing in High-Energy Physics (CHEP), C. Verkerk and W. Wojcik (eds.), p. 222. Annecy, France, CERN (1992). Also in preprint DESY 92-150B, 1992
- [25] J. Tandler. Ph.D. Thesis, Universität Bonn, Bonn, Germany, Report BONN-IR-2003-06 (unpublished), (2003), available on http://www-zeus.physik.uni-bonn.de/german/phd.html
- [26] D.S. Bailey and R. Hall-Wilton, Nucl. Inst. Meth. A 515 (2003) 37
- [27] G. Marchesini et al., Preprint Cavendish-HEP-99/17 (hep-ph/9912396), 1999
- [28] G. Marchesini et al., Comp. Phys. Comm. 67 (1992) 465
- [29] H. Jung, Comp. Phys. Comm. 86 (1995) 147
- [30] R. Brun et al., geant3, Technical Report CERN-DD/EE/84-1, CERN, 1987
- [31] CTEQ Collaboration, H.L. Lai et al., Eur. Phys. J. C 12 (2000) 375
- [32] M. Glück, E. Reya and A. Vogt, Phys. Rev. D 46 (1992) 1973
- [33] Particle Data Group, W.-M. Yao et al., J. Phys G 33 (2006) 1
- [34] P. Irrgang. Ph.D. Thesis, Universität Bonn, Bonn, Germany, Report BONN-IR-2004-016 (unpublished), (2004), available on http://www-zeus.physik.uni-bonn.de/german/phd.html
- [35] B.W. Harris and J. Smith, Phys. Rev. D 57 (1998) 2806
- [36] S. Frixione, P. Nason and G. Ridolfi, Nucl. Phys. B 454 (1995)
- [37] S. Frixione et al., Phys. Lett. B 319 (1993) 339
- [38] ZEUS Collaboration, S. Chekanov et al., Phys. Rev. D 67 (2003) 012007
- [39] C. Peterson et al., Phys. Rev. D 27 (1983) 105
- [40] L. Gladilin, Preprint hep-ex/9912064, 1999
- [41] ZEUS Collaboration, S. Chekanov et al., Eur. Phys. J. C 44 (2005) 351
- [42] P. Nason and C. Oleari, Nucl. Phys. B 565 (2000) 245
- [43] V.M. Budnev et al., Phys. Rep. 15C (1974) 181
| bin | |||
|---|---|---|---|
| () | () | ||
| 0.05:0.20 | |||
| 0.20:0.35 | |||
| 0.35:0.50 | |||
| 0.50:0.70 | |||
| bin | |||
| ( nb) | |||
| 0.02:0.15 | |||
| 0.15:0.30 | |||
| 0.30:0.50 | |||
| 0.50:0.85 | |||
| bin | |||
| ( GeV) | () | ||
| 1.5:2.5 | |||
| 2.5:3.8 | |||
| 3.8:5.0 | |||
| 5.0:9.0 | |||
| bin | |||
| ( nb) | |||
| -1.5: -0.5 | |||
| -0.5: 0.0 | |||
| 0.0: 0.5 | |||
| 0.5: 1.5 | |||
| bin | ||
|---|---|---|
| () | () | |
| 0.05:0.20 | ||
| 0.20:0.35 | ||
| 0.35:0.50 | ||
| 0.50:0.70 | ||
| () | ( nb) | ||
|---|---|---|---|
| 0.10 | |||
| 0.26 | |||
| 0.42 | |||
| 0.59 | |||
| 2.7 | |||
| 7.1 | |||
| 14 | |||
| 28 | |||
| 57 | |||
| 130 | |||
| 450 | |||