Leading neutron energy and
distributions in deep inelastic scattering
and photoproduction at HERA
Abstract
The production of energetic neutrons in collisions has been studied with the ZEUS detector at HERA. The neutron energy and distributions were measured with a forward neutron calorimeter and tracker in a sample of inclusive deep inelastic scattering (DIS) data and a sample of photoproduction data. The neutron yield in photoproduction is suppressed relative to DIS for the lower neutron energies and the neutrons have a steeper distribution, consistent with the expectation from absorption models. The distributions are compared to HERA measurements of leading protons. The neutron energy and transverse-momentum distributions in DIS are compared to Monte Carlo simulations and to the predictions of particle exchange models. Models of pion exchange incorporating absorption and additional secondary meson exchanges give a good description of the data.
DESY–07–011
The ZEUS Collaboration
S. Chekanov1,
M. Derrick,
S. Magill,
S. Miglioranzi2,
B. Musgrave,
D. Nicholass2,
J. Repond,
R. Yoshida
Argonne National Laboratory, Argonne, Illinois 60439-4815, USA n
M.C.K. Mattingly
Andrews University, Berrien Springs, Michigan 49104-0380, USA
M. Jechow, N. Pavel †, A.G. Yagües Molina
Institut für Physik der Humboldt-Universität zu Berlin,
Berlin, Germany
S. Antonelli, P. Antonioli,
G. Bari,
M. Basile,
L. Bellagamba,
M. Bindi,
D. Boscherini,
A. Bruni,
G. Bruni,
L. Cifarelli,
F. Cindolo,
A. Contin,
M. Corradi3,
S. De Pasquale,
G. Iacobucci,
A. Margotti,
R. Nania,
A. Polini,
L. Rinaldi,
G. Sartorelli,
A. Zichichi
University and INFN Bologna, Bologna, Italy e
D. Bartsch,
I. Brock,
S. Goers4,
H. Hartmann,
E. Hilger,
H.-P. Jakob,
M. Jüngst,
O.M. Kind,
E. Paul5,
R. Renner,
U. Samson,
V. Schönberg,
R. Shehzadi,
M. Wlasenko
Physikalisches Institut der Universität Bonn,
Bonn, Germany b
N.H. Brook,
G.P. Heath,
J.D. Morris,
T. Namsoo
H.H. Wills Physics Laboratory, University of Bristol,
Bristol, United Kingdom m
M. Capua,
S. Fazio,
A. Mastroberardino,
M. Schioppa,
G. Susinno,
E. Tassi
Calabria University,
Physics Department and INFN, Cosenza, Italy e
J.Y. Kim6,
K.J. Ma7
Chonnam National University, Kwangju, South Korea g
Z.A. Ibrahim,
B. Kamaluddin,
W.A.T. Wan Abdullah
Jabatan Fizik, Universiti Malaya, 50603 Kuala Lumpur, Malaysia r
Y. Ning,
Z. Ren,
F. Sciulli
Nevis Laboratories, Columbia University, Irvington on Hudson,
New York 10027 o
J. Chwastowski,
A. Eskreys,
J. Figiel,
A. Galas,
M. Gil,
K. Olkiewicz,
P. Stopa,
L. Zawiejski
The Henryk Niewodniczanski Institute of Nuclear Physics, Polish Academy of Sciences, Cracow,
Poland i
L. Adamczyk,
T. Bołd,
I. Grabowska-Bołd,
D. Kisielewska,
J. Łukasik,
M. Przybycień,
L. Suszycki
Faculty of Physics and Applied Computer Science,
AGH-University of Science and Technology, Cracow, Poland p
A. Kotański8,
W. Słomiński
Department of Physics, Jagellonian University, Cracow, Poland
V. Adler,
U. Behrens,
I. Bloch,
C. Blohm,
A. Bonato,
K. Borras,
N. Coppola,
A. Dossanov,
J. Fourletova,
A. Geiser,
D. Gladkov,
P. Göttlicher9,
I. Gregor,
T. Haas,
W. Hain,
C. Horn,
B. Kahle,
U. Klein10,
U. Kötz,
H. Kowalski,
E. Lobodzinska,
B. Löhr,
R. Mankel,
I.-A. Melzer-Pellmann,
A. Montanari,
D. Notz,
A.E. Nuncio-Quiroz,
I. Rubinsky,
R. Santamarta,
U. Schneekloth,
A. Spiridonov11,
H. Stadie,
D. Szuba12,
J. Szuba13,
T. Theedt,
G. Wolf,
K. Wrona,
C. Youngman,
W. Zeuner
Deutsches Elektronen-Synchrotron DESY, Hamburg, Germany
W. Lohmann, S. Schlenstedt
Deutsches Elektronen-Synchrotron DESY, Zeuthen, Germany
G. Barbagli,
E. Gallo,
P. G. Pelfer
University and INFN, Florence, Italy e
A. Bamberger,
D. Dobur,
F. Karstens,
N.N. Vlasov14
Fakultät für Physik der Universität Freiburg i.Br.,
Freiburg i.Br., Germany b
P.J. Bussey,
A.T. Doyle,
W. Dunne,
J. Ferrando,
D.H. Saxon,
I.O. Skillicorn
Department of Physics and Astronomy, University of Glasgow,
Glasgow, United Kingdom m
I. Gialas15
Department of Engineering in Management and Finance, Univ. of
Aegean, Greece
T. Gosau,
U. Holm,
R. Klanner,
E. Lohrmann,
H. Salehi,
P. Schleper,
T. Schörner-Sadenius,
J. Sztuk,
K. Wichmann,
K. Wick
Hamburg University, Institute of Exp. Physics, Hamburg,
Germany b
C. Foudas,
C. Fry,
K.R. Long,
A.D. Tapper
Imperial College London, High Energy Nuclear Physics Group,
London, United Kingdom m
M. Kataoka16,
T. Matsumoto,
K. Nagano,
K. Tokushuku17,
S. Yamada,
Y. Yamazaki
Institute of Particle and Nuclear Studies, KEK,
Tsukuba, Japan f
A.N. Barakbaev,
E.G. Boos,
N.S. Pokrovskiy,
B.O. Zhautykov
Institute of Physics and Technology of Ministry of Education and
Science of Kazakhstan, Almaty, Kazakhstan
D. Son
Kyungpook National University, Center for High Energy Physics, Daegu,
South Korea g
J. de Favereau,
K. Piotrzkowski
Institut de Physique Nucléaire, Université Catholique de
Louvain, Louvain-la-Neuve, Belgium q
F. Barreiro,
C. Glasman18,
M. Jimenez,
L. Labarga,
J. del Peso,
E. Ron,
M. Soares,
J. Terrón,
M. Zambrana
Departamento de Física Teórica, Universidad Autónoma
de Madrid, Madrid, Spain l
F. Corriveau,
C. Liu,
R. Walsh,
C. Zhou
Department of Physics, McGill University,
Montréal, Québec, Canada H3A 2T8 a
T. Tsurugai
Meiji Gakuin University, Faculty of General Education,
Yokohama, Japan f
A. Antonov,
B.A. Dolgoshein,
V. Sosnovtsev,
A. Stifutkin,
S. Suchkov
Moscow Engineering Physics Institute, Moscow, Russia j
R.K. Dementiev,
P.F. Ermolov,
L.K. Gladilin,
I.I. Katkov,
L.A. Khein,
I.A. Korzhavina,
V.A. Kuzmin,
B.B. Levchenko19,
O.Yu. Lukina,
A.S. Proskuryakov,
L.M. Shcheglova,
D.S. Zotkin,
S.A. Zotkin
Moscow State University, Institute of Nuclear Physics,
Moscow, Russia k
I. Abt,
C. Büttner,
A. Caldwell,
D. Kollar,
W.B. Schmidke,
J. Sutiak
Max-Planck-Institut für Physik, München, Germany
G. Grigorescu,
A. Keramidas,
E. Koffeman,
P. Kooijman,
A. Pellegrino,
H. Tiecke,
M. Vázquez16,
L. Wiggers
NIKHEF and University of Amsterdam, Amsterdam, Netherlands h
N. Brümmer,
B. Bylsma,
L.S. Durkin,
A. Lee,
T.Y. Ling
Physics Department, Ohio State University,
Columbus, Ohio 43210 n
P.D. Allfrey,
M.A. Bell, A.M. Cooper-Sarkar,
A. Cottrell,
R.C.E. Devenish,
B. Foster,
K. Korcsak-Gorzo,
S. Patel,
V. Roberfroid20,
A. Robertson,
P.B. Straub,
C. Uribe-Estrada,
R. Walczak
Department of Physics, University of Oxford,
Oxford United Kingdom m
P. Bellan,
A. Bertolin, R. Brugnera,
R. Carlin,
R. Ciesielski,
F. Dal Corso,
S. Dusini,
A. Garfagnini,
S. Limentani,
A. Longhin,
L. Stanco,
M. Turcato
Dipartimento di Fisica dell’ Università and INFN,
Padova, Italy e
B.Y. Oh,
A. Raval,
J. Ukleja21,
J.J. Whitmore22
Department of Physics, Pennsylvania State University,
University Park, Pennsylvania 16802 o
Y. Iga
Polytechnic University, Sagamihara, Japan f
G. D’Agostini,
G. Marini,
A. Nigro
Dipartimento di Fisica, Università ’La Sapienza’ and INFN,
Rome, Italy
J.E. Cole,
J.C. Hart
Rutherford Appleton Laboratory, Chilton, Didcot, Oxon,
United Kingdom m
H. Abramowicz23,
A. Gabareen,
R. Ingbir,
S. Kananov,
A. Levy
Raymond and Beverly Sackler Faculty of Exact Sciences,
School of Physics, Tel-Aviv University, Tel-Aviv, Israel d
M. Kuze
Department of Physics, Tokyo Institute of Technology,
Tokyo, Japan f
R. Hori,
S. Kagawa24,
N. Okazaki,
S. Shimizu,
T. Tawara
Department of Physics, University of Tokyo,
Tokyo, Japan f
R. Hamatsu,
H. Kaji25,
S. Kitamura26,
O. Ota,
Y.D. Ri
Tokyo Metropolitan University, Department of Physics,
Tokyo, Japan f
M.I. Ferrero,
V. Monaco,
R. Sacchi,
A. Solano
Università di Torino and INFN, Torino, Italy e
M. Arneodo,
M. Ruspa
Università del Piemonte Orientale, Novara, and INFN, Torino,
Italy e
S. Fourletov,
J.F. Martin
Department of Physics, University of Toronto, Toronto, Ontario,
Canada M5S 1A7 a
S.K. Boutle15,
J.M. Butterworth,
C. Gwenlan27,
T.W. Jones,
J.H. Loizides,
M.R. Sutton27,
C. Targett-Adams,
M. Wing
Physics and Astronomy Department, University College London,
London, United Kingdom m
B. Brzozowska,
J. Ciborowski28,
G. Grzelak,
P. Kulinski,
P. Łużniak29,
J. Malka29,
R.J. Nowak,
J.M. Pawlak,
T. Tymieniecka,
A. Ukleja30,
A.F. Żarnecki
Warsaw University, Institute of Experimental Physics,
Warsaw, Poland
M. Adamus,
P. Plucinski31
Institute for Nuclear Studies, Warsaw, Poland
Y. Eisenberg,
I. Giller,
D. Hochman,
U. Karshon,
M. Rosin
Department of Particle Physics, Weizmann Institute, Rehovot,
Israel c
E. Brownson,
T. Danielson,
A. Everett,
D. Kçira,
D.D. Reeder5,
P. Ryan,
A.A. Savin,
W.H. Smith,
H. Wolfe
Department of Physics, University of Wisconsin, Madison,
Wisconsin 53706, USA n
S. Bhadra,
C.D. Catterall,
Y. Cui,
G. Hartner,
S. Menary,
U. Noor,
J. Standage,
J. Whyte
Department of Physics, York University, Ontario, Canada M3J
1P3 a
1 supported by DESY, Germany
2 also affiliated with University College London, UK
3 also at University of Hamburg, Germany, Alexander
von Humboldt Fellow
4 self-employed
5 retired
6 supported by Chonnam National University in 2005
7 supported by a scholarship of the World Laboratory
Björn Wiik Research Project
8 supported by the research grant no. 1 P03B 04529 (2005-2008)
9 now at DESY group FEB, Hamburg, Germany
10 now at University of Liverpool, UK
11 also at Institut of Theoretical and Experimental
Physics, Moscow, Russia
12 also at INP, Cracow, Poland
13 on leave of absence from FPACS, AGH-UST, Cracow, Poland
14 partly supported by Moscow State University, Russia
15 also affiliated with DESY
16 now at CERN, Geneva, Switzerland
17 also at University of Tokyo, Japan
18 Ramón y Cajal Fellow
19 partly supported by Russian Foundation for Basic
Research grant no. 05-02-39028-NSFC-a
20 EU Marie Curie Fellow
21 partially supported by Warsaw University, Poland
22 This material was based on work supported by the
National Science Foundation, while working at the Foundation.
23 also at Max Planck Institute, Munich, Germany, Alexander von Humboldt
Research Award
24 now at KEK, Tsukuba, Japan
25 now at Nagoya University, Japan
26 Department of Radiological Science
27 PPARC Advanced fellow
28 also at Łódź University, Poland
29 Łódź University, Poland
30 supported by the Polish Ministry for Education and Science grant no. 1
P03B 12629
31 supported by the Polish Ministry for Education and
Science grant no. 1 P03B 14129
† deceased
| a | supported by the Natural Sciences and Engineering Research Council of Canada (NSERC) |
|---|---|
| b | supported by the German Federal Ministry for Education and Research (BMBF), under contract numbers HZ1GUA 2, HZ1GUB 0, HZ1PDA 5, HZ1VFA 5 |
| c | supported in part by the MINERVA Gesellschaft für Forschung GmbH, the Israel Science Foundation (grant no. 293/02-11.2) and the U.S.-Israel Binational Science Foundation |
| d | supported by the German-Israeli Foundation and the Israel Science Foundation |
| e | supported by the Italian National Institute for Nuclear Physics (INFN) |
| f | supported by the Japanese Ministry of Education, Culture, Sports, Science and Technology (MEXT) and its grants for Scientific Research |
| g | supported by the Korean Ministry of Education and Korea Science and Engineering Foundation |
| h | supported by the Netherlands Foundation for Research on Matter (FOM) |
| i | supported by the Polish State Committee for Scientific Research, grant no. 620/E-77/SPB/DESY/P-03/DZ 117/2003-2005 and grant no. 1P03B07427/2004-2006 |
| j | partially supported by the German Federal Ministry for Education and Research (BMBF) |
| k | supported by RF Presidential grant N 8122.2006.2 for the leading scientific schools and by the Russian Ministry of Education and Science through its grant Research on High Energy Physics |
| l | supported by the Spanish Ministry of Education and Science through funds provided by CICYT |
| m | supported by the Particle Physics and Astronomy Research Council, UK |
| n | supported by the US Department of Energy |
| o | supported by the US National Science Foundation. Any opinion, findings and conclusions or recommendations expressed in this material are those of the authors and do not necessarily reflect the views of the National Science Foundation. |
| p | supported by the Polish Ministry of Science and Higher Education |
| q | supported by FNRS and its associated funds (IISN and FRIA) and by an Inter-University Attraction Poles Programme subsidised by the Belgian Federal Science Policy Office |
| r | supported by the Malaysian Ministry of Science, Technology and Innovation/Akademi Sains Malaysia grant SAGA 66-02-03-0048 |
1 Introduction
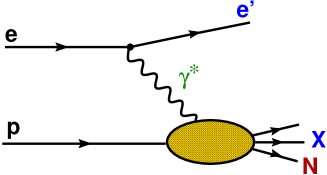
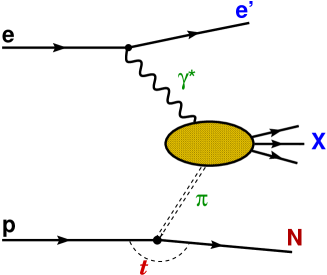
In scattering at HERA, a significant fraction of events contains a low-transverse-momentum baryon carrying a large fraction of the incoming proton energy [1, *epj:c6:587, 3, 4, *epj:c41:273, 6, 7, *pl:b590:143, *pl:b610:199]. Although the production mechanism of these leading baryons is not completely understood, exchange models (Fig. 1) give a reasonable description of the data. In this picture, the incoming proton emits a virtual particle which scatters on the photon emitted from the beam electron. The outgoing baryon, of energy , carries a fraction of the beam energy, while the exchanged particle participates in the process with energy .
In particular, one-pion exchange is a significant contributor to leading neutron production for large [1, *epj:c6:587, 3]. For such a process the cross section for the semi-inclusive reaction factorizes into two terms (Regge factorization [10]):
where is the virtuality of the exchanged photon, is the center-of-mass energy of the virtual photon-proton system and is the square of the four-momentum of the exchanged pion. In terms of the measured quantities and transverse momentum , the pion virtuality is:
The flux of virtual pions emitted by the proton is represented by and is the cross section of the virtual-photon and virtual-pion interaction at center-of-mass energy . If the cross section is independent of , the distribution of produced neutrons is completely determined by the flux factor.
Many parameterizations of the pion flux have been suggested in the literature [10, 11, *GKS, 13, 14, *PSI, *MST, 17, 18]. They have the general form:
The power and the form factor are model dependent with parameters that can be extracted from hadron-hadron scattering data.
Comparisons between cross sections for the production of particles in the fragmentation region of a target nucleon provide tests of the concepts of vertex factorization and limiting fragmentation [19, *pr:d50:590]. The hypothesis of limiting fragmentation states that, in the high-energy limit, the production of particles in the proton target-fragmentation region is independent of the nature of the incident projectile. For leading neutron production in scattering, where the projectile is the exchanged virtual photon, this implies that the dependence of the cross section on the lepton variables should be independent of the baryon variables . For such vertex factorization, the cross section can be written as
where and are arbitrary functions. The Regge factorization introduced earlier violates this vertex factorization because of the dependence of on in addition to and . Factorization tests involve comparing semi-inclusive rates, normalized to their respective total cross sections, to study whether particle production from a given target is independent of the lepton variables.
In exchange models, neutron absorption can occur through rescattering [21, 22, 23, 24]. In a geometrical picture [22], if the size of the - system is small compared to the size of the photon, the neutron can also scatter on the photon. The neutron may migrate to lower and higher such that it is outside of the detector acceptance. The rescattering can also transform the neutron into a charged baryon which may also escape detection. Since the size of the virtual photon is inversely related to , more neutron rescattering would be expected for photoproduction () than for deep inelastic scattering (DIS, ). A previous study [3] showed a mild violation of vertex factorization with the expected increase of rate when going from photoproduction to DIS. Similar effects have also been seen for leading protons [4]. The size of the - system is inversely proportional to the neutron , so rescattering removes neutrons with large . Thus rescattering results in a depletion of high neutrons in photoproduction relative to DIS: a violation of vertex factorization. Pion-exchange models [10, 11, *GKS, 13, 14, *PSI, *MST, 17, 18] incorporate a variation of the mean size of the - system as a function of . This results in an dependence of the absorption, again a violation of vertex factorization.
Absorption is a key ingredient in calculations of gap-survival probability in interactions at the LHC, critical in interpreting hard diffractive processes, including central exclusive Higgs production. The most recent absorption model calculations [23, 24], based on multi-Pomeron exchanges, gave a good description of previous leading-neutron results on absorption [3].
This paper presents measurements of the and distributions of leading neutrons coming from samples of DIS and photoproduction processes, with more than seven times higher statistics and smaller systematic uncertainties than the previous ZEUS publication [3]. The and distributions in DIS and photoproduction are compared as a test of vertex factorization. The neutron measurements are compared to similar measurements of leading protons at HERA. The data are also compared to the predictions of several Monte Carlo (MC) models. The neutron distributions in DIS are compared to several pion-exchange models with various choices of their parameters. Finally, the and distributions in photoproduction and DIS are compared to models incorporating pion exchange and rescattering, and a model that also includes secondary meson exchanges.
2 Detectors
A detailed description of the ZEUS detector can be found elsewhere [25]. A brief outline of the components that are most relevant for this analysis is given below.
The high-resolution uranium–scintillator calorimeter (CAL) [26, *nim:a309:101, *nim:a321:356, *nim:a336:23] consists of three parts: the forward (FCAL), the barrel (BCAL) and the rear (RCAL) calorimeters. Each part is subdivided transversely into towers and longitudinally into one electromagnetic section (EMC) and either one (in RCAL) or two (in BCAL and FCAL) hadronic sections (HAC). The smallest subdivision of the calorimeter is called a cell. The CAL energy resolutions, as measured under test-beam conditions, are for electrons and for hadrons ( in GeV). The EMC sections were used to detect scattered positrons in DIS events and the RCAL was used to trigger on the dissociated photon in photoproduction events.
Bremsstrahlung, , and the photoproduction of hadrons, , are tagged using the luminosity detectors [30, *zfp:c63:391, *acpp:b32:2025]. The bremsstrahlung photons are measured with a lead-scintillator calorimeter located at 111The ZEUS coordinate system is a right-handed Cartesian system, with the axis pointing in the proton beam direction, referred to as the “forward direction”, and the axis pointing towards the center of HERA. The coordinate origin is at the nominal interaction point. from the interaction point in the positron-beam direction. The positron tagger was a similar calorimeter at from the interaction point with an energy resolution of ( in GeV). It was used to measure positrons scattered at very small angles in an energy range of 5-20 GeV.
The forward neutron calorimeter (FNC) [33, *nim:a394:121, *proc:calor97:295] was installed in the HERA tunnel at degrees and at from the interaction point in the proton-beam direction, as depicted in Fig. 2. It was used for the 1995-2000 data taking. The FNC was a lead-scintillator calorimeter with an energy resolution for hadrons measured in a test beam to be ( in GeV). The calorimeter was segmented vertically into 14 towers as shown in Fig. 3. Three planes of veto counters were located in front of the FNC to reject events in which a particle showered in dead material along the beamline upstream of the FNC.
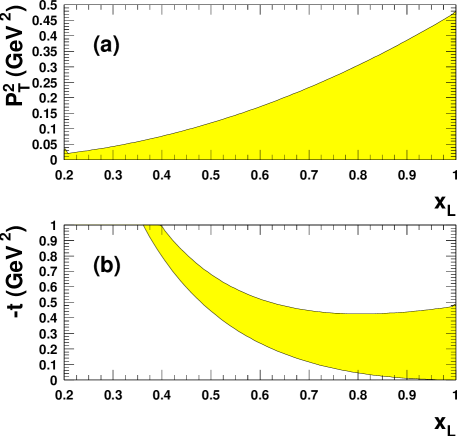
In 1998 a forward neutron tracker (FNT) was installed in the FNC at a depth of one interaction length. It was a scintillator hodoscope designed to measure the position of neutron showers. Each scintillator finger was 16.8 cm long, 1.2 cm wide and 0.5 cm deep; 17 were used for position reconstruction and 15 for . Figure 3 shows the position of the FNT hodoscope in the FNC relative to the incoming neutron beam. The irregular outlined area indicates the geometric acceptance defined by magnet apertures. This limited detection to neutrons with production angles less than , allowing transverse momenta in the range . The resulting kinematic regions in and are shown in Fig. 4.
Scans by a radioactive source and data from frequent proton beam-gas runs were used to calibrate and monitor both detectors. The relative calibration between FNC towers was adjusted using position information from the FNT. The energy scale of the FNC was determined with a systematic uncertainty of from fits to the endpoint of the neutron energy spectrum near . The minimum-ionizing-particle (mip) scale in the veto counters was determined by selecting electromagnetic showers in the FNC, a large fraction of which were converted photons which deposited a 2-mip signal in the counters. The position resolution of neutron showers in the FNT of was measured by placing an adjustable collimator in front of the outermost veto counter of the FNC during special test and calibration runs.
3 Data selection and analysis
The data for this analysis were collected in 2000 when HERA collided positrons with protons, giving an center-of-mass energy . Separate triggers were used to collect DIS and photoproduction events with leading neutrons.
3.1 Data selection
The DIS events were collected using a trigger that required the detection of the scattered positron in the CAL. In the offline analysis, the scattered positron was required to have energy and to be at least 3 cm from the inner edge of the beam-pipe hole in the RCAL. The quantity , with the sum running over all calorimeter cells, was required to be in the range ; the lower cut reduced photoproduction background with a misidentified positron. These cuts resulted in a clean sample of DIS events in the kinematic range with a mean photon virtuality of . For further studies, the variable was reconstructed using the double angle (DA) method [36]. This method requires a certain amount of hadronic activity in the CAL in order to measure the angle of the hadronic system. To ensure this, an additional requirement was imposed for those measurements requiring reconstruction. Here is the inelasticity reconstructed using the Jacquet-Blondel (JB) method [37]. The integrated luminosity of the DIS sample was approximately .
The photoproduction events were collected during the last part of the 2000 running period using a trigger that required at least in the positron tagger in coincidence with at least in the RCAL EMC [38]. The acceptance of the positron tagger limited the photon virtuality to , with a mean of approximately . Offline, the total energy per event deposited in the photon tagger was required to be less than in order to reject overlapping bremsstrahlung events. The integrated luminosity of the photoproduction sample was approximately .
The DIS and photoproduction triggers required at least of energy to be deposited in the FNC. Good FNC neutron candidates were required offline to satisfy the following conditions:
- •
-
•
the veto counter had a signal of less than one mip, to reject showers which started in dead material upstream of the FNC; to minimize effects of backsplash from hadronic showers, only the veto counter farthest from the FNC was used;
-
•
no signal in the veto counter consistent with a shower from a previous bunch crossing, to reject pile-up energy deposits;
-
•
the timing information from the FNC consistent with the triggered bunch;
-
•
energy sharing among the towers was used to reject electromagnetic showers from high-energy photons.
These cuts, similar to those used in the previous ZEUS measurements [3, 7, *pl:b590:143, *pl:b610:199], selected long-lived neutral hadrons which had not interacted with material before reaching the FNC. The sample was predominantly neutrons, with a small component of hadrons. The MC models Rapgap with pion exchange [39] and Lepto with soft color interactions [40] predict that the contribution is less than 2% above , and increases slowly to approximately 20% at .
The above selection was used for the measurements. For results requiring also a measurement of , the following additional requirements were imposed to ensure a well reconstructed position measurement in the FNT:
-
•
the highest pulse-height channel in each of the hodoscope planes was above the pedestal level, to select neutrons which showered before the FNT plane;
-
•
shower profiles with more than one peak were rejected, to eliminate mismeasurement from shower fluctuations.
The fraction of clean FNC neutrons passing the FNT cuts determined the FNT efficiency as a function of . The efficiency rises with neutron energy from 35% at to 63% at , corresponding to the fraction of neutrons that shower before the FNT.
3.2 Normalization
The cross sections for leading neutron production presented here, , were normalized to the inclusive cross sections without a leading-neutron requirement, , as:
Variations of this relative neutron yield, , with or indicate differences in the neutron-production mechanism. The acceptance for detecting different types of events in the central ZEUS detector in a small kinematic region of is independent of the neutron requirement; the acceptance cancels in the yield , so that:
Here is the number of inclusive events in the sample and is the number of these events with a neutron tag, corrected for the acceptance of the forward neutron detectors. The acceptance of the central ZEUS detector varies with ; if the neutron-tagged and inclusive events have different kinematic dependences, their acceptances integrated over a given region would be different. The mild violation of vertex factorization observed in the previous ZEUS measurement [3] indicates that such differences in acceptance are less than 2%, and so were ignored. Thus the acceptance of the central ZEUS detector and associated systematic uncertainties do not affect the neutron yield. Only the acceptance of the forward neutron detectors together with its systematic uncertainties are relevant for measuring .
For the DIS sample, a set of inclusive events was collected simultaneously and used to normalize the neutron data. For the inclusive photoproduction events, of data were collected in a special run in 1996 when the proton beam energy was , for measurement of the photon-proton total cross section [38]. The normalization of the 2000 photoproduction data was determined by assuming that the ratio of the photoproduction and DIS neutron yields, for any given neutron kinematic region, was the same at the two proton beam energies:
In this equation was measured in the 1996 inclusive photoproduction sample, was measured in inclusive DIS data from the same running period and was measured in the inclusive DIS data from the 2000 running period. The neutron kinematic region for the measured yields was and . This normalization procedure resulted in an uncertainty on the neutron yield in photoproduction of 5.1%, predominantly from the limited statistics of the 1996 photoproduction data.
3.3 Beamline and forward-detector simulation
The acceptance of the forward neutron detectors, for the measurement of neutron yields, was determined from a simple one-particle MC simulation. The simulation accounts for the aperture and dead material along the neutron flight path, the measured proton beam position and spread, and the measured detector resolutions.
Figure 5 shows a scatter plot of reconstructed hits in the FNT from a sample of DIS events. The irregular curve is the aperture expected from the MC simulation. Numerous events are reconstructed outside of the aperture, as the aperture is not a sharp boundary as modeled, but presents a varying amount of dead material over several millimeters transverse to the neutron flight path. The effect of this on the measured neutron yield is less than 2% and was ignored.
The simulation also modeled significant amounts of dead material along the neutron flight path, primarily from stations S5 and S6 of the ZEUS leading proton spectrometer (LPS) shown in Fig. 2. The LPS was a set of Roman pots used to measure protons scattered at very low angles [41]. The elements of these stations were measured after the LPS was removed from the HERA tunnel in 2000 and implemented in the simulation. The positions of these elements in the simulation were adjusted to reproduce the data. For example, the deficit of events observed near , seen clearly in the vertical slice of the scatter plot in Fig. 6, determined the vertical alignment of the LPS. There is good agreement between the simulation and the data distributions.
During operation, the LPS was normally in one of two positions: extracted, or inserted for data taking. Separate dead material maps were made for the two positions. Data collected during periods when the LPS was moving were rejected. The results were determined separately for the two LPS positions and combined according to the luminosity taken in each position. The difference with the results obtained for each position was taken as a measure of the systematic uncertainty from the dead material map.
The reconstruction of the neutron scattering angle, , requires knowledge of the zero-degree point. This was determined by generating a symmetric distribution of neutrons, passing it through the simulation, and fitting the reconstructed distribution to the data. An example of such a fit for the zero-degree position in the vertical plane is shown in Fig. 6. Considering different input distributions, and taking into account the uncertainties in the dead material map, the beam zero-degree point was determined to an accuracy of in both and .
The simulation also takes into account the energy resolution of the FNC, the position resolution of the FNT, and the inherent -spread of the HERA proton beam. The latter was measured in the reaction , with the decay products measured in the ZEUS central detector and the final-state proton measured with the LPS [41]. The beam -spread corresponds to a smearing of the zero-degree point by 0.45 cm horizontally and 1.0 cm vertically, significantly larger than the FNT resolution. The spectrum of generated neutrons was tuned to match the and distributions separately for the DIS and photoproduction samples.
These MC distributions were then used to correct the data for all acceptance and smearing effects. For distributions requiring a position measurement, the correction for the -dependent FNT efficiency was also applied.
3.4 Systematic uncertainties
The dominant effects contributing to the systematic uncertainties arose from:
-
•
the beam zero-degree point;
-
•
the dead material map;
-
•
the FNC energy scale;
-
•
the distributions, input for -distribution acceptance.
The systematic uncertainties were typically 5–10% of the measured quantities, and are shown as shaded bands in the figures. The variation of the energy scale shifted the points in . The other systematic variations amount to a change in acceptance resulting in a correlated shift of the neutron yields. The small uncertainties from the assumption of acceptance cancellation in and from the aperture edge were ignored.
Corrections for efficiency of the cuts and backgrounds were applied to the normalization of the neutron yields. The corrections, similar to those of the previous ZEUS measurement [3], were:
-
•
false veto counter firing: , determined from randomly triggered events;
-
•
veto counter inefficiency: , determined from 2-mip distributions in the veto counter;
-
•
backsplash from neutron showers: , determined from timing information in the veto counter giving the fraction of late time vetoes;
-
•
neutrons from proton beam-gas interactions: , determined from randomly triggered events.
The overall systematic uncertainty on the normalization of the neutron yield from these corrections, not included in the shaded bands of the figures, was . The yield in photoproduction has an additional uncertainty of from the normalization procedure described in Section 3.2.
4 Results
4.1 Neutron and distributions in DIS
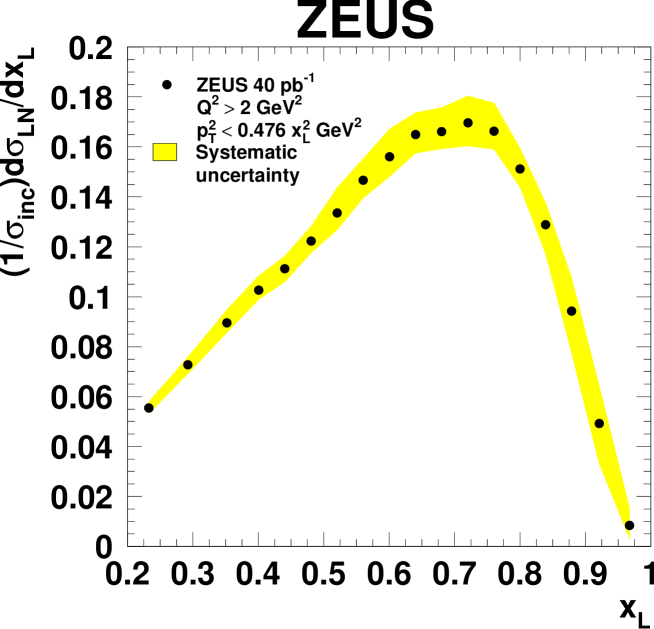
Figure 7 shows the normalized differential distribution for neutrons in DIS with scattering angles , corresponding to the kinematic range . It rises from the lowest due to the increase in space, reaches a maximum near , and falls to zero at the endpoint . These results are consistent with the previous ZEUS measurement [3]. Integrating this distribution, the total leading-neutron yield for the measured region is:
Here the systematic uncertainty includes the overall scale uncertainty.
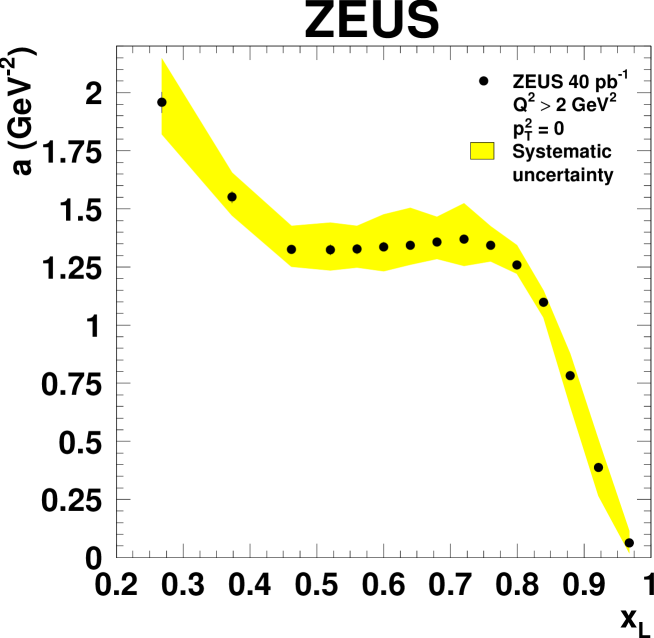
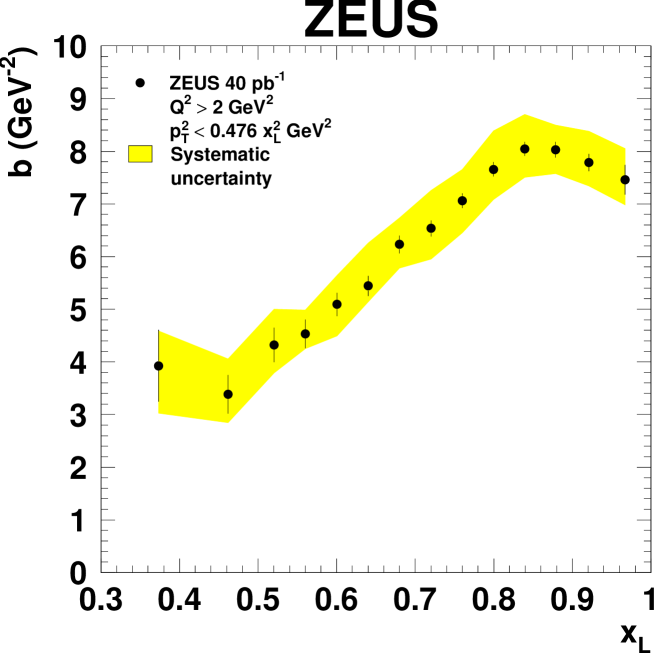
The corrected distributions in DIS for different bins are shown in Fig. 8 and summarized in Table 1. They are presented as normalized doubly differential distributions . The bins in are at least as large as the resolution, which is dominated by the spread of the proton beam. The varying ranges of the plots are due to the aperture limitation. The line on each plot is a fit to the functional form . The distributions are compatible with a single exponential within the statistical and uncorrelated systematic uncertainties. Thus, with the parameterization
the neutron distribution is fully characterized by the slopes and intercepts . The dependences of the intercepts and the slopes on are shown in Figs. 9 and 10 and summarized in Table 2. The systematic uncertainties were evaluated by making the variations listed in Section 3.4 and repeating the fits. The intercepts fall rapidly from the lowest , are roughly constant in the region -, and fall to zero at the endpoint . Below , the slopes are consistent with zero and are not plotted; they rise linearly in the range to a value of , and then decrease slightly at higher . Figure 11 shows the ratio for the region where , which can be taken as the leading-neutron yield integrated over values from zero to infinity, assuming that the distributions remain an exponential also beyond the measured range. This distribution, integrated over in the range , corresponds to a yield:
Here the systematic uncertainty includes the overall 2.1% scale uncertainty.
4.2 dependence of leading neutron production
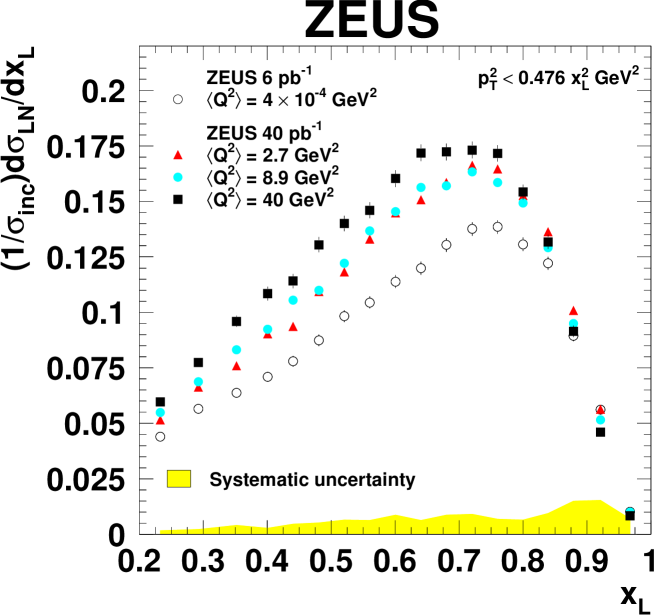
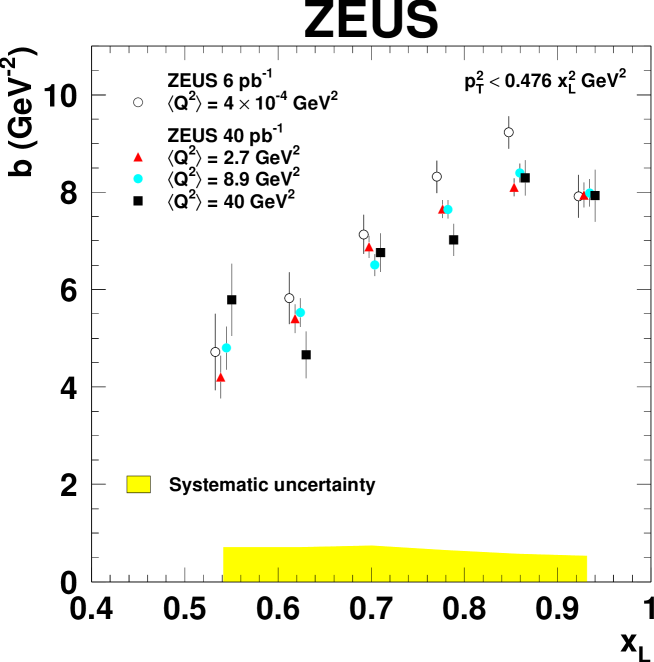
To investigate the dependence of leading-neutron production, the full DIS sample was divided into three subsamples depending on the range, with the additional cut . The kinematic regions in and for all DIS and photoproduction samples are summarized in Table 3.
Figure 12 shows the distributions and Fig. 13 the slopes in the range for the photoproduction and three DIS subsamples. There is a trend of increasing neutron yield with increasing , a clear violation of vertex factorization. There is a large increase between the photoproduction region and the low- and mid- DIS regions, in which the data are nearly independent. There is then a smaller, but significant, increase between the mid- and high- regions. The effect of the different ranges for the DIS and photoproduction samples on the neutron yield was less than 5%, as evaluated by restricting the DIS sample to low- and high- regions. The slopes for all three DIS samples are equal within the uncertainties. The slopes for photoproduction are higher in the region .
The total neutron yields integrated over for the four samples are summarized in Table 4. The doubly differential distributions for the photoproduction and three DIS subsamples are summarized in Table 5, and the intercepts and slopes of the exponential fits are summarized in Table 6.
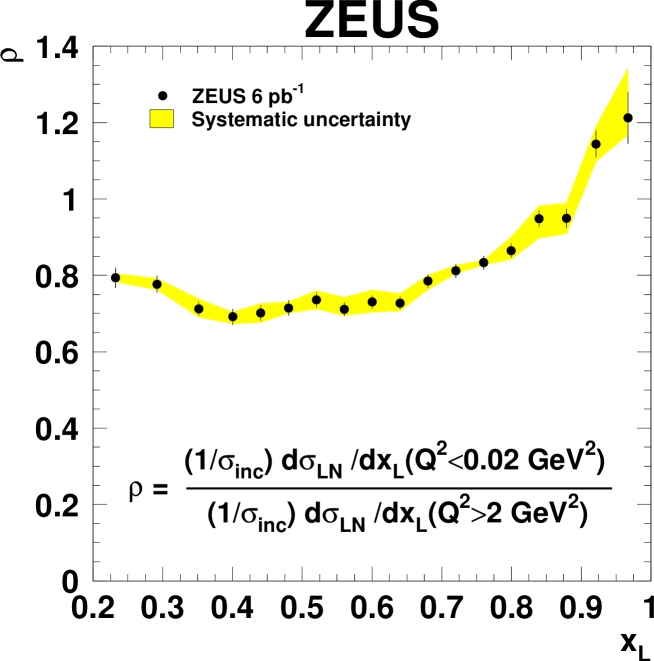
To investigate the differences between the photoproduction and DIS regimes further, the effects of energy calibration and beam position drifts were minimized by using only the subset of DIS data collected simultaneously with the photoproduction data. The DIS sample without or cuts was used to maximize the statistical precision of the comparison.
The ratio of the normalized differential distributions
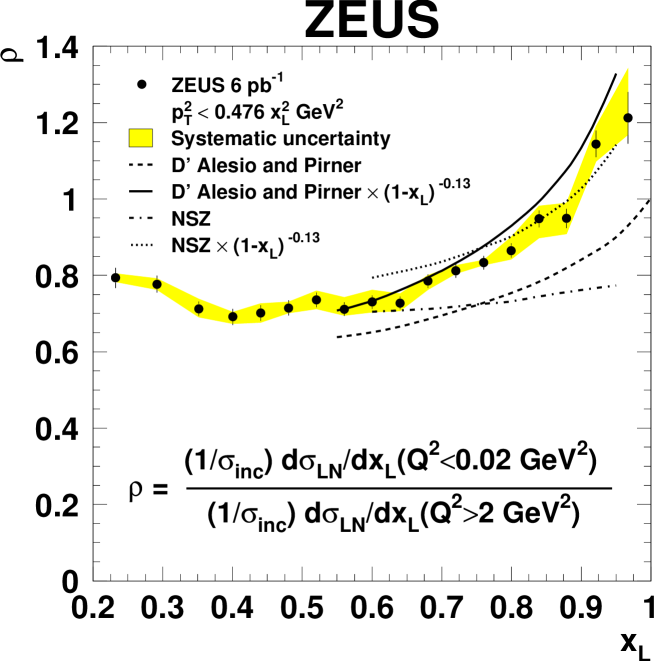
for the region is shown in Fig. 14. In the range , the ratio drops slightly but rises for higher values, exceeding unity for . The deviation of the ratio from unity is a clear violation of vertex factorization. The ratio of the intercepts for photoproduction and DIS, which has a nearly identical behavior to that of Fig. 14, is not shown.
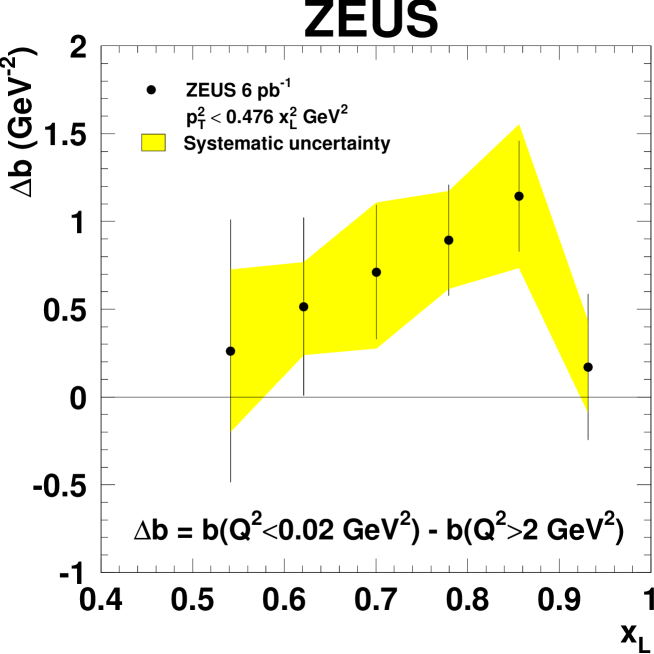
The distributions for both samples, normalized to unity at , are shown in Fig. 15. The photoproduction distributions are steeper in the range , with relatively fewer neutrons at high . The difference of the slopes is less sensitive to systematic effects than each of the individual slopes. These values are plotted in Fig. 16. The slopes for photoproduction are larger in the range , with 0.5–1.0 , qualitatively consistent with the violation of vertex factorization expected from absorption as discussed in the introduction.
4.3 Comparison to leading protons
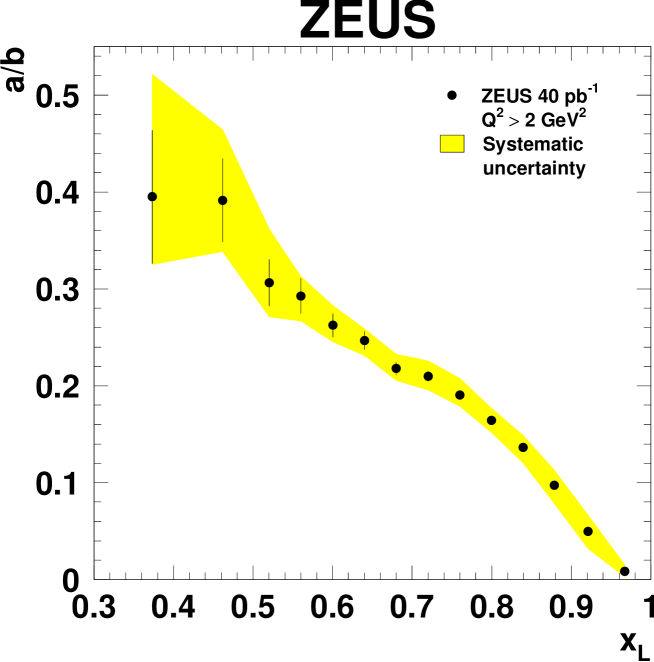
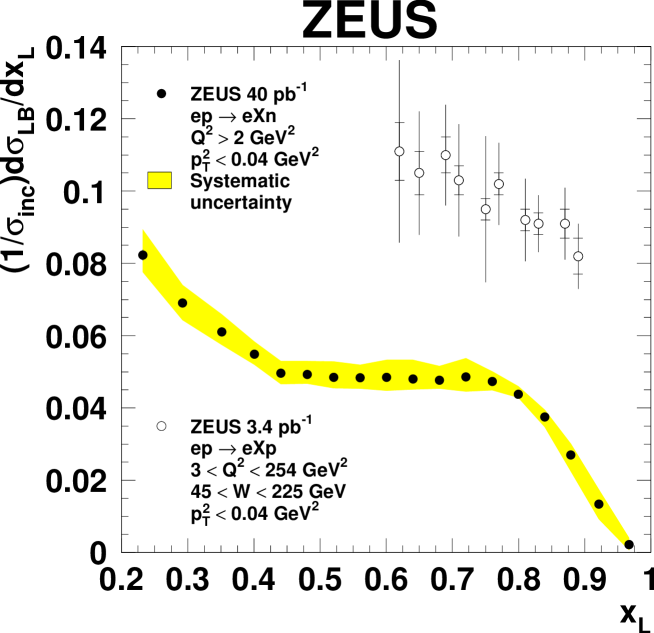
ZEUS has also reported distributions for leading protons in the kinematic region [6]. The neutron distributions were also measured in the same region, using the FNT measurement of . The results for DIS are compared in Fig. 17. There are approximately twice as many protons as neutrons in the range . If only isospin-1 particle exchanges contributed to proton production, there should be half as many protons as neutrons. Thus, exchanges of particles with different isospins such as isoscalars must be invoked to account for the observed proton rate [18].
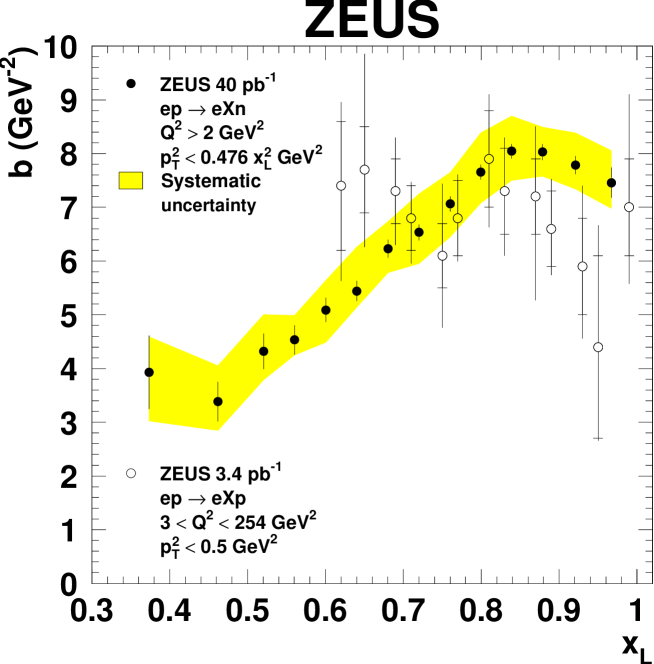
The slopes of the distributions for leading protons and neutrons in DIS are shown in Fig. 18. Note that the range for the proton measurement, , is larger than for the neutron measurement. The two samples have similar values of near , the region where pion exchange is expected to dominate for both processes [18].
5 Comparison to models
In this section the data are compared to several models. First the data are compared to various MC models for the simulation of DIS events. A comparison is then made to models incorporating only pion exchange. Next, more sophisticated models including the effects of absorption of the neutron are considered. Finally, a model incorporating enhanced absorption with pion and additional secondary Regge exchanges is discussed.
5.1 Monte Carlo models
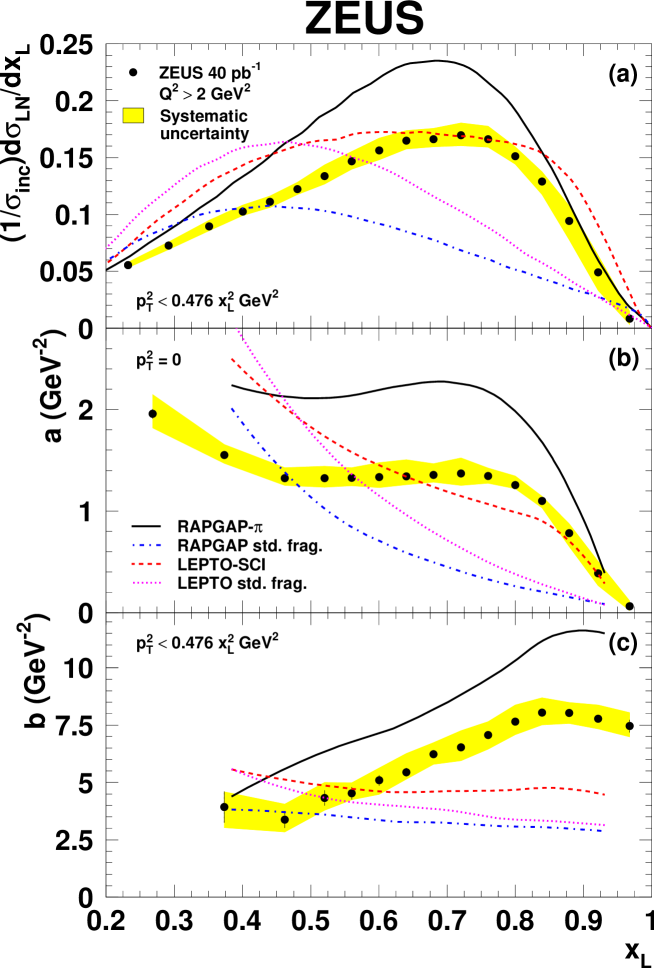
Most MC models generate leading neutrons from the fragmentation of the proton remnant [42]. Some models also incorporate additional processes to simulate diffraction and leading baryon production. The leading neutron distribution, intercepts and slopes in DIS are compared to two MC models in Fig. 19. The models presented here are Rapgap [39] and Lepto [43]. The proton PDF parameterization used was CTEQ5L [44]. With only standard proton-remnant fragmentation, the models are lower than the data in the normalization of the distribution and intercepts, and are peaked at lower . They do not show the observed dependence of the slopes. Other models incorporating only standard fragmentation, Ariadne [45] and Cascade [46] for DIS, and Pythia [47] and Phojet [48] for photoproduction, give a similarly poor description of the data.
Lepto has the option to implement soft color interactions (SCI) [40] to produce rapidity gaps observed in diffractive events. This model gives a qualitative description of the leading proton distribution [6], including the diffractive peak, although it predicts too few protons in the central region. The predictions for leading neutrons, with the probability of SCI set to 0.5, are shown in Fig. 19. Lepto SCI comes close to the data in the shape and normalization of the distribution. The intercepts also exhibit a shoulder in the distribution near similar to that in the data. It does not, however, give the observed strong dependence of the slopes.
Rapgap also includes Pomeron exchange to simulate diffractive events, and pion exchange to simulate leading baryon production. These processes are mixed with standard fragmentation according to their respective cross sections. The PDF parameterizations used here were the H1 LO fit 2 [49] for the Pomeron and GRV-P LO fit [50] for the pion. The predictions for leading neutrons from a mixture of these exchanges and standard fragmentation are also shown in Fig. 19. The model well reproduces the shape of the distribution and intercepts, although it predicts more neutrons than are observed. The model also shows the strong dependence of the slopes in the data, although the predicted values of the slopes are systematically larger than the data.
5.2 Pure pion exchange
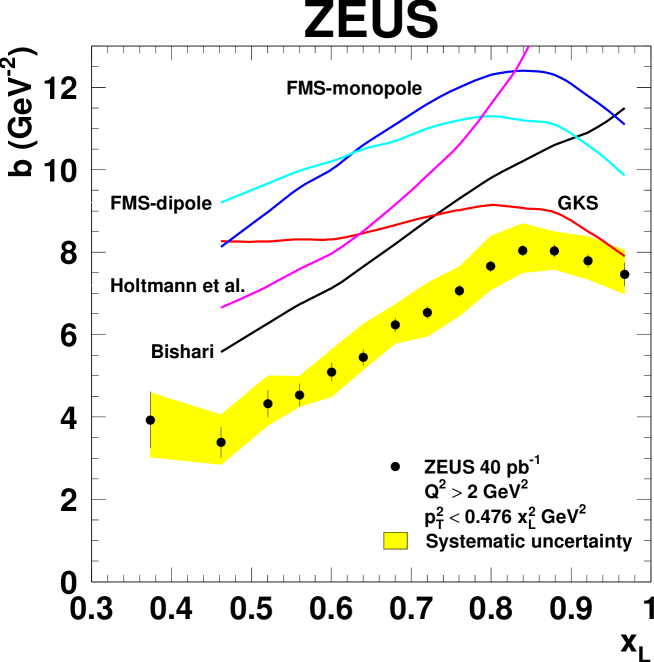
In the Regge factorization relation discussed in the introduction, the leading neutron distribution is a product of the pion flux, , and the cross section, . However, if is assumed to be independent of , the distribution of the produced neutrons is determined only by the pion flux . The slopes can be compared to various parameterizations of the flux. Although is not an exponential in , at fixed the models can be fit to the form using the same binning as the data, and the resulting values compared to the measurements. All of the parameterizations in the literature [10, 11, *GKS, 13, 14, *PSI, *MST, *SSS, 18] give values for the slopes larger than the data. Most of them also have the wrong dependence of the slopes. The models that most resemble the data are shown in Fig. 20. The simple model of Bishari [10], with the form factor , is closest in magnitude to the data. Other models with more detailed parameterizations show the turnover of the slopes near [11, *GKS]. The model of Holtmann et al. [13] is used for pion exchange in the Rapgap- MC. The values for from Rapgap- in Fig. 19 are lower than this curve because Rapgap also includes a contribution from standard fragmentation, which has flatter distributions than pion exchange. None of these models, based on pion exchange alone, describes the data.
5.3 Pion exchange with neutron absorption
As discussed in the introduction, in a geometrical picture, neutron absorption may occur for large photon sizes and small - separations. The former is inversely related to , and so is largest for photoproduction; thus more absorption is expected in photoproduction than in DIS. The - separation is the Fourier conjugate of , and the distribution of is given by the Fourier transform of . Parameterizations of the pion flux in general show that the mean value of increases with , so more absorption is expected at lower than at higher . The dashed curve in Fig. 21 is the expectation for the suppression of leading neutrons in photoproduction relative to DIS from a model of pion exchange with neutron absorption [22]. Although the curve lies below the data, it follows the same trend. The interaction has a power-law dependence , with different values of for DIS and photoproduction. Assuming that interactions have the same dependence, and recalling that , the ratio of photoproduction and DIS cross sections is proportional to . Previous ZEUS measurements of in photoproduction [38] and DIS [51, 52] give . Applying this to the absorption suppression factor results in the solid curve in Fig. 21. Within the normalization uncertainty of , the data are well described by the absorption model with this correction for different dependences. Hence such a geometric absorption model can account for the differences between the distributions in DIS and photoproduction.
Also shown in Fig. 21 is the NSZ model [21] which employs the optical theorem together with multi-Pomeron exchanges to describe all possible rescattering processes of the leading hadron, resulting in absorptive effects. With the correction for different dependences, the prediction is close in magnitude to the data, but does not have as steep an dependence.
5.4 Enhanced neutron absorption and secondary exchanges
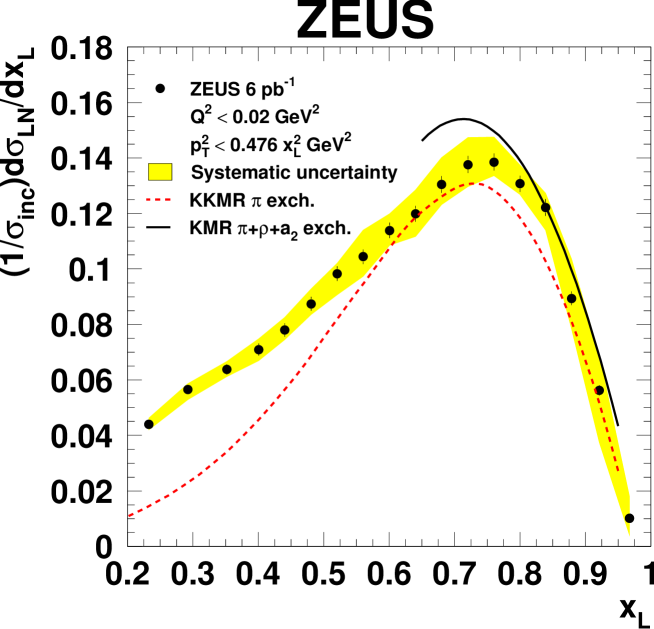
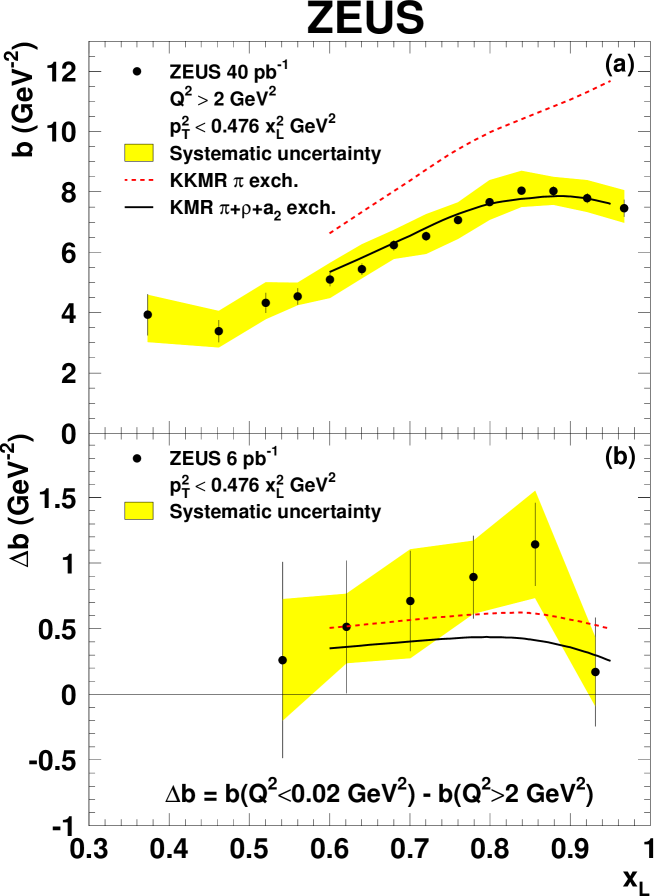
Recently a new calculation (KKMR) of pion exchange with neutron absorption based on multi-Pomeron exchanges has become available [23]. The pion exchange is based on the Bishari flux. In addition to the rescatterings implemented in the earlier model [21], a small contribution from rescattering on intermediate partons in the central rapidity region is also included. The model also accounts for the migration of neutrons in after rescattering. The prediction for the neutron distribution for photoproduction, where rescattering is most important, is shown by the dashed curve in Fig. 22. The model gives a fair description of both the shape and normalization of the data. The loss of neutrons through absorption is approximately ; this is consistent with the deviation from the prediction of the additive quark model that was noted in the previous ZEUS measurement [3]. Within this model, the present data can be used to constrain the gap-survival probability, one of the crucial inputs to calculations of diffractive interactions at the LHC — both hard, such as central exclusive Higgs production, and soft, such as those giving rise to the diffractive pile-up events [53]. The prediction of this model for the slopes in DIS is shown in Fig. 23. As for the pure pion-exchange calculations, the model predicts larger values of than seen in the data. This model does give a fair prediction for the magnitude of the difference of the slopes in photoproduction and DIS, as shown in Fig. 23.
More recently this model was extended to include, in addition to pion exchange, the exchange of secondary Reggeons [24]. This extended model gives a fair description of the shape and normalization of the distribution in photoproduction, as seen in Fig. 22. Since there are additional exchanges the model gives a prediction for the distribution which is higher than for pion-exchange alone. As shown in Fig. 23, the model with secondary exchanges also gives a good prediction for the slopes. Its description of the slope differences is also close in magnitude to the data, as seen in Fig. 23.
6 Summary
The and distributions of leading neutrons in photoproduction and DIS events at HERA have been measured. The distributions for the measured region rise from the lowest due to the increasing phase space, reach a maximum near , and fall to zero at the endpoint . The distributions are well described by an exponential . The intercepts fall rapidly from the lowest , are roughly constant in the region -, and fall to zero at the endpoint . The exponential slopes rise linearly with in the range to a value of , and then decrease slightly at higher .
The neutron yield rises monotonically with from the photoproduction region to the high- DIS region . The relative rise in yield is greatest near and becomes less significant at higher . The slopes of the distributions do not change significantly within the DIS region , but the slopes in photoproduction exhibit a small increase over those in DIS for .
In the kinematic region and there are approximately twice as many leading protons as neutrons. This indicates that leading proton production proceeds through exchanges in addition to pure isovector (e.g. pion) exchange. The slopes for leading protons agree with the neutron slopes near where pion exchange is expected to dominate both processes.
Monte Carlo models commonly in use for the simulation of DIS and photoproduction events which implement standard fragmentation of the proton remnant do not describe the leading-neutron data. They predict fewer neutrons, concentrated at lower . They also predict smaller slopes and do not have the strong dependence of the data. The inclusion of soft color interactions gives a reasonable description of the distributions, but again fails to predict the slopes. A mixture of processes including standard fragmentation, diffraction and pion exchange gives a good description of the distributions and the dependence of the slopes, although they are larger than the data.
The measured dependence in DIS has been compared with various pion-exchange models. All models give values larger than the data. The simplest model is closest in magnitude to the data; other models reproduce the measured shape of .
The dependence of the neutron yield and slopes is consistent with absorption models where neutrons from pion exchange with smaller - separations are lost through rescattering on larger photons. The photon size increases with decreasing , and the mean - separation is smaller in the mid- range than at higher . The result is a depletion of neutrons with decreasing , with the depletion greater at mid- than at higher , as seen in the data. The loss of neutrons with small - separations, corresponding to large , also explains the larger slopes measured in photoproduction than in DIS.
A model of neutron production through pion exchange, incorporating enhanced neutron absorption and migration of the neutrons in after rescattering, gives a fair description of the shape and normalization of the distributions in DIS and photoproduction, and of the difference in the slopes between the two sets. However, as with pure pion exchange, it predicts too high a value for . Extending the model to include also and exchanges still gives a fair description of the shape and normalization of the distributions in DIS and photoproduction, and also good descriptions of the slopes and of the differences between the two sets.
Acknowledgements
We are especially grateful to the DESY Directorate whose encouragement and financial support made possible the construction and installation of the FNC. We are also happy to acknowledge the DESY accelerator group for allowing the installation of the FNC in close proximity to the HERA machine components. We also acknowledge the support of the DESY computing staff.
We thank V. Khoze, A. Martin and M. Ryskin for valuable discussions and for providing the results of their calculations.
10
References
- [1] ZEUS Coll., M. Derrick et al., Phys. Lett. B 384, 388 (1995)
- [2] H1 Coll., C. Adloff et al., Eur. Phys. J. C 6, 587 (1999)
- [3] ZEUS Coll., J. Breitweg et al., Nucl. Phys. B 637, 3 (2002)
- [4] H1 Coll., C. Adloff et al., Nucl. Phys. B 619, 3 (2001)
- [5] H1 Coll., A. Aktas et al., Eur. Phys. J. C 41, 273 (2005)
- [6] ZEUS Coll., J. Breitweg et al., Nucl. Phys. B 658, 3 (2003)
- [7] ZEUS Coll., J. Breitweg et al., Nucl. Phys. B 596, 3 (2001)
- [8] ZEUS Coll., S. Chekanov et al., Phys. Lett. B 590, 143 (2004)
- [9] ZEUS Coll., S. Chekanov et al., Phys. Lett. B 610, 199 (2005)
- [10] M. Bishari, Phys. Lett. B 38, 510 (1972)
- [11] L.L. Frankfurt, L. Mankiewicz and M.I. Strikman, Z. Phys. A 334, 343 (1989)
- [12] K. Golec-Biernat, J. Kwiecinski and A. Szczurek, Phys. Rev. D 56, 3955 (1997)
- [13] H. Holtmann et al., Phys. Lett. B 338, 363 (1994)
- [14] B. Kopeliovich, B. Povh and I. Potashnikova, Z. Phys. C 73, 125 (1996)
- [15] M. Przybycien, A. Szczurek and G. Ingelman, Z. Phys. C 74, 509 (1997)
- [16] W. Melnitchouk, J. Speth and A.W. Thomas, Phys. Rev. D 59, 014033 (1998)
- [17] N.N. Nikolaev et al., Phys. Rev. D 60, 014004 (1999)
- [18] A. Szczurek, N.N. Nikolaev and J. Speth, Phys. Lett. B 428, 383 (1998)
- [19] J. Benecke et al., Phys. Rev. 188, 2159 (1969)
- [20] T.T. Chou and C.N. Yang, Phys. Rev. D 50, 590 (1994)
- [21] N.N. Nikolaev, J. Speth and B.G. Zakharov, Preprint KFA-IKP(TH)-1997-17 (hep-ph/9708290), KFA-IKP, 1997
- [22] U. D’Alesio and H.J. Pirner, Eur. Phys. J. A 7, 109 (2000)
- [23] A.B. Kaidalov et al., Eur. Phys. J. C 47, 385 (2006)
- [24] V.A. Khoze, A.D. Martin and M.G. Ryskin, Preprint IPPP-06-36, DCPT-06-72 (hep-ph/0606213), 2006
- [25] ZEUS Coll., U. Holm (ed.), The ZEUS Detector. Status Report (unpublished), DESY (1993), available on http://www-zeus.desy.de/bluebook/bluebook.html
- [26] M. Derrick et al., Nucl. Inst. Meth. A 309, 77 (1991)
- [27] A. Andresen et al., Nucl. Inst. Meth. A 309, 101 (1991)
- [28] A. Caldwell et al., Nucl. Inst. Meth. A 321, 356 (1992)
- [29] A. Bernstein et al., Nucl. Inst. Meth. A 336, 23 (1993)
- [30] J. Andruszków et al., Preprint DESY-92-066, DESY, 1992
- [31] ZEUS Coll., M. Derrick et al., Z. Phys. C 63, 391 (1994)
- [32] J. Andruszków et al., Acta Phys. Pol. B 32, 2025 (2001)
- [33] S. Bhadra et al., Nucl. Inst. Meth. A 354, 479 (1995)
- [34] ZEUS Coll., FNC group, S. Bhadra et al., Nucl. Inst. Meth. A 394, 121 (1997)
- [35] ZEUS FNC Group, S. Bhadra et al., Proc. of the Seventh International Conference on calorimetry in High Energy Physics, Tuscon, Arizona, November 1997, E. Cheu et al. (ed.), p. 295. World Scientific, Singapore (1998)
- [36] S. Bentvelsen, J. Engelen and P. Kooijman, Proc. Workshop on Physics at HERA, W. Buchmüller and G. Ingelman (eds.), Vol. 1, p. 23. Hamburg, Germany, DESY (1992)
- [37] F. Jacquet and A. Blondel, Proceedings of the Study for an Facility for Europe, U. Amaldi (ed.), p. 391. Hamburg, Germany (1979). Also in preprint DESY 79/48
- [38] ZEUS Coll., S. Chekanov et al., Nucl. Phys. B 627, 3 (2002)
- [39] H. Jung, Comp. Phys. Comm. 86, 147 (1995)
- [40] A. Edin, G. Ingelman and J. Rathsman, Phys. Lett. B 366, 371 (1996)
- [41] ZEUS Coll., M. Derrick et al., Z. Phys. C 73, 253 (1997)
- [42] T. Sjöstrand and M. Bengtsson, Comp. Phys. Comm. 43, 367 (1987)
- [43] G. Ingelman, A. Edin and J. Rathsman, Comp. Phys. Comm. 101, 108 (1997)
- [44] CTEQ Coll., H.L. Lai et al., Eur. Phys. J. C 12, 375 (2000)
- [45] L. Lönnblad, Comp. Phys. Comm. 71, 15 (1992)
- [46] H. Jung, Comp. Phys. Comm. 143, 100 (2002)
- [47] T. Sjöstrand, Comp. Phys. Comm. 82, 74 (1994)
- [48] R. Engel, M.A. Braun, C. Pajares and J. Ranft, Z. Phys. C 74, 687 (1997)
- [49] H1 Coll., C. Adloff et al., Z. Phys. C 76, 613 (1997)
- [50] M. Glück, E. Reya and A. Vogt, Z. Phys. C 53, 651 (1992)
- [51] ZEUS Coll., J. Breitweg et al., Eur. Phys. J. C 7, 609 (1999)
- [52] ZEUS Coll., S. Chekanov et al., Nucl. Phys. B 713, 3 (2005)
- [53] V.A. Khoze, A.D. Martin and M.G. Ryskin, Preprint IPPP-06-65, DCPT-06-130 (hep-ph/0609312), 2006
- [54] G.A. Schuler and H. Spiesberger, Proc. Workshop on Physics at HERA, W. Buchmüller and G. Ingelman (eds.), Vol. 3, p. 1419. Hamburg, Germany, DESY (1991)
- [55] H.L. Lai et al., Phys. Rev. D 55, 1280 (1997) range 0.20-0.32 0.27 7.96 2.031 0.064 2.51 1.881 0.064 4.86 1.955 0.070 7.95 2.002 0.068 1.19 1.962 0.063 1.65 2.001 0.062 0.32-0.42 0.37 1.99 1.541 0.035 6.46 1.454 0.038 1.24 1.445 0.039 2.04 1.527 0.037 3.03 1.440 0.034 4.23 1.256 0.031 0.42-0.50 0.46 3.42 1.336 0.026 1.11 1.211 0.029 2.14 1.218 0.029 3.51 1.217 0.027 5.22 1.147 0.025 7.28 1.005 0.023 0.50-0.54 0.52 4.84 1.274 0.030 1.58 1.218 0.035 3.03 1.200 0.034 4.97 1.110 0.031 7.40 0.946 0.026 1.03 0.836 0.026 0.54-0.58 0.56 5.64 1.328 0.028 1.84 1.144 0.031 3.53 1.166 0.031 5.80 1.016 0.027 8.62 0.904 0.024 1.20 0.767 0.023 Table 1: The normalized doubly differential distributions for the full DIS sample. Only statistical uncertainties are shown. Table 1 (cont.) range 0.58-0.62 0.60 6.50 1.286 0.025 2.12 1.175 0.029 4.07 1.112 0.028 6.68 0.976 0.024 9.94 0.795 0.020 1.39 0.654 0.019 0.62-0.66 0.64 7.42 1.296 0.024 2.42 1.157 0.027 4.65 1.034 0.025 7.63 0.926 0.022 1.14 0.703 0.018 1.58 0.571 0.017 0.66-0.70 0.68 8.39 1.297 0.022 2.74 1.112 0.025 5.27 0.990 0.022 8.64 0.821 0.019 1.29 0.581 0.015 1.79 0.456 0.014 0.70-0.74 0.72 9.42 1.306 0.021 3.08 1.126 0.023 5.92 0.914 0.020 9.71 0.707 0.016 1.44 0.524 0.013 2.01 0.388 0.012 0.74-0.78 0.76 1.05 1.280 0.019 3.44 1.030 0.021 6.61 0.837 0.018 1.08 0.617 0.014 1.61 0.403 0.011 2.25 0.308 0.010 0.78-0.82 0.80 1.16 1.180 0.018 3.81 0.920 0.019 7.33 0.714 0.016 1.20 0.482 0.012 1.79 0.304 0.009 2.49 0.213 0.008 0.82-0.86 0.84 1.28 1.000 0.016 4.21 0.783 0.017 8.10 0.568 0.014 1.33 0.374 0.010 1.98 0.208 0.007 2.75 0.139 0.006 0.86-0.90 0.88 1.41 0.719 0.013 4.63 0.537 0.013 8.90 0.363 0.010 1.46 0.232 0.007 2.17 0.135 0.005 3.03 0.082 0.004 0.90-0.95 0.92 1.54 0.347 0.007 5.07 0.267 0.008 9.74 0.172 0.006 1.60 0.110 0.004 2.38 0.059 0.003 3.31 0.034 0.002 0.95-1.00 0.97 1.72 0.054 0.002 5.64 0.043 0.002 1.08 0.032 0.002 1.78 0.015 0.001 2.65 0.009 0.001 3.69 0.005 0.001
| range | |||
|---|---|---|---|
| 0.20-0.32 | 0.27 | ||
| 0.32-0.42 | 0.37 | ||
| 0.42-0.50 | 0.46 | ||
| 0.50-0.54 | 0.52 | ||
| 0.54-0.58 | 0.56 | ||
| 0.58-0.62 | 0.60 | ||
| 0.62-0.66 | 0.64 | ||
| 0.66-0.70 | 0.68 | ||
| 0.70-0.74 | 0.72 | ||
| 0.74-0.78 | 0.76 | ||
| 0.78-0.82 | 0.80 | ||
| 0.82-0.86 | 0.84 | ||
| 0.86-0.90 | 0.88 | ||
| 0.90-0.95 | 0.92 | ||
| 0.95-1.00 | 0.97 |
| sample | range | range | ||
|---|---|---|---|---|
| full DIS | ||||
| low- DIS | ||||
| mid- DIS | ||||
| high- DIS |
| sample | |
|---|---|
| 0.0700 | |
| full DIS | 0.0885 |
| low- DIS | 0.0837 |
| mid- DIS | 0.0843 |
| high- DIS | 0.0913 |
| range | low- DIS | mid- DIS | high- DIS | |||
|---|---|---|---|---|---|---|
| 0.20-0.50 | 0.38 | 8.40 | 1.501 0.108 | 1.491 0.058 | 1.721 0.063 | 1.848 0.115 |
| 2.43 | 1.289 0.090 | 1.342 0.052 | 1.500 0.056 | 1.749 0.106 | ||
| 4.86 | 1.127 0.076 | 1.370 0.052 | 1.451 0.053 | 1.757 0.104 | ||
| 7.94 | 1.232 0.084 | 1.417 0.054 | 1.528 0.057 | 1.809 0.110 | ||
| 1.19 | 1.064 0.075 | 1.359 0.053 | 1.451 0.055 | 1.803 0.109 | ||
| 1.65 | 1.021 0.068 | 1.374 0.052 | 1.589 0.056 | 1.805 0.106 | ||
| 0.50-0.58 | 0.54 | 4.84 | 0.988 0.056 | 1.196 0.036 | 1.247 0.037 | 1.452 0.071 |
| 1.58 | 0.791 0.055 | 1.077 0.042 | 1.096 0.042 | 1.220 0.079 | ||
| 3.03 | 0.812 0.058 | 1.027 0.040 | 1.042 0.041 | 1.191 0.078 | ||
| 4.97 | 0.784 0.052 | 1.005 0.037 | 1.009 0.037 | 1.187 0.072 | ||
| 7.39 | 0.654 0.043 | 0.880 0.033 | 0.857 0.032 | 0.934 0.060 | ||
| 1.03 | 0.591 0.041 | 0.768 0.031 | 0.760 0.031 | 0.782 0.056 | ||
| 0.58-0.66 | 0.62 | 6.50 | 0.991 0.047 | 1.192 0.031 | 1.261 0.032 | 1.221 0.055 |
| 2.12 | 0.849 0.051 | 1.062 0.035 | 1.122 0.037 | 1.131 0.065 | ||
| 4.08 | 0.892 0.055 | 1.025 0.034 | 1.068 0.035 | 1.151 0.065 | ||
| 6.68 | 0.753 0.045 | 0.906 0.030 | 0.889 0.030 | 1.090 0.059 | ||
| 9.94 | 0.563 0.035 | 0.714 0.025 | 0.748 0.025 | 0.837 0.048 | ||
| 1.39 | 0.451 0.031 | 0.575 0.023 | 0.605 0.023 | 0.626 0.042 | ||
| 0.66-0.74 | 0.70 | 8.38 | 1.083 0.044 | 1.303 0.028 | 1.263 0.028 | 1.309 0.050 |
| 2.74 | 0.882 0.047 | 1.116 0.032 | 1.093 0.031 | 1.104 0.056 | ||
| 5.27 | 0.815 0.045 | 0.935 0.028 | 0.961 0.029 | 1.035 0.054 | ||
| 8.64 | 0.688 0.039 | 0.751 0.024 | 0.739 0.023 | 0.745 0.042 | ||
| 1.28 | 0.451 0.027 | 0.530 0.018 | 0.560 0.019 | 0.532 0.033 | ||
| 1.79 | 0.305 0.021 | 0.426 0.017 | 0.428 0.017 | 0.448 0.031 | ||
| Table 5 (cont.) | ||||||
|---|---|---|---|---|---|---|
| range | low- DIS | mid- DIS | high- DIS | |||
| 0.74-0.82 | 0.78 | 1.05 | 1.111 0.041 | 1.250 0.025 | 1.181 0.024 | 1.251 0.044 |
| 3.44 | 0.884 0.043 | 1.027 0.027 | 0.986 0.027 | 0.915 0.046 | ||
| 6.61 | 0.769 0.042 | 0.824 0.024 | 0.779 0.023 | 0.846 0.043 | ||
| 1.08 | 0.494 0.028 | 0.587 0.018 | 0.541 0.018 | 0.576 0.033 | ||
| 1.61 | 0.285 0.018 | 0.361 0.013 | 0.362 0.013 | 0.399 0.025 | ||
| 2.25 | 0.209 0.016 | 0.267 0.012 | 0.243 0.011 | 0.289 0.022 | ||
| 0.82-0.90 | 0.86 | 1.28 | 0.876 0.034 | 0.899 0.019 | 0.894 0.019 | 0.838 0.032 |
| 4.21 | 0.688 0.036 | 0.732 0.021 | 0.671 0.020 | 0.647 0.035 | ||
| 8.09 | 0.538 0.033 | 0.528 0.017 | 0.477 0.016 | 0.477 0.029 | ||
| 1.33 | 0.293 0.020 | 0.335 0.013 | 0.329 0.012 | 0.268 0.020 | ||
| 1.97 | 0.134 0.011 | 0.195 0.009 | 0.170 0.008 | 0.174 0.015 | ||
| 2.75 | 0.098 0.010 | 0.116 0.007 | 0.113 0.007 | 0.116 0.012 | ||
| 0.90-1.00 | 0.93 | 1.54 | 0.242 0.015 | 0.236 0.008 | 0.228 0.007 | 0.201 0.012 |
| 5.06 | 0.166 0.014 | 0.180 0.008 | 0.156 0.007 | 0.142 0.013 | ||
| 9.74 | 0.130 0.012 | 0.117 0.006 | 0.115 0.006 | 0.093 0.010 | ||
| 1.60 | 0.072 0.008 | 0.077 0.005 | 0.065 0.004 | 0.057 0.007 | ||
| 2.38 | 0.039 0.005 | 0.041 0.003 | 0.035 0.003 | 0.034 0.005 | ||
| 3.31 | 0.022 0.004 | 0.019 0.002 | 0.023 0.002 | 0.019 0.004 | ||
| sample | range | |||
|---|---|---|---|---|
| 0.20-0.50 | 0.38 | |||
| 0.50-0.58 | 0.54 | |||
| 0.58-0.66 | 0.62 | |||
| 0.66-0.74 | 0.70 | |||
| 0.74-0.82 | 0.78 | |||
| 0.82-0.90 | 0.86 | |||
| 0.90-1.00 | 0.93 | |||
| low- | 0.20-0.50 | 0.38 | ||
| DIS | 0.50-0.58 | 0.54 | ||
| 0.58-0.66 | 0.62 | |||
| 0.66-0.74 | 0.70 | |||
| 0.74-0.82 | 0.78 | |||
| 0.82-0.90 | 0.86 | |||
| 0.90-1.00 | 0.93 | |||
| mid- | 0.20-0.50 | 0.38 | ||
| DIS | 0.50-0.58 | 0.54 | ||
| 0.58-0.66 | 0.62 | |||
| 0.66-0.74 | 0.70 | |||
| 0.74-0.82 | 0.78 | |||
| 0.82-0.90 | 0.86 | |||
| 0.90-1.00 | 0.93 | |||
| high- | 0.20-0.50 | 0.38 | ||
| DIS | 0.50-0.58 | 0.54 | ||
| 0.58-0.66 | 0.62 | |||
| 0.66-0.74 | 0.70 | |||
| 0.74-0.82 | 0.78 | |||
| 0.82-0.90 | 0.86 | |||
| 0.90-1.00 | 0.93 |
| a) |
|
b) |
|