The MiniBooNE Experiment
Abstract
Neutrino oscillations have been observed in three sectors : solar ( disappearance) solar , atmospheric ( disappearance) atm , and accelerator () LSND . The probability for two-neutrino oscillation is a function of four variables : two are determined by the conditions of the experiment, and two are the quantities fit for when performing an oscillation search ( and ). is the difference in squares of the mass states of the neutrinos ( = - ). If the observed oscillations only occur between neutrinos in the Standard Model a summation law of the is valid ( = + ). The observed oscillations do not follow this summation law. This implies one of the results is incorrect or there exists physics beyond the Standard Model. While the solar and atmospheric results have been confirmed by several different experiments, the accelerator based result, from the Los Alamos LSND experiment LSND , has yet to be fully vetted. The MiniBooNE experiment MB , located at Fermi National Laboratory, is designed to fully explore the LSND result.
MiniBooNE is in the final stages of performing a blind oscillation search () using neutrino data collected through November, 2005. A blind analysis is one in which you may analyze some of the information in all of the data, all of the information in some of the data, but not all of the information in all of the data. As MiniBooNE hasn’t yet opened the box, this discussion will focus on the different components of MiniBooNE relevant for the oscillation analysis.
I OSCILLATION REVIEW
The weak eigenstates of neutrinos are made up of a combination of mass eigenstates, analogous to mixing found in the lepton sector
| (1) |
For example, at the time of creation the muon neutrino is a combination of the two mass eigenstates :
| (2) |
To see what state the muon neutrino would be in at a later time requires the addition of a propagator term to each of the components :
| (3) |
The probability of oscillations between two weak eigenstates is the square of the bra of the final weak eigenstate and the ket of the starting neutrino eigenstate :
| (4) |
The probability for oscillation may be simplified into the following equation :
| (5) |
An excellent discussion of the derivation of this equation may be found in Reference osceqn . The probability has two terms which are constrained by the design of the experiment (L, the distance from the neutrino source to the detector, and E, the energy of the neutrino beam), and two terms which are fit for when performing a two-neutrino oscillation analysis (, and , where is the mixing angle between the two neutrino states and has been defined in the Abstract).
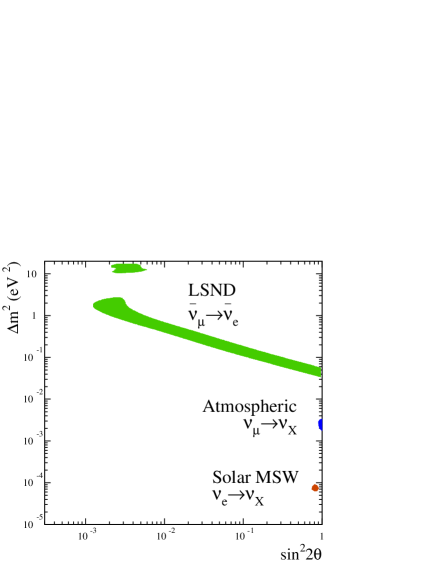
Neutrino physicists illustrate the current status of neutrino oscillations using a two dimensional plot that is the function of the two fit parameters. (Figure 1) The oscillation results from the solar and atmospheric sectors have been observed and confirmed by several experiments, making the region they lie in in phase space very well confined. The LSND result covers a wide swath of area. The is the mass squared difference between the two neutrino states. These three results represent three differences between states. If the Standard Model of physics is correct and there are 3 and only 3 neutrinos, a summation law should exist : = + . You can see that even at LSND’s lowest allowed point the summation law does not hold.
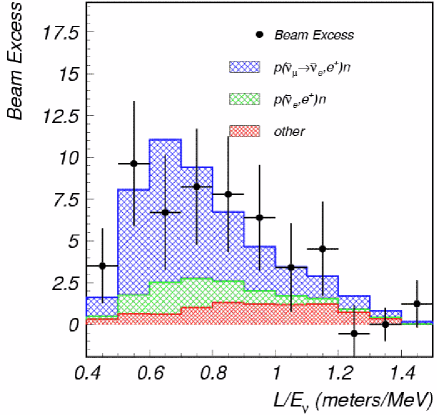
The right portion of Figure 1 displays the final LSND result. The smaller green and red shaded areas are backgrounds; the blue area is the fit to the oscillation hypothesis. To properly explore the LSND signal one needs an experiment that has the same experimental constraints (L/E, from the oscillation probability formula), higher statistics, and different signal signature, backgrounds, and sources of systematic errors. This is MiniBooNE.
II THE MiniBooNE EXPERIMENT
II.1 How we get our neutrinos
MiniBooNE is located at Fermi National Laboratory, in Batavia, IL. To produce our neutrino beam we start with an 8 GeV beam of protons from the Booster. The proton beam enters a magnetic focusing horn where it strikes a Beryllium target. (Figure 2) We can change the polarity of the horn to direct a neutrino or anti-neutrino beam toward our detector. We have collected approximately protons on target (POT) for the neutrino oscillation result, for a total of around 600,000 neutrino events. In January, 2006, we switched the polarity of the horn and began running in anti-neutrino mode. As of October 2006 MiniBooNE has collected POT in anti-neutrino mode.
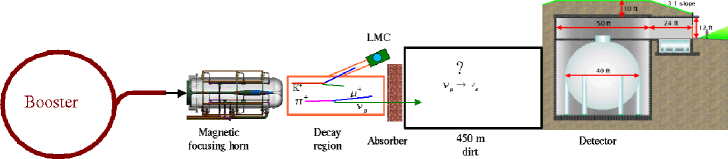
The proton and Beryllium interactions produce a stream of charged mesons (kaons and pions). The mesons decay in flight into the neutrino beam seen by the detector : , where the comprise the neutrino beam seen at MiniBooNE. These mesons decay in flight in our vacuum decay region. Following the decay region is an absorber, put in place to stop any muons and undecayed mesons. The neutrino beam then travels through approximately 450 meters of dirt before entering the MiniBooNE detector.
MiniBooNE is a 12.2 meter diameter sphere. The detector is filled with pure mineral oil and lined with photomultiplier tubes (PMTs). There are two regions of the MiniBooNE detector : an inner light-tight region, which has a 10% coverage in PMTs, and an optically isolated outer region, known as the veto region, which aids in vetoing cosmic backgrounds.
II.2 How we detect neutrinos
Neutrinos interact with material in the detector. It’s the outcome of these interactions that we look for. Neutrinos can interact with an electron in the atomic orbit, the nucleus as a whole, a free proton or nucleon bound in the nucleus, or a quark. Starting with the lowest energy and moving to the highest energy the interactions neutrinos can engage in are : elastic scattering, quasi-elastic scattering, single pion production, and deep inelastic scattering.
In elastic scattering the target particle is left intact and does not change its type or flavor. The neutrino imparts recoil energy to the target, which is used to observe these interactions.
In quasi-elastic scattering the neutrino interacts with the target, changes the target type, and emits a charged lepton. For example consider an electron neutrino scattering from a neutron. Through the exchange of a W boson the neutrino is turned into an electron and the neutron is turned into a proton. These are higher energy interactions; there must be enough center of mass energy to make the outgoing particles.
Single pion production can be broken down into resonant and coherent production. In resonant production the neutrino scatters from a nucleon. A resonance of the nucleon is excited, and in the process of decaying back into the ground state the resonance emits one or more mesons. In coherent production the neutrino scatters from the entire nucleus. The nucleus does not break up, so these interactions require a low momentum transfer. In coherent pion production there is no transfer of charge.
The highest energy neutrino interaction is deep inelastic scattering. This is scattering with very large momentum transfers, and is similar to the quasi elastic interactions. Here the W boson also mediates the neutrino turning into its partner lepton. However, the nucleon the neutrino scatters from is blown to bits due to the high momentum transfer. The W instead interacts with the quarks in the nucleon. The quarks shower into a variety of hadrons, dissipating the energy carried by the W boson.
We look for the products of these neutrino interactions in our detector. The passage of charged particles through the MiniBooNE detector leaves a distinct mark in the form of Cerenkov light cerenkov and scintillation light. Cerenkov light is produced when a charged particle moves through the detection medium with a velocity greater than the speed of light in the medium (v c/n). This produces an electro-magnetic shock wave, similar to a sonic boom. The shock wave is conical and produces a ring of light which is detected by the PMTs. We can use Cerenkov light to measure the particle’s direction and to reconstruct the interaction vertex. This effect occurs immediately with the particle’s creation and is known as a prompt light signature.
Charged particles moving through the detector also may deposit energy in the medium, exciting the surrounding molecules. The de-excitation of these molecules produces scintillation light. This is an isotropic, delayed light source, and provides no information about the track direction. We can however use the PMT timing information to locate the point, or vertex, where the neutrino interaction occurred.
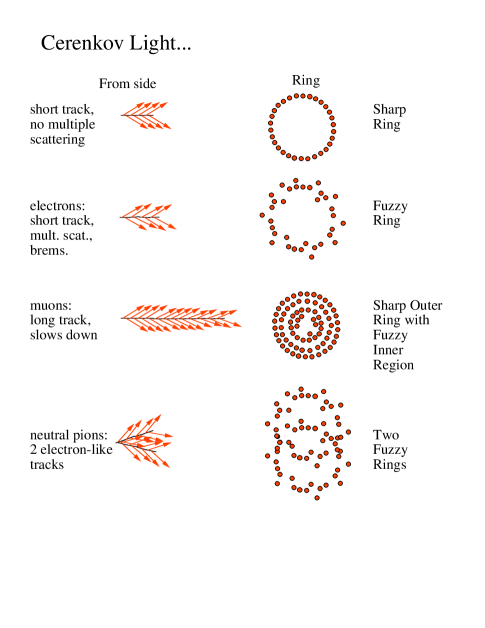
Figure 3 illustrates the different particle signatures we see in MiniBooNE. Electrons travel for only a very short time before their velocity falls below the Cerenkov threshold. They multiple scatter along the way, as well. This leaves a fuzzy Cerenkov ring in the detector. Muons tend to travel for a much longer distance. As they travel through the detector they lose energy, and the angle at which the Cerenkov light is being emitted shrinks. The signature of a muon in the detector isn’t one of a ring, as in the case of an electron. It is instead a filled in circle of light. Neutral pions decay into two photons, which then pair produce. The electrons from this pair production each create a ring in the detector.
II.3 Components of the oscillation analysis
MiniBooNE is performing a blind analysis. The oscillation signal that we are looking for is expected to be quite small - the probability for the LSND oscillations was only 0.26%! This requires we have a very precise knowledge of the event rate and neutrino flux, the detector response, and the backgrounds to the oscillation search. This also requires we have a well developed particle ID algorithm.
II.3.1 Event Rate and Flux
There are very few measurements of the integrated cross section for proton-Beryllium interactions, and none in the MiniBooNE proton energy range. Extrapolation from the measurements at 6 GeV and 12 GeV to our energy range produces a flux prediction with very large uncertainties. MiniBooNE is using results from two experiments which have just completed running to reduce the uncertainties in the flux prediction. The E910 experiment e910 , located at Brookhaven National Laboratory, measured pion and kaon production using a 6, 12, and 18 GeV beam of protons and a thin Beryllium target. The HARP experiment at CERN harp took data using a 8 GeV proton beam and a 5, 50, and 100% interaction length thick MiniBooNE replica target. The thin target results from HARP have been completed in April 2006 and incorporated into the MiniBooNE Monte Carlo. We are anxiously awaiting the thick target results.
II.3.2 Detector Response
A vital component of the oscillation analysis involves our ability to properly model the detector response. MiniBooNE is the first neutrino experiment to use pure mineral oil as the detection medium. All other neutrino experiments to date which have used mineral oil have doped their oil with a scintillator. These experiments were looking for much lower energy neutrino interactions and they needed to boost the light output from the detector. At MiniBooNE we rely on the Cerenkov light cone to distinguish between different particles, and thus different interactions and incident neutrino types. The addition of scintillator would wash out the Cerenkov signature, making particle identification impossible.
As we are the first neutrino experiment to use a pure mineral oil there is no prior characterization of the mineral oil itself which we can use as a starting point to our simulation. MiniBooNE has had to perform a variety of tests to separate out the components of the mineral oil which create light - fluorescence components, scintillation light, etc. MiniBooNE has employed a variety of stand alone tests to characterize the separate components of the mineral oil. While these tests have allowed us to characterize and isolate specific components of the mineral oil these tests provide no way to understand correlations between the components. For that information we turn to our internal calibration sources.
MiniBooNE has a muon tracker located above the tank, and several small cubes filled with scintillation oil located inside of the tank. This system provides cosmic ray muons and their subsequent decay Michel electrons of a known position and direction in the tank. These events are key to understanding our energy and reconstruction. We also have 4 laser flasks which we use to measure tube charge and timing response, and to make sure the detector response has been constant as a function of time. In addition we have an in-situ data sample, the neutral current elastic sample, which provides neutrino interactions below the Cerenkov threshold. These events allow us to isolate the scintillation components in our mineral oil and distinguish it from the fluorescence of the detector.
II.3.3 Backgrounds
Backgrounds to the oscillation analysis are broken down into two main categories : events which are mis-identified as events, and true events which are intrinsic to our beam.
Of the events which are mis-identified as being events, 83% are events. Delta decays (7%) and charged current quasi-elastic (CCQE) events (10%) comprise the remaining backgrounds. The CCQE events are well constrained using MiniBooNE data. The background estimate is measured by fitting the mass peak as a function of momentum.
The intrinsic background comes from muon, kaon, and pion decays. The muon and pion events are also well constrained using CCQE events. from kaon decays are constrained using high energy CCQE events, which are primarily due to kaon decays.
II.3.4 Particle ID Algorithm
A sensitive particle identification (PID) algorithm is required to cover the large swath of allowed regions in - phase space allowed by LSND. We require that our PID removes 99.9% of the charged-current interactions, removes 99% of all neutral current producing interactions, while maintaining a 30-60% effiency for interactions.
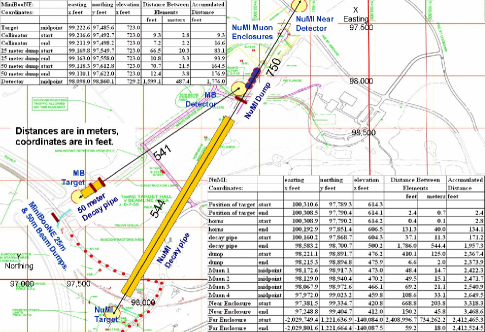
To test our PID algorithm we need a sample of data which is enriched in events. Our analysis is blind; we cannot use the data which contains interactions for calibrations as this is where the potential oscillation signal is found. The advent of the NuMI beamline numi has unintentionally allowed MiniBooNE to become the world’s first off-axis neutrino detector. (See Figure 4). Due to this off-axis angle, the beam at MiniBooNE from NuMI is significantly enhanced in from . This provides us with a large sample of events to use to verify the performance of our PID algorithm.
III CONCLUSIONS
All components of a blind analysis must be fully vetted and finalized before the data can be unblinded. MiniBooNE is currently in the process of checking and double-checking systematic errors and background estimates to the oscillation analysis. We hope to have results in the very near future.
While the collaboration is working hard on the neutrino oscillation analysis our summer students have been working on analyzing the anti-neutrino data. We have two preliminary anti-neutrino analyses in the works : a charged-current quasi-elastic free and bound proton cross section, and a neutral current analysis.
III.1 Acknowledgments
This work was supported in part by Los Alamos National Laboratory LDRD funding.
References
- (1) S. Ahmed et al. [SNO Collaboration], Phys. Rev. Lett. 92, 181301 (2004), nucl-ex/0309004
- (2) G. Fogli et al., Phys. Rev. D 67, 093006 (2003), hep-ph/0303064
- (3) A. Aguilar et al. [LSND Collaboration], Phys. Rev. D 64, 112007 (2001), hep-ex/0104049
- (4) http://www-boone.fnal.gov
- (5) D. Smith, “Calculating the Probability for Neutrino Oscillations”, http://physicsx.pr.erau.edu/Office/oscillations.pdf
- (6) http://en.wikipedia.org/wiki/Cherenkov_radiation
- (7) http://nevis1.nevis.columbia.edu/heavyion/e910
- (8) The HARP Collaboration, CERN-SPSC/2003-027, SPSC-P-325
- (9) S. Kopp, “The NuMI Neutrino Beam at Fermilab”, physics/0508001