Precison Measurements of the Mass, the Widths of Resonance and the Cross Section at GeV
Abstract
By analyzing the values measured at 68 energy points in the energy region between 3.650 and 3.872 GeV reported in our previous paper, we have precisely measured the mass, the total width, the leptonic width and the leptonic decay branching fraction of the to be MeV, MeV, eV and , respectively, which result in the observed cross section nb at MeV. We have also measured for the continuum light hadron production in the region from 3.650 to 3.872 GeV.
pacs:
13.85.Lg, 12.38.Qk, 14.40.Gx, 14.40.LbPrecise measurements of the mass , the total width and the leptonic width of the resonance, and the cross section for the production at in the annihilation are important in understanding the nature of the . The is thought to be a maxiture of the -wave and -wave of the angular momentum eignstates of system. The detailed mixing scheme affacts the production and decays. So precise measurements of these quantities would give us some useful information about the nature of the and offer some insights into the internal wave functions of the charmonium, which are beneficial to understand the dynamics of the resonance production in the annihilation. Potential or quarkonium models based on QCD can calculate the masses eichten_prl34_y1975_p369 ; eichten_prd21_y1980_p203 ; heikkila_prd29_y1983_p110 of the bound states, the total widths of the and other resonances eichten_prd21_y1980_p203 ; heikkila_prd29_y1983_p110 , and the width for eichten_prd69_y2004_p094019 ; heikkila_prd29_y1983_p110 . The Lattice QCD (LQCD) can calculate the mass spectra of the system (heavy quark and anti-quark system, such as the and system) prd52_y1995_p6519_davies . If one can more precisely measure the masses and the widths of the system, the results of these measurements can be used to test the calculation of the quantities by the models and by the LQCD theory. Moreover, these measurements can in turn be used to extract two fundamental parameters in QCD, the -quark mass and the strong coupling constant at this mass scale prd52_y1995_p6519_davies .
In recent days, new results of the measured quantities releated to the production and decays were reported bes_dd_nondd_psipp ; cleo_dd_nondd_psipp . These improve our knowledge on charmonium production and decays, especially improve our understanding of the nature of the resonance. In our previous work rplxx_y2006_pyyyy_bes we have reported measurements of the values measured at 68 energy points in the region between 3.650 and 3.872 GeV, where the quantity is defined as the ratio , with , here is the c.m. (center-of-mass) energy squared and is the fine structure constant at the lowest energy limit. In this Letter we report the results obtained by further analyzing these values. From this analysis we obtain , , and the leptonic branching fraction for with improved precision compared to those of the PDG pdg world average, and we obtain the cross section at MeV with a precision better than any of those measured in cross section scan experiments previously.
In Ref. rplxx_y2006_pyyyy_bes we reported measurements of the quantities , and which are the values for the continuum light hadron production around the threshold, values including the contributions from the continuum hadrons and all resonances at all energies, and the values accounting for the contributions from both the continuum hadron production and the decays for , respectively. All of these are corrected for the intial state radiative and vacuum polarization corrections. To extract the mass and widths of the , we here, in the Letter, analyze the quantity rplxx_y2006_pyyyy_bes . Table 1 summarizes the values reported in Ref. rplxx_y2006_pyyyy_bes .
| (GeV) | (GeV) | (GeV) | (GeV) | ||||
|---|---|---|---|---|---|---|---|
| 3.6500 | 3.7584 | 3.7726 | 3.7826 | ||||
| 3.6600 | 3.7596 | 3.7730 | 3.7838 | ||||
| 3.6920 | 3.7608 | 3.7742 | 3.7850 | ||||
| 3.7000 | 3.7620 | 3.7754 | 3.7862 | ||||
| 3.7080 | 3.7622 | 3.7766 | 3.7874 | ||||
| 3.7160 | 3.7634 | 3.7778 | 3.7886 | ||||
| 3.7240 | 3.7646 | 3.7790 | 3.7898 | ||||
| 3.7320 | 3.7658 | 3.7798 | 3.7900 | ||||
| 3.7400 | 3.7670 | 3.7802 | 3.7950 | ||||
| 3.7480 | 3.7682 | 3.7804 | 3.8000 | ||||
| 3.7500 | 3.7694 | 3.7808 | 3.8100 | ||||
| 3.7512 | 3.7706 | 3.7810 | 3.8200 | ||||
| 3.7524 | 3.7714 | 3.7812 | 3.8300 | ||||
| 3.7536 | 3.7716 | 3.7814 | 3.8400 | ||||
| 3.7548 | 3.7718 | 3.7816 | 3.8500 | ||||
| 3.7560 | 3.7720 | 3.7818 | 3.8600 | ||||
| 3.7572 | 3.7722 | 3.7822 | 3.8720 |
The determination of , and is accomplished by simultaneously fitting the measured values listed in table 1 to the function that describes the combined resonance shape and non-resonant hadronic background. Assuming that there are no other new structures and effects, we use a pure p-wave zero order Breit-Wigner function with energy-dependent total widths to describe the production and its decay to inclusive hadrons. The resonance shape is taken as
| (1) |
with , where and are the bare leptonic width excluding the vacuum polarization effects and experimental leptonic width including the vacuum polarization effects, respectively; is the vacuum polarization correction function berends including the contributions from all resonances, the QED continuum hadron spectrum as well as the contributions from the lepton pairs (, and ) zhangdh_gen ; is a parameter related to the total energy of the emitted photons; the total width is chosen to be energy dependent defined as
| (2) |
in which prl97_y2006_p121801
| (3) |
| (4) |
and
| (5) |
where and are the momenta of the mesons produced at the peak of the and at the c.m. energy , respectively; is the total width of the at its peak, and are the branching fractions for and , respectively, is the interaction radius of the , and are the step functions to account for the thresholds of the and production, respectively. In the fit we take and as free parameters. Since we do not select the events from these data samples, we can not leave and free in the fit. Instead we set the ratio prl97_y2006_p121801 ; npb727_y2005_p395 and the branching fraction for to be prl97_y2006_p121801 ; r_and_bf in the fit.
The non-resonant background shape is taken as
| (6) |
with
| (7) |
where is the value for the continuum light hadron production; is the value due to the continuum ( and ) production; and are the energies of the and the mesons produced at , respectively; is a parameter to be fitted.
The expected value is written as
| (8) | |||||
in which is the Gaussian function to describe the c.m. energy distribution of the BEPC machine prl97_y2006_p121801 . In the fit we leave free, assuming that it is independent of the energy.
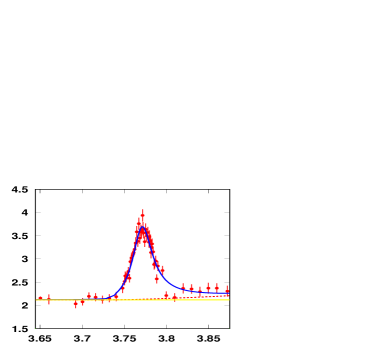
Figure 1 shows the measured values with the fit, where the point with errors represents the value, the curve (blue line) gives the fit to the data, the straight (yellow) line shows the quantity obtained from the fit and the dashed (red) line shows the variation of the quantity with the c.m. energy as given in Eqs. (6-7). The for this fit is . The larger s are mainly from the four energy points, which are at and GeV. The sum over the s from these four energy points is 31. If we exclude these four points in the fit, we would obtain . The ”dip” of the values around 3.80 GeV, which obviously turn aside from the expected ones, may be due to some unknown effects 111 The analysis author would like to suggest the BES-III (BES-III at BEPC-II) and/or CLEO (CLEO-c at CERS) Collaborations to check whether this ”dip” is due to physical reason with larger statistical cross section scan data to be collected at more sampling points around GeV in the future. . Table 2 summarizes the results from the fit, where the first error is the statistical and the second systematic. The systematic errors on and arise mainly from the common systematic uncertainty on the measured quantity , while the systematic error on arises from the uncertainty in the energy calibration prl97_y2006_p121801 of the BEPC collider. As a comparison, the same quantities measured by the BES Collaboration obtained by analyzing different cross section scan data sets prl97_y2006_p121801 are also listed in the table. The fit also gives
in the energy region from 3.650 to 3.872 GeV, where the errors are statistical and systematic, respectively. The systematic uncertainty arises mainly from the uncertainty () in the measurements of . The measured value from this fit is consistent with the obtained by weighting the first 8 values below the threshold rplxx_y2006_pyyyy_bes . In estimating the systematic uncertainties, the effects of the uncertainty in the measurement of the branching fraction for on the measured quantities are also taken into account. The measured widths of the yield its leptonic branching fraction shown in table 3.
| (MeV) | (MeV) | (eV) | Note |
|---|---|---|---|
| This work | |||
| prl97_y2006_p121801 |
| Experiment | |
|---|---|
| This work | |
| BES prl97_y2006_p121801 | |
| PDG pdg |
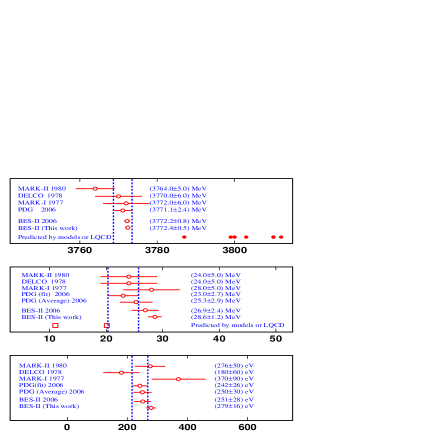
Figure 2 illustrates the comparisons of the measured quantities (circle with error bar) with those measured by the MARK-I, DELCO and MARK-II Collaborations mark-i ; delco ; mark-ii from analyzing the cross section scan data. As a comparison we also plot the mass (dots) of the state of the system and the partial width (squares heikkila_prd29_y1983_p110 ; eichten_prd69_y2004_p094019 ) for predicted by the models eichten_prd21_y1980_p203 ; heikkila_prd29_y1983_p110 ; modes_expct_mass_widths in recent years and calculated by the LQCD theory prd52_y1995_p6519_davies in the figure.
With the mass, total width and leptonic width of the , we extract the production cross section at , which excludes the initial state radiative corrections, and extract its corresponding observed cross section , which includes the initial state radiative and vacuum polarization effects. Table 4 summarizes the measured cross sections from this measurement and those measured by the MARK-II Collaboration and by the BES Collaboration from analysis of different cross section scan data prl97_y2006_p121801 .
| Experiment | ||
|---|---|---|
| [nb] | [nb] | |
| This work | ||
| BES prl97_y2006_p121801 | ||
| MARK-II mark-ii | mark-ii |
In summary, we measured the mass of the with a precision of more than a factor of 4 better than the one of the PDG pdg average. The precise measurement of the mass combining with the measured masses of other states could be used to gauge the effect of systematic improvement on the calculation of the spectrum and to extract the at this mass scale prd52_y1995_p6519_davies . Our measured MeV is significantly larger than the PDG average MeV pdg , and with a precision more than a factor of 2 better than that of the PDG average. It is also obviously larger than the recently resonable prediction by the coupled channel models heikkila_prd29_y1983_p110 ; eichten_prd69_y2004_p094019 by more than , where is the error of the measured value of the total width of . Our measured leptonic width of the is consistent within error with the PDG average pdg , but with a better accuracy than the PDG average. The measured leptonic branching fraction of the from this work is consistent within error with PDG average and with that measured by the BES Collaboration previously prl97_y2006_p121801 , but with a precision of more than a factor of 2 better than the PDG average. We measured the production cross section to be nb at . These improved measurements of the quantities would be helpful for us to understand the nature of the resonance. From the analysis we also extracted in the energy range from 3.650 to 3.872 GeV. This information would be beneficial for us in the understanding of the continuum hadron production in or nearby the resonance region(s). The measured can directly be used to extract the at this energy scale.
The BES collaboration thanks the staff of BEPC for their hard efforts. This work is supported in part by the National Natural Science Foundation of China under contracts Nos. 19991480,10225524,10225525, the Chinese Academy of Sciences under contract No. KJ 95T-03, the 100 Talents Program of CAS under Contract Nos. U-11, U-24, U-25, and the Knowledge Innovation Project of CAS under Contract Nos. U-602, U-34(IHEP); by the National Natural Science Foundation of China under Contract No.10175060(USTC),and No.10225522(Tsinghua University).
References
- (1) E. Eichten, K. Gottfried et al., Phys. Rev. Lett. 34 369 (1975).
- (2) E. Eichten, K. Gottfried et al., Phys. Rev. D 21 203 (1980).
- (3) K. Heikkilä and N.A. Törnqvist, Phys. Rev. D 29 110 (1983).
- (4) E. Eichten, K. Lane, C. Quigg Phys. Rev. Lett. 69 094019 (2004).
- (5) C.T.H. Davies, K. Hornbostel et al., Phys. Rev. D 52 6519 (1995).
- (6) M. Ablikim et al. (BES Collaboration), Phys. Lett. B 603, 130 (2004); Nucl. Phys. B 727, 395 (2005); Phys. Lett. B 641, 145 (2006); Phys. Rev Lett. 97, 121801 (2006); HEP & NP 28(4), 325 (2004); Phys. Lett. B 605, 63 (2005); Phys. Rev. D 70, 077101 (2004); Phys. Rev. D 72, 072007 (2005); G. Rong (for BES Collaboration), Int. J. Mod. Phys., 21, 5416 (2006). G. Rong, D.H. Zhang and J.C. Chen, hep-ex/0506051.
- (7) N. E. Adam et al. (CLEO Collaboration), Phys. Rev. Lett. 96, 082004 (2006); T. E. Coans et al. (CLEO Collaboration), Phys. Rev. Lett. 96, 182002 (2006); G. S. Huang et al. (CLEO Collaboration), Phys. Rev. Lett. 96, 032003 (2006); G. S. Adams et al. (CLEO Collaboration), Phys. Rev. D 73, 012002 (2006); D. Cronin-Hennessy et al. (CLEO Collaboration), Phys. Rev. D 74, 012005 (2006); R. A. Briere et al. (CLEO Collaboration), Phys. Rev. D 74, 031106 (2006); D. Beson et al. (CLEO Collaboration), Phys. Rev. Lett. 96, 092002 (2006).
- (8) W-M Yao et al. (Particle Data Group), J. Phys. G 33, 1 (2006).
- (9) M. Ablikim et al. (BES Collaboration), hep-ex/0612054; to be published in Phys. Rev. Lett. (in press).
- (10) F.A. Berends and G.J. Komen, Phys. Lett. B 63, 432 (1976); Andrej B. Arbuzov, Eduard A. Kuraev et al., JHEP10, 006 (1997).
- (11) D.H. Zhang, G. Rong and C.J. Chen, Phys. Rev. D 74 054012 (2006).
- (12) M. Ablikim et al. (BES Collaboration), Phys. Rev. Lett. 97 121801 (2006).
- (13) M. Ablikim et al. (BES Collaboration), Nucl. Phys. B 727 395 (2005).
- (14) M. Ablikim et al. (BES Collaboration), Phys. Lett. B 641 145 (2006).
- (15) S. Ono, Phys. Rev. D 20, 2975(1979); S. Ono, Z. Phys. C 8, 7 (1981); A. Martin, Phys. Lett. B 100, 511 (1981); L. Richardson, Phys. Lett. B 82, 272 (1979); W. Buchmüller and S.-H. H. Tye, Phys. Rev. D 24, 132 (1981); G. Bhanot and S. Rudaz, Phys. Lett. B 78, 119 (1978); H. Krasemann and S. Ono, Nucl. Phys. B 154, 283 (1979).
- (16) P.A. Rapidis et al. (MARK-I Collaboration), Phys. Rev. Lett. 39 (1977) 526.
- (17) W. Bacino et al. (DELCO Collaboration), Phys. Rev. Lett. 40 (1978) 671.
- (18) R.H. Schindler et al. (MARK-II Collaboration), Phys. Rev. D 21 (1980) 2716.