DESY 06-214
November 2006
Bottom production cross section from double muonic decays of
-flavoured hadrons in 920 GeV proton-nucleus collisions
I. Abt23,
M. Adams10,
M. Agari13,
H. Albrecht12,
A. Aleksandrov29,
V. Amaral8,
A. Amorim8,
S. J. Aplin12,
V. Aushev16,
Y. Bagaturia12,36,
V. Balagura22,
M. Bargiotti6,
O. Barsukova11,
J. Bastos8,
J. Batista8,
C. Bauer13,
Th. S. Bauer1,
A. Belkov11,†,
Ar. Belkov11,
I. Belotelov11,
A. Bertin6,
B. Bobchenko22,
M. Böcker26,
A. Bogatyrev22,
G. Bohm29,
M. Bräuer13,
M. Bruinsma28,1,
M. Bruschi6,
P. Buchholz26,
T. Buran24,
J. Carvalho8,
P. Conde2,12,
C. Cruse10,
M. Dam9,
K. M. Danielsen24,
M. Danilov22,
S. De Castro6,
H. Deppe14,
X. Dong3,
H. B. Dreis14,
V. Egorytchev12,
K. Ehret10,
F. Eisele14,
D. Emeliyanov12,
S. Essenov22,
L. Fabbri6,
P. Faccioli6,
M. Feuerstack-Raible14,
J. Flammer12,
B. Fominykh22,
M. Funcke10,
Ll. Garrido2,
A. Gellrich29,
B. Giacobbe6,
P. Giovannini6,
J. Gläß20,
D. Goloubkov12,33,
Y. Golubkov12,34,
A. Golutvin22,
I. Golutvin11,
I. Gorbounov12,26,
A. Gorišek17,
O. Gouchtchine22,
D. C. Goulart7,
S. Gradl14,
W. Gradl14,
F. Grimaldi6,
J. Groth-Jensen9,
Yu. Guilitsky22,35,
J. D. Hansen9,
J. M. Hernández29,
W. Hofmann13,
M. Hohlmann12,
T. Hott14,
W. Hulsbergen1,
U. Husemann26,
O. Igonkina22,
M. Ispiryan15,
T. Jagla13,
C. Jiang3,
H. Kapitza12,
S. Karabekyan25,
N. Karpenko11,
S. Keller26,
J. Kessler14,
F. Khasanov22,
Yu. Kiryushin11,
I. Kisel23,
E. Klinkby9,
K. T. Knöpfle13,
H. Kolanoski5,
S. Korpar21,17,
C. Krauss14,
P. Kreuzer12,19,
P. Križan18,17,
D. Krücker5,
S. Kupper17,
T. Kvaratskheliia22,
A. Lanyov11,
K. Lau15,
B. Lewendel12,
T. Lohse5,
B. Lomonosov12,32,
R. Männer20,
R. Mankel29,
S. Masciocchi12,
I. Massa6,
I. Matchikhilian22,
G. Medin5,
M. Medinnis12,
M. Mevius12,
A. Michetti12,
Yu. Mikhailov22,35,
R. Mizuk22,
R. Muresan9,
M. zur Nedden5,
M. Negodaev12,32,
M. Nörenberg12,
S. Nowak29,
M. T. Núñez Pardo de Vera12,
M. Ouchrif28,1,
F. Ould-Saada24,
C. Padilla12,
D. Peralta2,
R. Pernack25,
R. Pestotnik17,
B. AA. Petersen9,
M. Piccinini6,
M. A. Pleier13,
M. Poli6,31,
V. Popov22,
D. Pose11,14,
S. Prystupa16,
V. Pugatch16,
Y. Pylypchenko24,
J. Pyrlik15,
K. Reeves13,
D. Reßing12,
H. Rick14,
I. Riu12,
P. Robmann30,
I. Rostovtseva22,
V. Rybnikov12,
F. Sánchez13,
A. Sbrizzi1,
M. Schmelling13,
B. Schmidt12,
A. Schreiner29,
H. Schröder25,
U. Schwanke29,
A. J. Schwartz7,
A. S. Schwarz12,
B. Schwenninger10,
B. Schwingenheuer13,
F. Sciacca13,
N. Semprini-Cesari6,
S. Shuvalov22,5,
L. Silva8,
L. Sözüer12,
S. Solunin11,
A. Somov12,
S. Somov12,33,
J. Spengler13,
R. Spighi6,
A. Spiridonov29,22,
A. Stanovnik18,17,
M. Starič17,
C. Stegmann5,
H. S. Subramania15,
M. Symalla12,10,
I. Tikhomirov22,
M. Titov22,
I. Tsakov27,
U. Uwer14,
C. van Eldik12,10,
Yu. Vassiliev16,
M. Villa6,
A. Vitale6,
I. Vukotic5,29,
H. Wahlberg28,
A. H. Walenta26,
M. Walter29,
J. J. Wang4,
D. Wegener10,
U. Werthenbach26,
H. Wolters8,
R. Wurth12,
A. Wurz20,
S. Xella-Hansen9,
Yu. Zaitsev22,
M. Zavertyaev12,13,32,
T. Zeuner12,26,
A. Zhelezov22,
Z. Zheng3,
R. Zimmermann25,
T. Živko17,
A. Zoccoli6
1NIKHEF, 1009 DB Amsterdam, The Netherlands a
2Department ECM, Faculty of Physics, University of Barcelona, E-08028 Barcelona, Spain b
3Institute for High Energy Physics, Beijing 100039, P.R. China
4Institute of Engineering Physics, Tsinghua University, Beijing 100084, P.R. China
5Institut für Physik, Humboldt-Universität zu Berlin, D-12489 Berlin, Germany c,d
6Dipartimento di Fisica dell’ Università di Bologna and INFN Sezione di Bologna, I-40126 Bologna, Italy
7Department of Physics, University of Cincinnati, Cincinnati, Ohio 45221, USA e
8LIP Coimbra, P-3004-516 Coimbra, Portugal f
9Niels Bohr Institutet, DK 2100 Copenhagen, Denmark g
10Institut für Physik, Universität Dortmund, D-44221 Dortmund, Germany d
11Joint Institute for Nuclear Research Dubna, 141980 Dubna, Moscow region, Russia
12DESY, D-22603 Hamburg, Germany
13Max-Planck-Institut für Kernphysik, D-69117 Heidelberg, Germany d
14Physikalisches Institut, Universität Heidelberg, D-69120 Heidelberg, Germany d
15Department of Physics, University of Houston, Houston, TX 77204, USA e
16Institute for Nuclear Research, Ukrainian Academy of Science, 03680 Kiev, Ukraine h
17J. Stefan Institute, 1001 Ljubljana, Slovenia i
18University of Ljubljana, 1001 Ljubljana, Slovenia
19University of California, Los Angeles, CA 90024, USA j
20Lehrstuhl für Informatik V, Universität Mannheim, D-68131 Mannheim, Germany
21University of Maribor, 2000 Maribor, Slovenia
22Institute of Theoretical and Experimental Physics, 117259 Moscow, Russia k
23Max-Planck-Institut für Physik, Werner-Heisenberg-Institut, D-80805 München, Germany d
24Dept. of Physics, University of Oslo, N-0316 Oslo, Norway l
25Fachbereich Physik, Universität Rostock, D-18051 Rostock, Germany d
26Fachbereich Physik, Universität Siegen, D-57068 Siegen, Germany d
27Institute for Nuclear Research, INRNE-BAS, Sofia, Bulgaria
28Universiteit Utrecht/NIKHEF, 3584 CB Utrecht, The Netherlands a
29DESY, D-15738 Zeuthen, Germany
30Physik-Institut, Universität Zürich, CH-8057 Zürich, Switzerland m
31visitor from Dipartimento di Energetica dell’ Università di Firenze and INFN Sezione di Bologna, Italy
32visitor from P.N. Lebedev Physical Institute, 117924 Moscow B-333, Russia
33visitor from Moscow Physical Engineering Institute, 115409 Moscow, Russia
34visitor from Moscow State University, 119899 Moscow, Russia
35visitor from Institute for High Energy Physics, Protvino, Russia
36visitor from High Energy Physics Institute, 380086 Tbilisi, Georgia
†deceased
Abstract
The production cross section in GeV proton-nucleus fixed target collisions is measured by observing double muonic decays of -flavoured hadrons in the kinematic region . A total number of events is obtained with a likelihood fit of the signal and background simulated events to the data. The resulting cross section is , or, when combined with a previous HERA-B measurement of similar precision, , which is consistent with recent NLO calculations.
1 Introduction
The measurement of bottom production in fixed target collisions offers the possibility to test perturbative QCD in the near threshold energy regime, where the effect of higher order processes, such as soft gluon emission, has been calculated [1, 2]. At first order, the production mechanism at the HERA-B energy () is dominated by gluon-gluon fusion () [3].
Three experimental results are published. Two are inconsistent, even though they were obtained by similar experiments searching for [4] and semi-leptonic [5] decays of -flavoured hadrons. HERA-B recently published the most accurate result based on a measurement of decays of the -flavoured hadrons [6].
In this paper, a measurement of the production cross section performed with a tagging technique independent from our previous measurement is presented.
After production, pairs hadronise and mostly decay into -flavoured hadrons. Since -flavoured and -flavoured hadrons have a large probability to decay with the emission of a muon (“semi-muonic decay”) [7], the production cross section is measured by searching for decay events, in which at least two of the four heavy quarks typically produced in a event (, , , ) undergo semi-muonic decays (“double muonic decays”).
The event selection is based on a pair of oppositely charged muons not coming from the primary interaction vertex, having a large momentum transverse to the beam.
2 Detector and data sample
HERA-B [8, 9] is a large acceptance forward spectrometer installed at the GeV proton storage ring of DESY. The Feynman- () of accepted muons from semi-muonic decays is between and . The detector is used to reconstruct charged particle tracks produced in the interactions of the proton beam halo with wires of different materials (, and ), in several configurations [10]. Particles are tracked with a silicon microstrip detector [11] whose first station (of ) is a few centimeters from the target system and which extends approximately m further downstream. A primary vertex resolution of m along the beam and m in the perpendicular plane is achieved. Up to m downstream of the target, honeycomb chambers in the outer region [12, 13], and microstrip gaseous chambers in the inner region [14], allow to track particles and to measure their momenta from the bending in a Tm vertical magnetic field. A Cherenkov detector [15] is used for separation. An electromagnetic shashlik calorimeter [16] serves for and identification. At the rear of the detector, muons with momenta larger than are tracked with triple stereo layers of gaseous tube chambers interleaved with hadron absorbers [17].
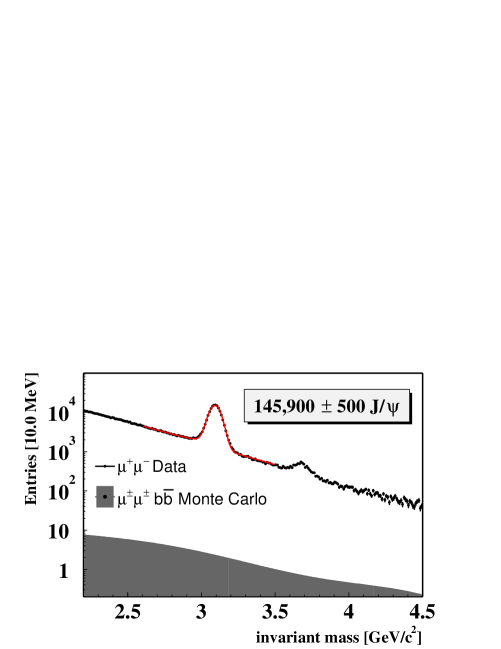
Double muonic decays are searched for in events of -C, -Ti and -W interactions ( overlapped interactions per event, in average) collected with a multilevel dilepton trigger [18] in the - data taking period. The trigger is designed to select dilepton decays of mesons produced in the proton-nucleus collisions. By applying dimuon selection criteria similar to those of reference [6], about prompt mesons are reconstructed. With this event selection, double muonic decays are a tiny fraction of the surviving muon pairs (Figure 1).
The systematic uncertainties due to the detector performance and acceptance is reduced by normalising the production cross section to the prompt cross section.
3 Monte Carlo simulation
The acceptance and the reconstruction efficiencies are determined through Monte Carlo simulations of the physics processes occurring in proton-nucleus interactions. For bottom and charm production, PYTHIA 5.7 [20] is used. For bottom production, the predictions of NRQCD models are used, while production is tuned to match the and distributions measured by other experiments. The fragmentation process is simulated by JETSET 7.4 [20]. The energy left from the hard scattering is used by FRITIOF [21] to simulate the underlying inelastic event. The response of the detector is simulated by GEANT 3.21 [22]. See, for more details, reference [6].
4 Measurement method
The production cross section can be expressed as
where is the total number of double muonic decays in our sample, [23] is the prompt production cross section in the detector acceptance () and is the branching ratio for decays () [7]. The term is defined as
where the index runs over different target configurations. The index refers to the different ways to generate dimuons via semileptonic or decays (Section 5) having different branching ratios () and reconstruction efficiency (, the superscript indicates the dimuon charge). The charge factors gives the fraction of resulting same-sign muons (Table 1), is the number of mesons reconstructed with efficiency , is the atomic weight of the target and [24] is the nuclear suppression in the central region. Nuclear effects are expected to be negligible for open bottom and open charm production.
The number is obtained with two methods leading to two determinations of the production cross section (Section 7).
5 Signal decay modes
The signal sample consists of events with two muons coming from semi-muonic decays of heavy quarks. Four heavy quarks are typically produced in a event (, , , ). Depending on the type of hadrons decaying in the semi-muonic mode (, +, + or ), four classes () of signal events are defined [25] (Table 1).
| Class | Decaying hadrons | Branching ratio | |
|---|---|---|---|
| + | |||
| + | |||
For each class, the branching ratio for dimuon decays is obtained from the branching ratios for semi-muonic and decays reported in the PDG [7]. The fraction of decays into same-sign muons () is given by a charge factor , - being the fraction of decays into opposite-sign muons (). The value of is determined through Monte Carlo simulations and includes the effect of and mixing and all possible decay paths leading to muon pairs.
A fifth class, which is not included above, must be also considered. Events in which pairs originate from double muonic decay of pairs from decays represent of the total signal events. These events are assigned to the class , which exhibits a similar final state. The systematic uncertainty corresponding to this choice is included in the branching ratio .
Events with more than two muons might fall into more than one class. In order to avoid multiple counting of signal events, the calculated branching ratios in Table 1 include the probability that -flavoured and -flavoured hadrons do not decay into muons, and events are assigned to classes with a priority given by the order of classes in Table 1.
6 Background contributions
The main background for event selection is made of events having two muon-like tracks not coming from the primary interaction vertex. Two sources of this type are considered: double muonic decays of -flavoured hadrons and random combinations of muons from decay of low mass mesons (mainly pions and kaons). The latter background is referred to as “combinatorial background”.
The Monte Carlo simulation shows that a cut around the mass (between and ) removes background events from decays and prompt decays. The mass region is excluded to be also statistically independent from the measurement of production cross section in [6], where events are identified with decays of the -flavoured hadrons.
Muons from Drell-Yan events are at least times less abundant than the combinatorial background in the invariant mass region of interest [26].
The number of background events from double muonic decays () is determined through a Monte Carlo simulation normalised to the number of prompt mesons reconstructed in the data. It can be expressed as
The term is the selection efficiency for double muonic decay events in the target configuration .
The combinatorial background in the channel () is determined with data.
Muons from double muonic decays do not come from the same decay vertex. However, the forward boost in fixed target collisions is such that tracks coming from two long lived particle decays are almost as close as those originating from a single particle decay. In double muonic decays, the middle point of the segment of minimum distance between the two muons () is preferentially located downstream of the target, while the region upstream of the target is dominated by combinatorial background, in both and channels.
Assuming that the combinatorial background in the two final states has a similar shape, the number of events are normalised with respect to the upstream side and the combinatorial background in the channel is estimated as the difference between the number of pairs in data () and those expected from double muonic decays in the same channel ()
is obtained from Monte Carlo simulations, under the assumption that , with the formula
where the term is defined as
The term indicates the reconstruction efficiency for double muonic decays into .
7 Data analysis
Two methods have been used to estimate the number of events from decay. A first method, which is used to obtain our final results, is described in Section 7.3 and a second method, which is used as a cross-check, is described in Section 7.4. With one exception (discussed below), the choice of cuts used in both methods is the same. Initial muon selection cuts are given in Section 7.1 and the procedure for optimizing the final cuts is described in Section 7.2.
The selection of decay events begins by requiring that the events have at least two muons.
7.1 Muon selection
A first general muon selection is performed by requiring a high-quality reconstructed triggered track having a momentum between and , a minimum transverse momentum () of and a minimum probability of the track fit () of . The muon likelihood [29], as measured in the muon detector, must be greater than .
7.2 Cut optimisation
Both muons of an event are required to have a minimum of and a minimum impact parameter to the target () of (where is the resolution). The is defined as the perpendicular distance between the target wire and the point on the track extrapolated to the -position of the target. The dimuon invariant mass () is required to be at least .
The optimal selection criteria are found by maximising the signal significance , which is defined as
The number of signal events (), which consists of oppositely charged muons, is obtained from Monte Carlo simulations, under the assumption that :
The formulae used to estimate the number of background events ( and ) have been presented in Section 6.
A large fraction of combinatorial background consists of muonic decays of kaons and pions. Since the angle between the emitted muon and the decaying particle (kaon or pion) is small, such a background is suppressed by increasing the lower limit on .
An upper limit on the kaon likelihood () [30], as measured in the Cherenkov detector, suppresses muon candidates from kaon decays.
A lower limit on suppresses muons from low mass particle decays, since they are expected to have a smaller than those from decays.
A lower limit on discriminates muons originating in decays from background muons. Since the is correlated with the lifetime of the decaying particle, and the lifetime of -flavoured hadrons is larger than that of -flavoured hadrons, the impact parameter cut suppresses open charm background.
In order to suppress background in the proximity of the target, a lower limit on the difference between the and the target positions along the -axis () is applied.
Unphysical events are suppressed by the requirement of the following upper limits: , , cm and . The optimisation of the last three cuts (lower limits on , and ) is performed simultaneously.
The optimisation procedure for results in the selection criteria listed in Table 2, where the number of surviving and pairs in the data, at each selection step, are also shown. After applying all cuts, the number of remaining dimuon candidates is
| Cut | ||
|---|---|---|
| High quality muon pairs | ||
| , | ||
| , no | ||
| Upper limits | ||
| , | ||
| cm |
In the main measurement method, the cut is relaxed to cm (see Section 7.3). For this cut value, the resulting numbers of opposite-sign and same-sign muons are and , respectively.
The invariant mass distribution of dimuon events surviving the selection is shown in Figure 2 (the invariant mass cut on the is removed for illustrative purposes).
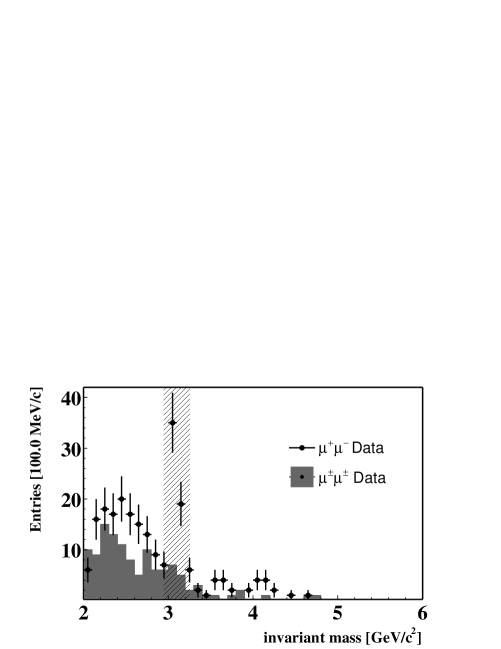
7.3 Cross section determination
In the main measurement method, the number of decay events in the data () is obtained from a likelihood fit to the data of the simulated and distributions of signal and background events. The selection criteria listed in Table 2 are applied, with the exception of the lower limit on , which is decreased to cm. The number of surviving pairs becomes
The selection on is relaxed because the likelihood fit uses more information than that used in the cut optimisation. The likelihood fit is also sensitive to the shapes of signal and background distributions, while the cut optimisation only uses the number of signal and background events surviving the selection.
The likelihood function is defined as
The product index runs over the () selected dimuon events, the exponential term accounts for Poisson fluctuations of signal and background, () and () are fit parameters representing the number of signal and background events in data, and are the products of the and probability distributions of the two muons for signal and background events, as obtained from the Monte Carlo simulations [25]:
The signal probability () is the sum of probabilities from decays of class (), , and () with ratio . The background probability () is obtained by adding the probability for charm and combinatorial events ( and ) with . The probability ratios and are determined through Monte Carlo simulations. Constant factors ( and ) are used to normalise the total probability to unity.
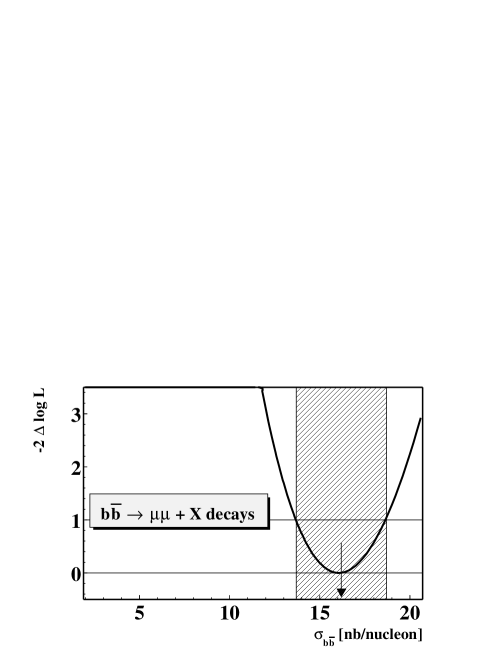
The result of the likelihood fit performed by minimising the quantity is shown in Figure 3. The minimum is obtained when and , which corresponds to the production Cross section:
7.4 Cross-check by a counting method
In a measurement method based on event counting, is obtained by subtracting all possible background events from the number of pairs surviving the selection listed in Table 2 ():
Assuming that the reconstruction efficiency of decays into is equal to that into , for each decay class in each target configuration (), which is true to within a few percent, the production cross section can be written as
where the term is given by
The number of dimuon events surviving the selection are and . The simulated charm background is , while the number of simulated decays into same-sign muons are . The resulting number of decays into opposite-sign muons is (the uncertainty takes into account the correlation between and ).
The result of the event counting method is the cross section .
Compared to the result of the likelihood fit, the statistical uncertainty is increased. This is due to the fact that the cross section is proportional to the difference between two numbers having a large statistical uncertainty (), while, in the previous method, is obtained from data only. However, for the likelihood fit, the selection criteria are relaxed, which implies that the selected events contain a larger fraction of background. The advantage is that the likelihood fit takes into account also the shapes of the signal and background distributions.
The likelihood fit is used to estimate the number of events in the data, while the event counting method serves to estimate the systematic uncertainty associated with the measurement method.
8 Systematic uncertainty
Many systematic uncertainties on the measurement presented in this paper are similar to those reported in reference [6], where the reader can find a detailed discussion of detector and trigger simulations, models used to simulate -flavoured hadron production and decay, production of mesons, fluctuations of the proton-nucleus interaction rate, beam position and shape.
The reconstruction efficiency and the production cross section of mesons are determined assuming no polarisation. The systematic uncertainty associated with production includes the effect of a polarization consistent with the limits provided by other experiments [31, 32, 33].
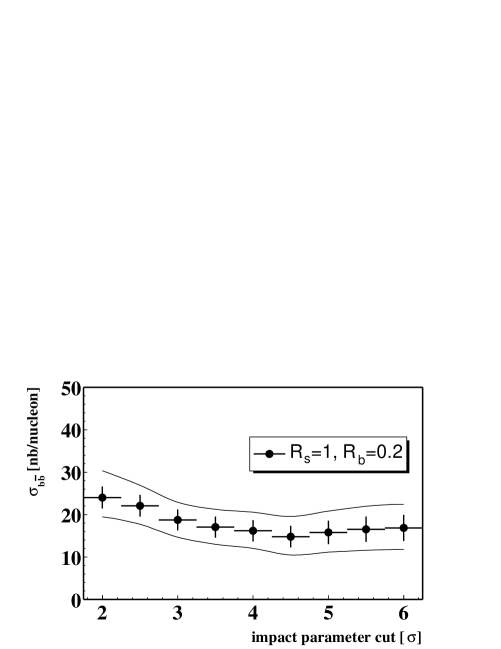
The contributions specifically affecting the cross section measurement from double muonic decays are evaluated. Those which are due to event selection are defined as the maximum variation of , divided by , obtained when varying crucial quantities in the likelihood fit, such as the impact parameter cut () and the assumptions on signal and background composition ( and ). The cut is varied between and , in the range [] and in the range [] (Figure 4).
For cut optimisation (Section 7.2), a cross section of is assumed. Since a variation of the value chosen for might result in a different event selection, the systematic uncertainty due to the assumption on is included in the effect of cut variation.
The systematic effect due to the measurement method is . This effect is estimated by determining with the two methods described in Section 7 on the events surviving the selection (Table 2).
The systematic effect due to the assignment of a priority to the classes of double muonic decays is negligible.
Assuming that all uncertainties listed in Table 3 are independent, the total systematic uncertainty is .
| Systematic effect | Uncertainty |
|---|---|
| Detector and trigger simulation | |
| production models | |
| production and decay models | |
| lifetime | |
| Proton-nucleus interaction rate | |
| Beam characteristics | |
| nuclear suppression () | |
| event counting | |
| Efficiency determination | |
| Charge factor () | |
| and ratios | |
| Measurement method | |
| Total |
9 Conclusions
The production cross section in GeV proton-nucleus fixed target collisions has been measured by using double muonic -flavoured hadron decays. The measurement is performed with a likelihood fit of the simulated kinematical distributions of the signal and background events to the HERA-B dimuon data. The result is
The result is consistent with our previous measurement [6], which was performed on a statistically independent set of events. Both measurements are normalized to the prompt production cross section.
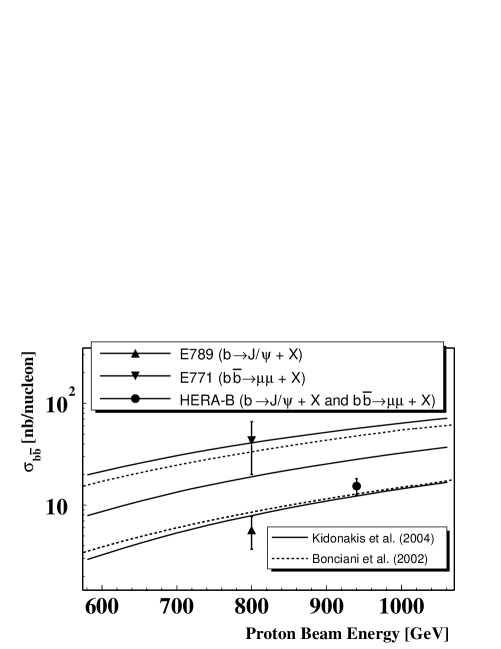
The combined result of the two HERA-B measurements, accounting for the correlation between their systematic uncertainties, is
which is consistent with the latest QCD predictions of Bonciani et al. [1] and Kidonakis et al. [2] based on NLO calculations and resummation of soft gluons (Figure 5).
Acknowledgments
We thank F. Ferrolini for many stimulating discussions. We express our gratitude to the DESY laboratory and accelerator group for their strong support since the conception of the HERA-B experiment. The HERA-B experiment would not have been possible without the enormous effort and commitment of our technical and administrative staff.
References
- [1] R. Bonciani et al., Nucl. Phys. B529 (1998) 424.
- [2] N. Kidonakis and R. Vogt, Eur. Phys. J. C36 (2004) 201.
- [3] N. Kidonakis et al., Phys. Rev. D64 (2001) 114001.
- [4] D. M. Jansen et al., Phys. Rev. Lett. 74 (1995) 3118.
- [5] T. Alexopoulos et al., Phys. Rev. Lett. 82 (1999) 41.
- [6] I. Abt et al., Phys. Rev. D73 (2006) 052005.
- [7] W.-M. Yao et al., J. Phys. G33 (2006) 1.
- [8] T. Lohse et al., DESY-PRC 94/02.
- [9] E. Hartouni et al., DESY-PRC 95/01.
- [10] K. Ehret et al., Nucl. Instrum. Meth. A446 (2000) 190.
- [11] C. Bauer et al., Nucl. Instrum. Meth. A501 (2003) 39.
- [12] H. Albrecht et al., Nucl. Instrum. Meth. A541 (2005) 610.
- [13] H. Albrecht et al., Nucl. Instrum. Meth. A555 (2005) 310.
- [14] Y. Bagaturia et al., Nucl. Instrum. Meth. A490 (2002) 223.
- [15] I. Ariño et al., Nucl. Instrum. Meth. A516 (2004) 445.
- [16] G. Avoni et al., Nucl. Instrum. Meth. A461 (2001) 332.
- [17] A. Arefiev et al., IEEE Trans. Nucl. Sci. 48 (2001) 1059.
- [18] V. Balagura et al., Nucl. Instrum. Meth. A494 (2002) 526.
- [19] A. Spiridonov, hep-ex/0510076 (unpublished).
- [20] T. Sjostrand, Comput. Phys. Commun. 82 (1994) 74.
- [21] H. Pi, Comput. Phys. Commun. 71 (1992) 173.
- [22] R. Brun et al., Internal report CERN DD/EE/84-1 .
- [23] F. Maltoni et al., Phys. Lett. B638 (2006) 202.
- [24] M. J. Leitch et al., Phys. Rev. Lett. 84 (2000) 3256.
- [25] A. Sbrizzi, Ph.D. thesis, NIKHEF, Amsterdam, 2006.
- [26] I. Abt et al., Phys. Lett. B638 (2006) 13.
- [27] C. Lourenço and H. K. Wöhri, Phys. Rept. 433 (2006) 127.
- [28] C. Lourenço and H. K. Wöhri, private communication.
- [29] M. Titov, Nucl. Instrum. Meth. A446 (2000) 355.
- [30] M. Staric et al., Nucl. Instrum. Meth. A433 (1999) 279.
- [31] T. Alexopoulos et al., Phys. Rev. D55 (1997) 3927.
- [32] A. Gribushin et al., Phys. Rev. D62 (2000) 012001.
- [33] T. H. Chang et al., Phys. Rev. Lett. 91 (2003) 211801.