BABAR-PUB-06/069
SLAC-PUB-12253
hep-ex/0612020
The BABAR Collaboration
Measurement of the Form-Factor Shape and Branching Fraction, and Determination of with a Loose Neutrino Reconstruction Technique
Abstract
We report the results of a study of the exclusive charmless semileptonic decay, , undertaken with approximately 227 million pairs collected at the resonance with the BABAR detector. The analysis uses events in which the signal decays are reconstructed with an innovative loose neutrino reconstruction technique. We obtain partial branching fractions in 12 bins of , the momentum transfer squared, from which we extract the form-factor shape and the total branching fraction = . Based on a recent unquenched lattice QCD calculation of the form factor in the range 16 , we find the magnitude of the CKM matrix element to be , where the last uncertainty is due to the normalization of the form factor.
pacs:
13.20.He, 12.15.Hh, 12.38.Qk, 14.40.NdA precise measurement of , the smallest element of the CKM matrix CKM , will constrain the description of weak interactions and violation in the Standard Model. The rate for exclusive decays PlusCC is proportional to , where the form factor depends on , the momentum transfer squared. Values of for decays are provided by unquenched lattice QCD (LQCD) calculations (HPQCD HPQCD04 , FNAL FNAL04 ), presently reliable only at large ( 16 ), by light cone sum rules (LCSR) calculations ball04 , based on approximations only valid at small ( 16 ), and by the ISGW2 quark model calculations isgw2 . Uncertainties on these calculations dominate the errors on the computed values of . The QCD theoretical predictions are at present more precise for than for other exclusive decays, where stands for any charmless meson. Experimental data can be used to discriminate between the various calculations by precisely measuring the shape, thereby leading to a smaller theoretical uncertainty on .
Values of have previously been extracted from measurements by CLEO CLEOpilnu2 , BABAR PRDJochen ; BAD1380 and Belle BELLEPiRholnu . In this letter, we present measurements of the partial branching fractions (BF) in 12 bins of using an innovative loose neutrino reconstruction technique. This leads to more precise values of the total BF and of the form-factor shape, which supersede those of our previous untagged measurement PRDJochen . We combine the values of with recent form-factor calculations HPQCD04 ; FNAL04 ; ball04 to obtain a value of .
The data set used in this analysis contains approximately 227 million pairs corresponding to an integrated luminosity of 206 collected at the resonance with the BABAR detector ref:babar at the PEP-II asymmetric-energy collider, and of 27.0 integrated luminosity of data collected approximately 40 below the resonance (denoted “off-resonance data”). To estimate the signal efficiency, and the signal and background distributions, we use a detailed Monte Carlo (MC) simulation of generic and “continuum” events as well as signal events. Signal MC events are produced by the FLATQ2 generator bad809 and are reweighted to reproduce the Becirevic-Kaidalov (BK) parametrization BK of where the values of the shape and normalization parameters, and , are taken from Ref. PRDJochen .
We reconstruct meson candidates using and tracks together with the event’s missing momentum as an approximation to the signal neutrino momentum. The decay of the second meson is not explicitly reconstructed. The neutrino four-momentum is inferred from the difference between the momentum of the colliding-beam particles , and the sum of the momenta of all the charged and neutral particles detected in a single event , such that . Compared with the tagged analyses in which the two mesons are explicitly reconstructed BAD1380 ; BELLEPiRholnu , the neutrino reconstruction approach yields a lower signal purity but a significant increase in the signal reconstruction efficiency. The present loose neutrino reconstruction technique also increases the signal efficiency substantially with respect to the previous untagged approach by avoiding the tight neutrino quality cuts CLEOpilnu2 ; PRDJochen which ensure that the neutrino properties are well taken into account when computing . In this analysis, we calculate instead the momentum transfer as , where the ambiguity in the direction of the meson is handled by use of the method described in Ref. DstrFF . In this way, the value of is unaffected by any mis-reconstruction of the rest of the event. We obtain a resolution of = 0.52 for the signal candidates in which the pion candidate track truly comes from a decay (91% of the total). We correct for the reconstruction effects on the resolution by applying an unregularized unfolding algorithm to the measured spectrum Cowan .
To separate the signal from the backgrounds, we require two well-reconstructed tracks associated with a lepton-pion pair. The electron (muon) tracks are required to have momenta greater than 0.5 (1.0) in the laboratory frame to avoid misidentified leptons and secondary semileptonic decays. We ensure that the momenta of the lepton and pion candidates are kinematically compatible with a real decay. This requires that a geometrical vertex fit of the two charged tracks gives a probability greater than 0.01 and that the angle between the and momenta in the frame takes a physical value: , where the pseudo-particle is defined by its four-momentum . Most backgrounds are efficiently rejected by -dependent cuts on the helicity angle of the boson bad809 , on the angle between the thrust axes of the and of the rest of the event, on the polar angle associated with , and on the squared invariant mass of . We reject candidates with mass close to the mass to avoid decays. Non- events are suppressed by requiring the ratio of second to zeroth Fox-Wolfram moments to be smaller than 0.5, and by cuts BhabhaVeto on the number of tracks and clusters. Radiative Bhabha and two-photon processes are rejected by vetoing events containing a photon conversion and by requiring and for candidates in the electron and positron channels, respectively, where the axis is given by the electron beam direction. We reduce the remaining backgrounds with the variables and , where and is the total energy in the frame. Only candidates with are retained. When several candidates remain in an event after these cuts, the candidate with closest to zero is selected. This rejects 30% of the combinatorial signal candidates while keeping 97% of the correct ones. The signal event reconstruction efficiency varies between 6.7% and 9.8%, depending on the bin.
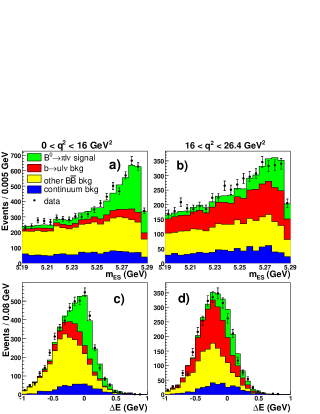
The signal yield is obtained as a function of by performing a two-dimensional extended maximum-likelihood fit Barlow on , and in each bin of . The data samples in each bin are divided into four categories: signal, other , other , and continuum backgrounds. These four types of events have distinct structures in the two-dimensional – plane. We use the – histograms obtained from the MC simulation as two-dimensional probability density functions (PDFs). The yields of the signal, background and other background, subdivided in twelve, three and four bins, respectively, are extracted from a nineteen-parameter fit of the MC PDFs to the experimental data. The continuum background is corrected to match the off-resonance data control sample and is fixed in the fit. The number and type of fit parameters were chosen to provide a good balance between reliance on simulation predictions, complexity of the fit and total error size. and fit projections for the experimental data are shown in Fig. 1 in two ranges of corresponding to the sum of eight bins below and four bins above = 16 . We obtain events for the total signal yield, events for the background, events for the other backgrounds, and events for the continuum yield. The fit has a value of 423 for 389 degrees of freedom.
Numerous sources of systematic uncertainties and their correlations among the bins have been investigated. The uncertainties due to the detector simulation are established by varying within bounds given by control samples the tracking efficiency of all charged tracks, the particle identification efficiencies of signal candidate tracks, the calorimeter efficiency (varied separately for photons, and neutrons) and the energy deposited in the calorimeter by mesons. The reconstruction of these neutral particles affects the analysis via the neutrino reconstruction. The uncertainties due to the generator-level inputs to the simulation are established by varying, within errors PDG06 , the BFs of the background processes , , and as well as the BF of the decay. The , , and form factors are varied within bounds given by recent calculations ball05 or measurements DstrFF ; PrelimRes ; PDG06 . The heavy quark parameters used in the simulation of non-resonant events are varied according to Ref. Henning . We assign an uncertainty of 20% to the final state radiation (FSR) corrections calculated by PHOTOS photos ; photosErr . Finally, the uncertainties due to the modeling of the continuum are established by varying its , , and shapes and total yield within their errors given by comparisons with the off-resonance data control sample. The high statistics provided by our technique allow us to show that there is good agreement between data and simulation for the critical variables in signal depleted, signal enhanced, enhanced and continuum control samples. Consistent results are obtained either by dividing the final dataset into sub-samples or using modified binnings or modified event selections.
The partial BFs are calculated using the observed signal yields, the unfolding algorithm and the signal efficiencies given by the simulation. The total BF is given by the sum of the partial BFs, thereby reducing the sensitivity of the signal efficiency to the uncertainties of the form factor. We compute the covariance matrix for each source of uncertainty and use these matrices to calculate the errors on the total BF. The fit and systematic errors are given in Table 1 for five ranges of . The complete set of fit and systematic uncertainties of the partial and total BFs as well as their correlation matrices are given in Ref. EPAPS . Our value of the total BF, , is comparable in precision to the world average prior to our result PDG06 : . The systematic error is due in large part to the detector efficiency. The systematic errors arising from the BFs and form factors of the backgrounds have been reduced with respect to previous untagged measurements by the many-parameter fit to the background yields in the 12 bins of .
| bins () | 4–6 | 16–18 | 16 | 16 | full range |
|---|---|---|---|---|---|
| BF () | 0.16 | 0.13 | 1.09 | 0.38 | 1.46 |
| Fit error | 12.8 | 17.6 | 5.3 | 10.3 | 4.8 |
| Detector effects | 3.7 | 5.0 | 4.4 | 4.5 | 3.7 |
| Continuum bkg | 1.2 | 1.7 | 2.8 | 3.5 | 2.5 |
| bkg | 3.0 | 3.1 | 2.3 | 4.7 | 2.5 |
| bkg | 1.7 | 1.8 | 1.2 | 1.2 | 1.0 |
| Other effects | 3.4 | 3.0 | 2.3 | 2.3 | 2.3 |
| Total error | 14.2 | 19.0 | 8.2 | 12.9 | 7.5 |
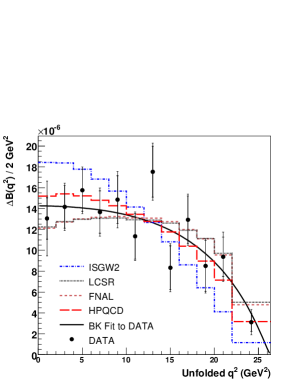
The distribution is displayed in Fig. 2 together with theoretical predictions. We modify the measured distribution to remove FSR effects, in order to allow a direct comparison with the theoretical predictions which do not include such effects (this procedure is referred to as “No FSR” in Ref. EPAPS ). We obtain the shape from a fit to this distribution. The function minimized in the fit uses a PDF based on the two-parameter BK parametrization. It is defined in terms of the covariance matrix to take into account the correlations among the measurements in the various bins. The fit gives = , compared to our previous untagged measurement PRDJochen (statistical error only) as well as a value of = from the fit extrapolated to , with =65%. This value includes a 67% anti-correlation between the shape and normalization parameters, and , and can be used to predict Hill rates of other decays such as .
The probabilities have been calculated relative to the binned data result for various theoretical predictions, considering only experimental errors. We obtain =67% for HPQCD HPQCD04 , 45% for FNAL FNAL04 and 41% for LCSR ball04 . The ISGW2 quark model isgw2 , =0.06%, is clearly incompatible with our data.
| () | (ps-1) | () | |
|---|---|---|---|
| HPQCD HPQCD04 | 16 | ||
| FNAL FNAL04 | 16 | ||
| LCSR ball04 | 16 | ||
| ISGW2 isgw2 | 0–26.4 |
We extract from the partial BFs using the relation: , where ps PDG06 is the lifetime and is the normalized partial decay rate predicted by the form-factor calculations HPQCD04 ; FNAL04 ; ball04 ; isgw2 . Excluding the ISGW2 model, the values of given in Table 2 range from .
In summary, we have measured the partial branching fractions in 12 bins of using a loose neutrino reconstruction technique. We obtained the most precise measurement to date of the and , as well as a detailed description of the shape. This shape can be compared with various theoretical predictions and, in particular, shows that the ISGW2 model can be ruled out. From the most recently published unquenched LQCD calculation HPQCD04 , we obtain = .
We are grateful for the excellent luminosity and machine conditions provided by our PEP-II colleagues, and for the substantial dedicated effort from the computing organizations that support BABAR. The collaborating institutions wish to thank SLAC for its support and kind hospitality. This work is supported by DOE and NSF (USA), NSERC (Canada), IHEP (China), CEA and CNRS-IN2P3 (France), BMBF and DFG (Germany), INFN (Italy), FOM (The Netherlands), NFR (Norway), MIST (Russia), MEC (Spain), and PPARC (United Kingdom). Individuals have received support from the Marie Curie EIF (European Union) and the A. P. Sloan Foundation.
References
- (1) M. Kobayashi and T. Maskawa, Prog. Theor. Phys. 49, 652 (1973).
- (2) Charge conjugate decays and or are implied throughout this paper.
- (3) E. Gulez et al. (HPQCD Collaboration), Phys. Rev. D73, 074502 (2006).
- (4) M. Okamoto et al., Nucl. Phys. Proc. Suppl. 140, 461 (2005).
- (5) P. Ball and R. Zwicky, Phys. Rev. D71, 014015 (2005).
- (6) D. Scora and N. Isgur, Phys. Rev. D52, 2783 (1995).
- (7) S. B. Athar et al. (CLEO Collaboration), Phys. Rev. D68, 072003 (2003).
- (8) B. Aubert et al. (BABAR Collaboration), Phys. Rev. D72, 051102 (2005).
- (9) B. Aubert et al. (BABAR Collaboration), Phys. Rev. Lett. 97, 211801 (2006).
- (10) T. Hokuue et al. (Belle Collaboration), hep-ex/0604024, submitted to Phys. Lett. B.
- (11) B. Aubert et al. (BABAR Collaboration), Nucl. Instrum. Methods A479, 1 (2002).
- (12) D. Côté et al., Eur. Phys. J. C 38, 105 (2004).
- (13) D. Becirevic and A. B. Kaidalov, Phys. Lett. B478, 417 (2000).
- (14) B. Aubert et al. (BABAR Collaboration), Phys. Rev. D74, 092004 (2006).
- (15) G. Cowan, Statistical Data Analysis, Chap. 11, Oxford University Press (1998).
- (16) B. Aubert et al. (BABAR Collaboration), Phys. Rev. D67, 031101 (2003).
- (17) R.J. Barlow and C. Beeston, Comput. Phys. Commun. 77, 219 (1993).
- (18) W.-M. Yao et al. (Particle Data Group), J. Phys. G33, 1 (2006).
- (19) P. Ball and R. Zwicky, Phys. Rev. D71, 014029 (2005).
- (20) B. Aubert et al. (BABAR Collaboration), hep-ex/0607060.
- (21) O. L. Buchmüller and H. U. Flächer, Phys. Rev. D73, 073008 (2006).
- (22) E. Barberio and Z. Was, Comput. Phys. Commun. 79, 291 (1994).
- (23) E. Richter-Was et al., Phys. Lett. B303, 163 (1993).
- (24) See EPAPS Document No. for tables of systematic errors and error matrices. For more information on EPAPS, see http://www.aip.org/pubservs/epaps.html.
- (25) T. Becher and R. J. Hill, Phys. Lett. B633, 61 (2006).
| bins () | 0-2 | 2-4 | 4-6 | 6-8 | 8-10 | 10-12 | 12-14 | 14-16 | 16-18 | 18-20 | 20-22 | 22-26.4 | 16 | 16 | Total |
|---|---|---|---|---|---|---|---|---|---|---|---|---|---|---|---|
| Fitted yield | 366.6 | 462.9 | 499.5 | 451.8 | 436.4 | 391.0 | 522.7 | 333.6 | 458.0 | 355.4 | 364.8 | 428.8 | 3464.6 | 1606.9 | 5071.5 |
| Fit error | 12.9 | 9.7 | 8.6 | 9.7 | 11.2 | 13.0 | 11.7 | 17.4 | 15.6 | 21.7 | 15.9 | 17.3 | 5.3 | 9.9 | 5.0 |
| Systematic error | 20.0 | 6.3 | 3.2 | 4.9 | 6.3 | 4.1 | 4.3 | 6.1 | 4.9 | 7.9 | 12.3 | 17.4 | 3.7 | 7.3 | 3.9 |
| Unfolded yield | 374.7 | 452.3 | 515.3 | 442.2 | 459.1 | 360.7 | 583.4 | 302.7 | 514.3 | 357.7 | 406.3 | 303.0 | 3490.2 | 1581.3 | 5071.5 |
| Fit error | 15.2 | 14.4 | 12.8 | 14.8 | 15.4 | 19.2 | 13.9 | 25.2 | 17.6 | 28.5 | 20.2 | 27.7 | 5.4 | 10.2 | 5.0 |
| Systematic error | 22.9 | 7.3 | 3.7 | 5.6 | 7.8 | 5.2 | 4.8 | 8.9 | 5.2 | 10.0 | 14.9 | 27.3 | 3.7 | 7.6 | 3.9 |
| Efficiency | 6.56 | 7.13 | 7.22 | 7.11 | 6.76 | 6.97 | 7.21 | 7.87 | 8.68 | 9.20 | 9.37 | 9.66 | - | - | - |
| Eff. (No FSR) | 6.31 | 7.02 | 7.19 | 7.11 | 6.79 | 6.99 | 7.32 | 7.99 | 8.75 | 9.25 | 9.53 | 9.73 | - | - | - |
| 125.5 | 139.5 | 156.9 | 136.8 | 149.4 | 113.7 | 177.9 | 84.5 | 130.3 | 85.5 | 95.3 | 68.9 | 1084.3 | 380.0 | 1464.3 | |
| (No FSR) | 130.6 | 141.6 | 157.5 | 136.7 | 148.6 | 113.5 | 175.3 | 83.3 | 129.3 | 85.1 | 93.8 | 68.4 | 1087.1 | 376.6 | 1463.7 |
| Fit error | 15.2 | 14.4 | 12.8 | 14.8 | 15.4 | 19.2 | 13.9 | 25.2 | 17.6 | 28.5 | 20.2 | 27.7 | 5.3 | 10.3 | 4.8 |
| Systematic error | 23.7 | 7.0 | 6.2 | 8.1 | 9.6 | 7.3 | 7.1 | 11.0 | 7.0 | 11.0 | 14.9 | 27.0 | 6.3 | 7.8 | 5.7 |
| bins () | 0-2 | 2-4 | 4-6 | 6-8 | 8-10 | 10-12 | 12-14 | 14-16 | 16-18 | 18-20 | 20-22 | 22-26.4 | 16 | 16 | Total |
|---|---|---|---|---|---|---|---|---|---|---|---|---|---|---|---|
| Tracking efficiency | 1.6 | 1.7 | 1.3 | 3.1 | 3.8 | 1.3 | 1.8 | 7.1 | 2.3 | 1.7 | 2.2 | 9.2 | 1.9 | 1.8 | 1.1 |
| efficiency | 4.7 | 1.3 | 2.6 | 5.0 | 3.6 | 3.2 | 3.5 | 3.1 | 3.0 | 3.5 | 3.8 | 7.0 | 2.9 | 1.7 | 1.9 |
| & neutrons | 0.7 | 0.6 | 0.7 | 1.0 | 1.2 | 1.2 | 1.2 | 1.3 | 2.0 | 1.5 | 1.1 | 2.2 | 0.5 | 1.0 | 0.6 |
| Particle ID | 7.0 | 2.5 | 2.1 | 1.9 | 0.7 | 2.7 | 2.6 | 2.5 | 2.6 | 3.4 | 2.9 | 7.0 | 2.6 | 3.6 | 2.9 |
| Continuum yield | 7.0 | 0.5 | 0.6 | 0.2 | 0.9 | 1.0 | 0.6 | 0.8 | 0.6 | 1.9 | 1.1 | 4.0 | 1.0 | 1.6 | 1.0 |
| Continuum | 20.1 | 1.5 | 1.0 | 1.0 | 1.7 | 1.8 | 1.5 | 2.0 | 1.5 | 3.3 | 4.0 | 8.7 | 2.4 | 1.9 | 1.8 |
| Continuum | 1.1 | 0.3 | 0.1 | 0.1 | 0.1 | 0.1 | 0.3 | 0.6 | 0.3 | 0.6 | 0.7 | 1.0 | 0.2 | 0.5 | 0.2 |
| Continuum | 3.0 | 1.6 | 0.5 | 1.0 | 1.5 | 0.2 | 0.1 | 1.2 | 0.6 | 1.8 | 3.8 | 5.2 | 1.0 | 2.5 | 1.4 |
| BFs | 1.2 | 1.4 | 0.7 | 0.7 | 1.0 | 1.4 | 1.1 | 1.8 | 1.7 | 3.6 | 10.4 | 12.1 | 0.9 | 3.4 | 1.2 |
| SF param | 0.4 | 0.5 | 0.3 | 0.5 | 0.1 | 0.1 | 0.1 | 0.4 | 0.4 | 4.1 | 5.7 | 14.9 | 0.2 | 2.1 | 0.7 |
| FFs | 1.3 | 0.7 | 1.8 | 1.1 | 0.8 | 1.1 | 1.2 | 3.2 | 0.5 | 3.3 | 1.3 | 4.3 | 0.9 | 0.8 | 0.6 |
| FF | 0.4 | 0.5 | 0.5 | 0.5 | 0.5 | 0.5 | 0.5 | 0.8 | 0.7 | 0.7 | 1.1 | 3.5 | 0.5 | 1.3 | 0.7 |
| FSR | 0.7 | 1.5 | 2.2 | 1.9 | 2.6 | 2.7 | 2.2 | 0.6 | 2.5 | 2.0 | 1.3 | 1.1 | 1.9 | 1.8 | 1.9 |
| BFs | 1.8 | 2.1 | 1.1 | 2.2 | 4.6 | 1.2 | 2.4 | 2.2 | 1.3 | 2.5 | 1.7 | 2.2 | 0.9 | 1.0 | 0.8 |
| FFs | 0.7 | 1.1 | 0.1 | 1.6 | 3.1 | 0.8 | 1.4 | 1.0 | 0.9 | 1.2 | 0.6 | 2.7 | 0.7 | 0.4 | 0.6 |
| FF | 1.7 | 1.2 | 0.7 | 0.3 | 2.2 | 0.4 | 0.1 | 0.7 | 0.6 | 0.9 | 0.4 | 0.7 | 0.1 | 0.4 | 0.2 |
| BF | 2.1 | 2.5 | 1.5 | 1.5 | 1.3 | 1.7 | 1.6 | 1.2 | 1.6 | 1.0 | 2.4 | 1.9 | 1.7 | 1.7 | 1.7 |
| BFs | 2.3 | 2.8 | 1.1 | 1.3 | 1.6 | 1.1 | 1.1 | 0.9 | 0.6 | 0.9 | 1.0 | 0.8 | 0.4 | 0.5 | 0.3 |
| BFs | 0.6 | 1.7 | 2.3 | 1.5 | 2.0 | 2.3 | 1.0 | 4.2 | 1.8 | 3.9 | 1.0 | 1.7 | 1.1 | 1.0 | 1.1 |
| B counting | 1.1 | 1.1 | 1.1 | 1.1 | 1.1 | 1.1 | 1.1 | 1.1 | 1.1 | 1.1 | 1.1 | 1.1 | 1.1 | 1.1 | 1.1 |
| Signal MC stat error | 1.5 | 1.7 | 1.6 | 1.9 | 1.6 | 1.9 | 1.4 | 1.8 | 1.4 | 1.6 | 1.3 | 1.5 | 0.5 | 0.6 | 0.4 |
| Total systematic error | 23.7 | 7.0 | 6.2 | 8.1 | 9.6 | 7.3 | 7.1 | 11.0 | 7.0 | 11.0 | 14.9 | 27.0 | 6.3 | 7.8 | 5.7 |
| Fit error | 15.2 | 14.4 | 12.8 | 14.8 | 15.4 | 19.2 | 13.9 | 25.2 | 17.6 | 28.5 | 20.2 | 27.7 | 5.3 | 10.3 | 4.8 |
| Total error | 28.2 | 16.1 | 14.2 | 16.9 | 18.2 | 20.5 | 15.6 | 27.5 | 19.0 | 30.6 | 25.1 | 38.7 | 8.2 | 12.9 | 7.5 |
| bins | ||||||||||||
|---|---|---|---|---|---|---|---|---|---|---|---|---|
| () | 0-2 | 2-4 | 4-6 | 6-8 | 8-10 | 10-12 | 12-14 | 14-16 | 16-18 | 18-20 | 20-22 | 22-26.4 |
| 0-2 | 1.00 | -0.26 | 0.11 | 0.01 | 0.06 | 0.01 | 0.03 | -0.01 | -0.00 | -0.00 | -0.00 | -0.01 |
| 2-4 | -0.26 | 1.00 | -0.33 | 0.14 | 0.03 | -0.00 | 0.01 | -0.00 | -0.00 | -0.00 | -0.00 | -0.00 |
| 4-6 | 0.11 | -0.33 | 1.00 | -0.30 | 0.21 | 0.05 | 0.13 | -0.02 | -0.00 | -0.00 | -0.00 | -0.00 |
| 6-8 | 0.01 | 0.14 | -0.30 | 1.00 | -0.22 | 0.15 | 0.09 | -0.01 | -0.00 | -0.00 | -0.00 | -0.00 |
| 8-10 | 0.06 | 0.03 | 0.21 | -0.22 | 1.00 | -0.22 | 0.20 | -0.03 | 0.00 | -0.00 | -0.00 | -0.00 |
| 10-12 | 0.01 | -0.00 | 0.05 | 0.15 | -0.22 | 1.00 | -0.02 | 0.02 | -0.00 | 0.00 | -0.00 | -0.00 |
| 12-14 | 0.03 | 0.01 | 0.13 | 0.09 | 0.20 | -0.02 | 1.00 | -0.25 | -0.00 | -0.03 | 0.00 | -0.00 |
| 14-16 | -0.01 | -0.00 | -0.02 | -0.01 | -0.03 | 0.02 | -0.25 | 1.00 | 0.06 | 0.21 | -0.06 | -0.04 |
| 16-18 | -0.00 | -0.00 | -0.00 | -0.00 | 0.00 | -0.00 | -0.00 | 0.06 | 1.00 | 0.13 | -0.08 | -0.06 |
| 18-20 | -0.00 | -0.00 | -0.00 | -0.00 | -0.00 | 0.00 | -0.03 | 0.21 | 0.13 | 1.00 | -0.21 | -0.13 |
| 20-22 | -0.00 | -0.00 | -0.00 | -0.00 | -0.00 | -0.00 | 0.00 | -0.06 | -0.08 | -0.21 | 1.00 | -0.05 |
| 22-26.4 | -0.01 | -0.00 | -0.00 | -0.00 | -0.00 | -0.00 | -0.00 | -0.04 | -0.06 | -0.13 | -0.05 | 1.00 |
| bins | ||||||||||||
|---|---|---|---|---|---|---|---|---|---|---|---|---|
| () | 0-2 | 2-4 | 4-6 | 6-8 | 8-10 | 10-12 | 12-14 | 14-16 | 16-18 | 18-20 | 20-22 | 22-26.4 |
| 0-2 | 1.00 | 0.19 | 0.32 | 0.11 | -0.06 | 0.46 | 0.44 | 0.13 | 0.31 | 0.23 | 0.13 | 0.00 |
| 2-4 | 0.19 | 1.00 | 0.21 | -0.09 | -0.28 | 0.31 | 0.11 | -0.05 | 0.23 | 0.14 | 0.18 | 0.35 |
| 4-6 | 0.32 | 0.21 | 1.00 | 0.66 | 0.46 | 0.74 | 0.58 | 0.52 | 0.56 | 0.30 | 0.04 | 0.04 |
| 6-8 | 0.11 | -0.09 | 0.66 | 1.00 | 0.75 | 0.58 | 0.67 | 0.60 | 0.54 | 0.27 | -0.05 | -0.09 |
| 8-10 | -0.06 | -0.28 | 0.46 | 0.75 | 1.00 | 0.32 | 0.59 | 0.48 | 0.35 | 0.13 | 0.04 | -0.11 |
| 10-12 | 0.46 | 0.31 | 0.74 | 0.58 | 0.32 | 1.00 | 0.67 | 0.37 | 0.55 | 0.36 | 0.08 | 0.05 |
| 12-14 | 0.44 | 0.11 | 0.58 | 0.67 | 0.59 | 0.67 | 1.00 | 0.32 | 0.62 | 0.36 | 0.08 | -0.14 |
| 14-16 | 0.13 | -0.05 | 0.52 | 0.60 | 0.48 | 0.37 | 0.32 | 1.00 | 0.40 | 0.28 | 0.05 | -0.11 |
| 16-18 | 0.31 | 0.23 | 0.56 | 0.54 | 0.35 | 0.55 | 0.62 | 0.40 | 1.00 | 0.54 | 0.05 | -0.08 |
| 18-20 | 0.23 | 0.14 | 0.30 | 0.27 | 0.13 | 0.36 | 0.36 | 0.28 | 0.54 | 1.00 | -0.10 | 0.23 |
| 20-22 | 0.13 | 0.18 | 0.04 | -0.05 | 0.04 | 0.08 | 0.08 | 0.05 | 0.05 | -0.10 | 1.00 | 0.08 |
| 22-26.4 | 0.00 | 0.35 | 0.04 | -0.09 | -0.11 | 0.05 | -0.14 | -0.11 | -0.08 | 0.23 | 0.08 | 1.00 |