Branching fractions and direct CP asymmetries of charmless decay modes at the Tevatron
Abstract
We present new CDF results on the branching fractions and time-integrated direct CP asymmetries for and decay modes into pairs of charmless charged hadrons (pions or kaons). The data-set for this update amounts to 1 fb-1 of collisions at a center of mass energy . We report the first observation of the mode and a measurement of its branching fraction and direct CP asymmetry. We also observe for the first time two charmless decays of the -baryon: and .
1 INTRODUCTION
The decay modes of mesons into pairs of charmless pseudo-scalar mesons are effective probes of the quark-mixing (CKM) matrix and sensitive to potential new physics effects. The large production cross section of hadrons of all kinds at the Tevatron allows measuring such decays in new modes, which are important to supplement our understanding of meson decays. The still unobserved mode could be used to measure [1] and its CP asymmetry could be a powerful model-independent test of the source of direct CP asymmetry in the system [2]. This may provide useful information to solve the current discrepancy between the asymmetries observed in the neutral and charged mode [3].
The and modes proceed through annihilation and exchange topologies, which are currently poorly known and a source of significant uncertainty in many theoretical calculations [4, 5]. A measurement of both modes would allow a determination of the strength of these diagrams [6].
CDF II is a multipurpose magnetic spectrometer surrounded by calorimeters and muon detectors [7]. A silicon micro-strip detector (SVXII) and a cylindrical drift chamber (COT) situated in a 1.4 T solenoidal magnetic field reconstruct charged particles in the pseudo-rapidity range . The SVXII consists of five concentric layers of double-sided silicon detectors with radii between 2.5 and 10.6 cm, each providing a measurement with 15 m resolution in the azimuthal () direction and 70 m along the beam () direction. The COT has 96 measurement layers, between 40 and 137 cm in radius, organized into alternating axial and stereo “super-layers”. The transverse momentum resolution is /(GeV/) and the observed mass-widths are about 14 / for decays, and about 9 / for decays. The specific energy loss by ionization () of charged particles in the COT can be measured from the amount of charge collected by each wire.
Throughout this paper, C-conjugate modes are implied and branching fractions indicate CP-averages unless otherwise stated.
2 DATA SAMPLE
We analysed an integrated luminosity fb-1 sample of pairs of oppositely-charged particles with / and /, used to form meson candidates. The trigger required also a transverse opening angle between the two tracks, to reject background from particle pairs within the same jet and from back-to-back jets. In addition, both charged particles were required to originate from a displaced vertex with a large impact parameter (100 m mm), while the meson candidate was required to be produced in the primary interaction ( m) and to have travelled a transverse distance m.
In the offline analysis, an unbiased optimization procedure determined a tightened selection on track-pairs fit to a common decay vertex. We chose the selection cuts minimizing directly the expected uncertainty of the physics observables to be measured (through several “pseudo-experiments”). We used just two different sets of cuts, respectively optimized to measure the CP asymmetry and the branching fraction (), since those two measurements are the main focus of the analysis. For the latter, the sensitivity for discovery and limit setting [8] was optimized rather than the statistical uncertainty on the particular parameter, since the mode had not yet been observed. It was verified that the former set of cuts is also adequate to measure other decay rates of the larger yield modes (, ), while the latter, tighter set of cuts, is well suited to measure the decay rates and CP asymmetries related to rare modes (, , and ).
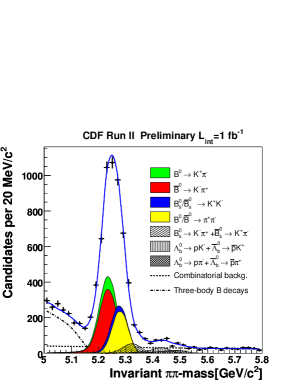
In addition to tightening the trigger cuts, in the offline analysis the discriminating power of the meson isolation and of the information provided by the 3D reconstruction capability of the CDF tracking were used, allowing a great improvement in the signal purity. Isolation is defined as , in which the sum runs over every other track (not from the meson) within a cone of unit radius in the space around the meson flight direction. By requiring , we reduced the background by a factor four while keeping almost 80% of signal. The 3D silicon tracking allowed multiple vertices to be resolved along the beam direction and the rejection of fake tracks, reducing the background by a factor of two, with only a small efficiency loss on signal. The resulting -mass distributions (see Fig. 1) show a clean signal of decays. In spite of a good mass resolution (), the various modes overlap into an unresolved mass peak.
3 FIT TO THE DECAY-MODE COMPOSITION
The resolution in invariant mass and in particle identification is not sufficient for separating the individual decay modes on an event-by-event basis, therefore we performed an unbinned maximum likelihood fit, combining kinematic and particle identification information to statistically determine both the contribution of each mode, and the relative contributions to the CP asymmetries. For the kinematic portion, we used three loosely correlated observables to summarize the information carried by all possible values of invariant mass of the candidate, resulting from different mass assignments to the two outgoing particles [9]. They are: (a) the mass calculated with the charged pion mass assignment to both particles; (b) the signed momentum imbalance , where () is the lower (higher) of the particle momenta, and is the sign of the charge of the particle of momentum ; (c) the scalar sum of the particle momenta . Using these three variables, the mass of any particular mode can be written as:
| (1) | |||||
| (2) |
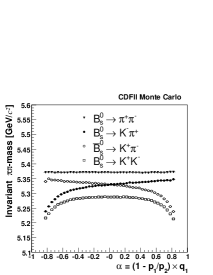
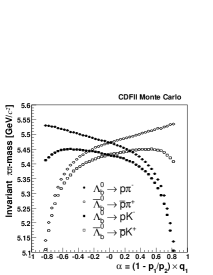
where () is the mass of the lower (higher) momentum particle. For simplicity, Eq. (1) is written as a function of and , but in the likelihood it was used as a function of and . The simulated average values of as a function of for the eight and modes are shown in Fig. 2.
Particle identification (PID) information is summarized by a single observable for track , defined as , where and are the expected depositions for those particle assignments. With the chosen observables, the likelihood contribution of the event is written as:
| (3) | |||||
where:
| (4) |
| (5) |
| (6) |
| (7) |
| (8) |
The various terms of the likelihood functions are described below.
The index runs over the twelve distinguishable and modes, and are their fractions to be determined by the fit, together with the total background fraction . The background is composed of two different kinds: combinatorial background and partially-reconstructed heavy flavor decays. The combinatorial background is composed of random pairs of charged particle, displaced from the beam-line, accidentally satisfying the selection requirements, while the latter, referred as “physics” background, is composed of multi-body -hadron decays (i.e. ) in which only two tracks are reconstructed. The indices label the physics (combinatorial) background quantities. The fraction of the physics background is given by and it is a free parameter in the fit.
Each likelihood term, both for signals and backgrounds, is factorized into three different contributions: a) the conditional probability distribution of the invariant mass given and (for the background is assumed to be independent of momentum), b) the joint conditional probability of PID variables , given , for a determined particles hypothesis, in the case of signals () and in the case of background (), and c) the joint probability distribution of momentum variables and ().
is the mass resolution function of each mode when the correct mass is assigned to both tracks. The average mass is the value of obtained from Eq. (1) by setting the appropriate particle masses for each decay mode and, by making a simple variable change, we obtain , where is the invariant mass computed with the correct mass assignment to both particles for each mode . and appear explicitly in the last equation since they are useful to parameterize the dependence of the mass resolution by the momenta.
The mass distribution of the physics background is parameterized with an “Argus function”, defined by the notation [10], convoluted with a Gaussian distribution centered at zero with a width, in this case, equal to the mass resolution, while the combinatorial background with an exponential function. The background mass distribution was determined in the fit by varying the parameters , and in Eq. (5,6). The function was parameterized by a product of polynomial and exponential functions fitted to Monte Carlo samples produced by a detailed detector simulation for each mode , instead for the background terms was obtained from the mass sidebands of data.
The mass resolution function was parameterized using the detailed detector simulation. To take into account non-Gaussian tails due to the emission of photons in the final state, we included soft photon emission in the simulation, using recent QED calculations [11]. The quality of the mass resolution model was verified in the simulation using about 500k decays (see Fig. 3).
The mass line-shape of the was fitted by fixing the signal shape from the model, and allowing to vary only the background function. Good agreement was obtained between data and simulation. In Eq. (4), the nominal , and masses measured by CDF [12] were used to reduce the systematic uncertainties related to the knowledge of the global mass scale.
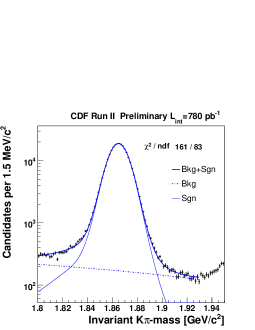
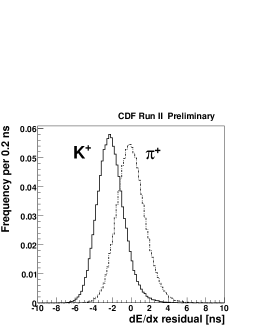
A sample of 1.5M decays, where the decay products are identified by the charge of the pion, was used to calibrate the response over the tracking volume and over time, and to determine the functions in Eq. (7,8). In a pure sample, we obtained separation between kaons and pions (see Fig. 4). The PID background term in Eq. (8) is similar to the signal terms, but allows for independent pion, kaon, proton, and electron components, which are free to vary independently for physics (combinatorial) background. In Eq. (8) the indices and run over the four possible particles and the fractions of different kind of particles , are free parameters in the fit. Muons are indistinguishable from pions with the available resolution.
4 FIT RESULTS AND SYSTEMATICS
We performed two separate fits: the first using the cuts optimized to measure the direct and the second to measure (). Significant signals are seen for , , and , previously observed by CDF [13]. Three new rare modes were observed for the first time: , and while no evidence was obtained for or .
| Mode | Ns | Quantity | Measurement | (10-6) |
|---|---|---|---|---|
| 4045 84 | -0.086 0.023 0.009 | |||
| 1121 63 | 0.259 0.017 0.016 | 5.10 0.33 0.36 | ||
| 1307 64 | 0.324 0.019 0.041 | 24.4 1.4 4.6 | ||
| 230 34 16 | 0.066 0.010 0.010 | 5.0 0.75 1.0 | ||
| 0.39 0.15 0.08 | ||||
| -3.21 1.60 0.39 | ||||
| 26 16 14 | 0.007 0.004 0.005 | 0.53 0.31 0.40 | ||
| ( @ 90% CL) | ||||
| 61 25 35 | 0.020 0.008 0.006 | 0.39 0.16 0.12 | ||
| ( @ 90% CL) | ||||
| 156 20 11 | 0.66 0.14 0.08 | |||
| 110 18 16 |
To convert the yields returned from the fit into relative branching fractions, we applied corrections for efficiencies of trigger and offline selection requirements for different decay modes. The relative efficiency corrections between modes do not exceed . Most corrections were determined from the detailed detector simulation, with some exceptions which were measured using data. A momentum-averaged relative isolation efficiency between and of was determined from fully-reconstructed samples of , , , and . The lower specific ionization of kaons with respect to pions in the drift chamber is responsible for a % lower efficiency to reconstruct a kaon. This effect was measured in a sample of decays triggered on two tracks, using the unbiased third track. The only correction needed for the direct CP asymmetries and was a shift due to the different probability for and to interact with the tracker material. The measurement of this correction has been achieved using a sample of 1M of prompt decays reconstructed and selected using the same criteria as decays. Assuming the Standard Model expectation of , the difference between the number of reconstructed and provides a measurement of the detector-induced asymmetry between and final states. Since the same fit technique developed for the decays was used, this measurement provides also a robust check on all possible charge asymmetry biases of the detector and parameterizations.
The and modes required a special treatment, since they contain a superposition of the flavor eigenstates of the . Their time evolution might differ from the one of the flavor-specific modes if the width difference between the mass eigenstates is significant. The current result was derived under the assumption that both modes are dominated by the short-lived component, that , and [14, 15]. The latter uncertainty is included in estimating the overall systematic uncertainty.
The dominant contributions to the systematic uncertainty are the statistical uncertainty on the isolation efficiency ( modes), the uncertainty on the calibration and parameterization, and the uncertainty of the combinatorial background model. The first is the larger systematic of all measurements with a meson decay (except for ). The second systematic, due to , is a large systematic of all measurements, although the parameterization of the is very accurate. The fit of composition is very sensitive to the PID information. The third one is due to the statistical uncertainty of the possible combinatorial background models and it is a dominant systematic for the observables of the rare modes. Smaller systematic uncertainties are assigned for trigger efficiencies, physics background shape, kinematics, meson masses and lifetimes.
5 RESULTS
The relative branching fractions are listed in Table 1, where and indicate the production fractions respectively of and from fragmentation of a quark in collisions. An upper limit is also quoted for modes in which no significant signal is observed [16]. We also list absolute results obtained by normalizing the data to the world-average of () [3]. The contributions from the likelihood fit for each decay mode are shown in Fig. 1.
We report the first observation of three new rare charmless decays , and with a significance respectively of , and . The significance includes both statistical and systematic uncertainty. The statistical uncertainty to evaluate the significance was estimated using several pseudo-experiments with no contributions from rare signals.
The branching fraction of the newly observed mode is in agreement with the latest theoretical expectation [17] which is lower than the previous predictions [4, 18]. We measured for the first time in the meson system the direct CP asymmetry of . This value favors a large CP violation in meson decays, conversely it is also compatible with zero. In Ref. [2] a robust test of the Standard Model or a probe of new physics is suggested by comparison of the direct CP asymmetries in and decays. Using HFAG input [3] we measure where is the decay width, in agreement with the Standard Model expectation of unity. Assuming that the relationship above is unity and using as input the () measured here, the world average for and () [3], we can estimate the expected value for in agreement with our measurement.
The branching fraction is in agreement with the latest theoretical expectation [19, 20] and with the previous CDF measurement [13]. An improved systematic uncertainty is expected for the final analysis of the same sample.
The results for the are in agreement with world average values [3]. The measurement is the world’s second best measurement and the significance of the new world average moved from 6 to 7.
The updated upper limits and the absolute branching fractions of the currently unobserved modes and have been reported. The rate has the same uncertainty of the current measurements [3] while the upper limit (already the world’s best [13]) was improved by a factor 1.3, approaching the expectations from recent calculations [5, 21].
We also report the first observation of two new baryon charmless modes and . We measured , in agreement with the expectations from [22].
References
- [1] M. Gronau and J. L. Rosner, Phys. Lett. B482 (2000) 71.
- [2] H. J. Lipkin, Phys. Lett. B621 (2005) 126.
- [3] E. Barberio et al. Heavy Flavor Averaging Group (HFAG), arXiv:hep-ex/0603003.
- [4] M. Beneke and M. Neubert, Nucl. Phys. B 675 (2003) 333.
- [5] Y. D. H. Yang et al., arXiv:hep-ph/0507326.
- [6] A. J. Buras et al., Nucl. Phys. B697 (2004) 133.
- [7] D. Acosta et al. (CDF Collaboration), Phys. Rev. D71 (2005) 032001 .
- [8] G. Punzi, eConf C030908, MODT002 (2003); arXiv:physics/0308063.
- [9] For a discussion of the bias in multi-component fits related to the use of multiple variables see G. Punzi, eConf C030908, WELT002 (2003); arXiv:physics/0401045.
- [10] if , if .
- [11] E. Baracchini and G. Isidori, Phys. Lett. B633 (2006) 309.
- [12] D. Acosta et al. (CDF Collaboration), Phys. Rev. Lett. 96 (2006) 202001.
- [13] A. Abulencia et al. (CDF Collaboration), Phys. Rev. Lett. 97 (2006) 211802.
- [14] M. Beneke et al., Phys. Lett. B459 (1999) 631.
- [15] A. Lenz, arXiv:hep-ph/0412007.
- [16] We use frequentist limits based on Gaussian distribution of fit pulls (with systematics added in quadrature), and LR-ordering; see G. J. Feldman and R. D. Cousins, Phys. Rev. D57 (1998) 3873.
- [17] A.R. Williamson, J. Zupan, Phys. Rev. D 74 (2006) 014003.
- [18] Xian-Qiao Yu et al., Phys. Rev. D71 (2005) 074026.
- [19] S. Descotes-Genon et al., Phys. Rev. Lett. 97 (2006) 061801.
- [20] S. Baek et al., arXiv:hep-ph/0610109.
- [21] Y. Li et al., Phys. Rev. D70 (2004) 034009.
- [22] R.Mohanta et al. Phys. Rev. D63 (2001) 074001.