M. Ablikim1, J. Z. Bai1, Y. Ban12,
X. Cai1, H. F. Chen17,
H. S. Chen1, H. X. Chen1, J. C. Chen1,
Jin Chen1, Y. B. Chen1,
Y. P. Chu1, Y. S. Dai19,
L. Y. Diao9,
Z. Y. Deng1, Q. F. Dong15,
S. X. Du1, J. Fang1,
S. S. Fang1a, C. D. Fu15, C. S. Gao1,
Y. N. Gao15, S. D. Gu1, Y. T. Gu4,
Y. N. Guo1, Z. J. Guo16b,
F. A. Harris16, K. L. He1, M. He13,
Y. K. Heng1, J. Hou11,
H. M. Hu1, J. H. Hu3 T. Hu1,
G. S. Huang1c, X. T. Huang13,
X. B. Ji1, X. S. Jiang1,
X. Y. Jiang5, J. B. Jiao13,
D. P. Jin1, S. Jin1,
Y. F. Lai1, G. Li1d, H. B. Li1,
J. Li1, R. Y. Li1,
S. M. Li1, W. D. Li1, W. G. Li1,
X. L. Li1, X. N. Li1,
X. Q. Li11,
Y. F. Liang14, H. B. Liao1,
B. J. Liu1,
C. X. Liu1,
F. Liu6, Fang Liu1, H. H. Liu1,
H. M. Liu1, J. Liu12e, J. B. Liu1,
J. P. Liu18, Jian Liu1 Q. Liu1,
R. G. Liu1, Z. A. Liu1,
Y. C. Lou5,
F. Lu1, G. R. Lu5,
J. G. Lu1, C. L. Luo10, F. C. Ma9,
H. L. Ma2, L. L. Ma1f, Q. M. Ma1,
Z. P. Mao1, X. H. Mo1,
J. Nie1, S. L. Olsen16,
R. G. Ping1,
N. D. Qi1, H. Qin1, J. F. Qiu1,
Z. Y. Ren1, G. Rong1, X. D. Ruan4
L. Y. Shan1,
L. Shang1, C. P. Shen1,
D. L. Shen1, X. Y. Shen1,
H. Y. Sheng1,
H. S. Sun1, S. S. Sun1,
Y. Z. Sun1, Z. J. Sun1,
X. Tang1, G. L. Tong1,
G. S. Varner16, D. Y. Wang1g, L. Wang1,
L. L. Wang1,
L. S. Wang1, M. Wang1, P. Wang1,
P. L. Wang1, Y. F. Wang1,
Z. Wang1, Z. Y. Wang1,
Zheng Wang1, C. L. Wei1, D. H. Wei1,
Y. Weng1,
N. Wu1, X. M. Xia1, X. X. Xie1,
G. F. Xu1, X. P. Xu6, Y. Xu11,
M. L. Yan17, H. X. Yang1,
Y. X. Yang3, M. H. Ye2,
Y. X. Ye17, G. W. Yu1,
C. Z. Yuan1, Y. Yuan1,
S. L. Zang1, Y. Zeng7,
B. X. Zhang1, B. Y. Zhang1, C. C. Zhang1,
D. H. Zhang1, H. Q. Zhang1,
H. Y. Zhang1, J. W. Zhang1,
J. Y. Zhang1, S. H. Zhang1,
X. Y. Zhang13, Yiyun Zhang14, Z. X. Zhang12,
Z. P. Zhang17,
D. X. Zhao1, J. W. Zhao1,
M. G. Zhao1, P. P. Zhao1, W. R. Zhao1,
Z. G. Zhao1h, H. Q. Zheng12, J. P. Zheng1,
Z. P. Zheng1, L. Zhou1,
K. J. Zhu1, Q. M. Zhu1, Y. C. Zhu1,
Y. S. Zhu1, Z. A. Zhu1,
B. A. Zhuang1, X. A. Zhuang1, B. S. Zou1
(BES Collaboration)
1 Institute of High Energy Physics, Beijing 100049, People’s Republic of China
2 China Center for Advanced Science and Technology(CCAST), Beijing 100080, People’s Republic of China
3 Guangxi Normal University, Guilin 541004, People’s Republic of China
4 Guangxi University, Nanning 530004, People’s Republic of China
5 Henan Normal University, Xinxiang 453002, People’s Republic of China
6 Huazhong Normal University, Wuhan 430079, People’s Republic of China
7 Hunan University, Changsha 410082, People’s Republic of China
8 Jinan University, Jinan 250022, People’s Republic of China
9 Liaoning University, Shenyang 110036, People’s Republic of China
10 Nanjing Normal University, Nanjing 210097, People’s Republic of China
11 Nankai University, Tianjin 300071, People’s Republic of China
12 Peking University, Beijing 100871, People’s Republic of China
13 Shandong University, Jinan 250100, People’s Republic of China
14 Sichuan University, Chengdu 610064, People’s Republic of China
15 Tsinghua University, Beijing 100084, People’s Republic of China
16 University of Hawaii, Honolulu, HI 96822, USA
17 University of Science and Technology of China, Hefei 230026, People’s Republic of China
18 Wuhan University, Wuhan 430072, People’s Republic of China
19 Zhejiang University, Hangzhou 310028, People’s Republic of China
a Current address: DESY, D-22607, Hamburg, Germany
b Current address: Johns Hopkins University, Baltimore, MD 21218, USA
c Current address: University of Oklahoma, Norman, Oklahoma 73019, USA
d Current address: Universite Paris XI, LAL-Bat. 208– -BP34, 91898-
ORSAY Cedex, France
e Current address: Max-Plank-Institut fuer Physik, Foehringer Ring 6,
80805 Munich, Germany
f Current address: University of Toronto, Toronto M5S 1A7, Canada
g Current address: CERN, CH-1211 Geneva 23, Switzerland
h Current address: University of Michigan, Ann Arbor, MI 48109, USA
Abstract
Using 14 million events accumulated at the BESII
detector, we report first measurements of branching fractions or
upper limits for decays into , , , , , , ,
, , and with the invariant
mass of hadrons below 2.9. We also report branching fractions
of decays into , , , , and .
pacs:
13.20.Gd, 12.38.Qk, 14.40.Gx
Besides the conventional meson and baryon states, QCD also
predicts a rich spectrum of glueballs, meson hybrids, and
multi-quark states in the 1.0 to 2.5 mass region.
Therefore, searches for the evidence of these exotic states play
an important role to test QCD. Such studies have been performed in
radiative decays for a long time Jdecay ; QWG , while
studies in radiative decays have been limited due to low
statistics in previous experiments PDG ; QWG . The radiative
decays of to light hadrons are expected to
contribute about 1% to the total decay
width PRD-wangp . However, the measured channels only sum up
to about 0.05% PDG .
In this Letter, we present first measurements of decays
into , , , , , , , ,
, and , with the invariant mass of
the hadrons () less than 2.9 for each decay mode.
Measurements of decays into and
are also presented and are used for
estimating backgrounds contributing to decays into and , respectively.
The data samples used in this analysis consist of
events
( pb-1) and 6.42 pb-1 of continuum data
at GeV, acquired with the BESII detector. BESII is a
conventional solenoid magnetic detector BES-II , which
consists of a vertex chamber (VC), a main drift chamber (MDC), a
time-of-flight (TOF) system, a barrel shower counter (BSC), and a
muon counter. MDC also measures the energy loss () for
particle identification. A GEANT3 based Monte Carlo (MC)
program SIMBES is used for the simulation.
A common set of requirements is used to select charged tracks and
photon candidates for all channels. Each charged track is required to
be well fitted to a helix in the MDC, to be within the polar angle
region , and to have a transverse momentum larger
than 70 MeV/. The total charge of the good charged tracks in each
event is required to be zero. Each photon candidate is required to
have an energy deposit in the BSC greater than 50 MeV, to be isolated
from charged tracks by more than , and to have the angle
between the cluster development direction in the BSC and the photon
emission direction less than .
For each decay mode, the number of charged tracks is required to
be equal to the number of charged stable hadrons in the
corresponding final state. The TOF and measurements of the
charged track are used to calculate values
and the corresponding confidence levels (C.L.) for the hypotheses
that the particle is a pion, kaon, or proton. All charged tracks
in the selection of , , and
are required to be consistent with the proton, pion, or
kaon assumption with the corresponding C.L. greater than 1%. For
, , and , only two
charged tracks are required to be identified as kaons or protons,
respectively.
Next, the selected charged tracks and the photon with the largest
energy are fitted kinematically using energy and momentum
conservation constraints (4C), and the combined probability,
is required to be greater than 1%, where
is the number of degrees of freedom and is the
sum of the of the kinematic fit () and
particle identification (), i.e.
, where runs over all charged tracks. For and , if there are more than two photons
in an event, the photon-pair with the minimum is chosen.
To remove background from charged particle misidentification, the
for the signal hypothesis is required to be less than
those for background.
To select events, the candidate must have
a decay length in the transverse plane greater than 0.5 cm. In
selecting , contaminations from is removed by requiring the invariant mass of the two pions to
be outside of the mass region, ,
GeV/.
To reject transitions into other charmonium states,
is required to be less than 2.9 GeV/ for each decay mode. If
there is possible background from , it is
removed by requiring
GeV/, where
is the mass recoiling from each
possible pair.
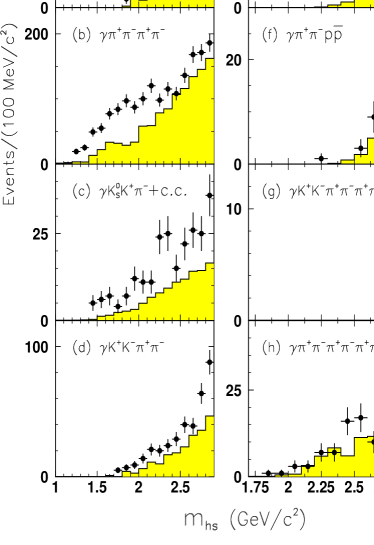
Figure 1: Invariant mass distributions of the hadrons
in each final state (dots with error bars). The shaded histograms
are backgrounds.
Figure 1 shows invariant mass distributions of the
hadrons for , , ,
, , , , and
below 2.9 GeV/, where backgrounds are shown as shaded
histograms. The backgrounds of each decay mode fall into three
classes: QED processes, estimated using the continuum data;
multi-photon backgrounds, e.g. ,
, etc., where the have the same charged tracks as the signal final state, estimated with the MC
simulation and normalized according to their branching
fractions PDG ; pppi0 ; 2k3pi ; and other backgrounds, estimated
using the inclusive decay MC sample lund . The results show that the multi-photon backgrounds are dominant;
the QED background, and the other backgrounds,
including contamination between studied channels are lower. The observed distributions include both
signal events and these backgrounds (see Fig. 2).
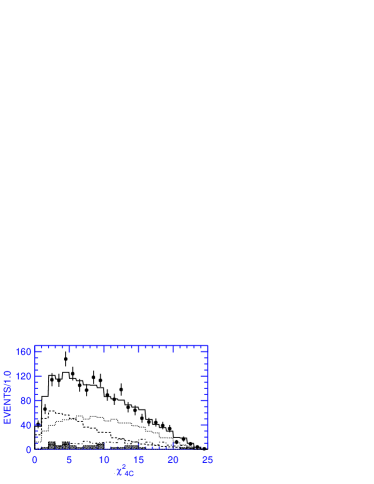
Figure 2: The fitted distribution for
candidate events. The dots with error bars
are data. The solid line is the fitted result with the four
components: signal events (dashed line), MC simulated multi-photon
backgrounds (dotted line), QED processes (hatched histogram), and the
other backgrounds (dot-dashed line).
The number of signal events is extracted by fitting the
observed distributions with those of the signal and
background channels fitchis , i.e.
,
where and are the weights of the signal and the
background decays, respectively. As an example,
Fig. 2 shows the distribution observed for
, together with the fitted
distributions for the signal, multi-photon, QED, and other
background channels. In the fit, the weights
of the multi-photon backgrounds and the QED backgrounds ()
are fixed to be the normalization factors, but the
weight of the signal () and the weight of the other backgrounds ()
are free. With
this method, the numbers of signal events are extracted for each
decay mode with GeV/ and are listed in
Table 1.
In Fig. 1(a) there is an excess of events between
threshold and 2.5 GeV/, but no significant narrow
structure due to the observed in jpsi-gpp . A fit of the mass spectrum with an
acceptance-weighted -wave Breit-Wigner for the resonance
(with mass and width fixed to 1859 and 30,
respectively), together with MC simulated background channels
along with phase space
background massres yields events with a
statistical significance of 2.0. The upper limit on the
branching fraction is determined to be at the 90% C.L.
There is a clear signal in the
invariant mass spectrum for
candidates. The and branching fractions are measured. The
branching fraction includes the
contribution from the , and the
detection efficiency includes the
effect of this contribution. Table 1 summarizes the
branching fractions or upper limits for the radiative decays
analyzed. We also report the differential branching fractions of
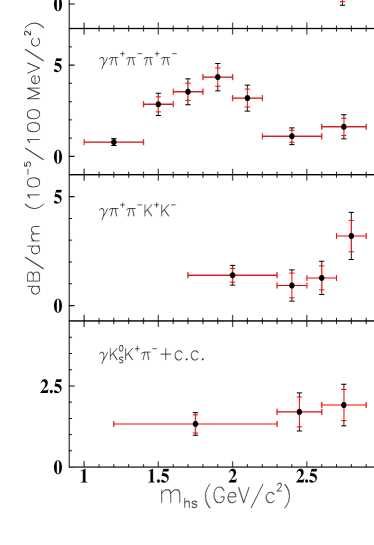
decays into , , , and , as shown in Fig. 3.
Table 1: Results for . For
each final state, the following quantities are given: the number of
events for in data, ; the number of
background events from decays and QED processes, ;
the number of signal events, ; and the weighted averaged
efficiency, ; the branching fraction with statistical and
systematic errors or the upper limit on the branching fraction at
the 90% C.L. Possible interference effects for the
modes with intermediate states are ignored.
Mode
(%)
35.3
2.90.40.4
10.4
39.62.85.0
4.83
25.63.63.6
4.94
19.12.74.3
6.86
37.06.17.2
2.75
24.04.55.0
4.47
2.81.20.7
2.93
1.97
0.69
Figure 3: Differential branching fractions for
decays into , , ,
and Here is the invariant mass of the hadrons
in each final state. For each point, the smaller vertical error is
the statistical error, while the bigger one is the sum of statistical
and systematic errors.
Figure 4: Invariant mass
distributions with fits for , where
dots with error bars are data; the solid histograms and curves
denote the fit results. (a) ; (b)
with ; (c) with
; and (d)
with events removed for the candidate events. Resonance parameters are fixed to
their world averaged values PDG .
For decays into and , the event
selections are similar to those for and
, respectively, but two photons are required. The
numbers of signal events are obtained by fitting the photon pair
invariant mass distributions, and the results are listed in
Table 2. For candidate events,
intermediate resonances including , ,
, and are observed in the invariant mass
distributions of two pions, three pions, and , as shown
in Fig. 4. The results for these resonances are given in
Table 2, together with the world averaged
values PDG , and .
Our measurement of
agrees with the previous measurement using the same data
sample; thus it cross checks the previous result VT .
Table 3 lists the sources of the systematic errors on
the branching fractions. The systematic error caused by MDC
tracking and the kinematic fit is estimated by using simulations
with different MDC wire resolutions SIMBES . The systematic
errors on photon and charged particle identification are taken as
2% per photon SIMBES and 2% per charged
particle SIMBES , respectively. The difference of the fit to
the distribution between MC simulation and data for
, is about 3%, which
is taken as the systematic error of the fit method. The
uncertainty of the total number of events is
4% npsp_moxh , the uncertainty of the background estimation
varies from 1-25% depending on the channel and background level,
and the uncertainties of the branching fractions used are taken
from Ref. PDG . Adding up all these sources in quadrature,
the total systematic errors range from 7 to 28% depending on the
channel.
In Fig. 3, broad peaks appear in the and
distributions at masses 1.9-2.5 GeV/ and
1.4-2.2 GeV/, respectively, which are similar to those
observed in decays into the same final
states jpsi-gpp ; g4pi . The possible structure within these
broad peaks cannot be resolved with our samples. No obvious structure
is observed in the other final states with the current
statistics. The branching fractions below
in this Letter sum up to
0.26% note1 of the total decay width, which is
about a quarter of the total expected radiative decays.
This indicates that a larger data sample is needed to search for
more decay modes and to resolve the substructure of the
radiative decays.
In summary, we report first measurements of the branching fractions
of decays into , , , , ,
, , ,
, and , and the differential branching
fractions for decays into , ,
, and with less than
. The branching fractions for decays into
are measured for the first time. The measurements of
decays into , , and
are consistent with the recent measurements by the CLEO
collaboration CLEO-95 and previous measurements PDG .
Table 2: Results of . Here
is the number of signal events, is the
detection efficiency, is the measured branching fraction,
is the world averaged value, and is
defined in the text.
Mode:
(%)
(%)
—
—
Table 3: Summary of the systematic errors.
Source
Uncertainty
Wire resolution
5-14%
Photon detection
2%/photon
Particle identification
2%/track
Signal fit
3%
Background estimation
1-25%
Number of
4%
Intermediate states
1-3%
Total
7-28%
The BES collaboration thanks the staff of BEPC and computing center
for their hard efforts. This work is supported in part by the
National Natural Science Foundation of China under contracts Nos.
10491300, 10225524, 10225525, 10425523, 10625524, 10521003,
10225522, the Chinese Academy of Sciences under contract No. KJ
95T-03, the 100 Talents Program of CAS under Contract Nos. U-11,
U-24, U-25, the Knowledge Innovation Project of CAS under Contract
Nos. U-602, U-34, and the Department of Energy under Contract No.
DE-FG02-04ER41291 (U. Hawaii).
References
(1) L. Kpke and N. Wermes,
Phys. Rep. 174, 67 (1989).
(2) N. Brambilla et al., CERN-2005-005, hep-ph/0412158.
(3)Particle Data Group, W.-M. Yao et al.,
J. Phys. G 33, 1 (2006).
(4) P. Wang, C. Z. Yuan, and X. H. Mo,
Phys. Rev. D 70, 114014 (2004).
(5)BES Collaboration,
J. Z. Bai et al., Nucl. Instr. Meth. A 458, 627 (2001).
(6)BES Collaboration, M. Ablikim et al.,
Nucl. Instrum. Meth. A 552, 344 (2005).
(7)BES Collaboration, M. Ablikim et al.,
Phys. Rev. D 71, 072006 (2005).
(8)BES Collaboration, M. Ablikim et al.,
Phys. Rev. D 73, 052004 (2006).
(9)J. C. Chen et al., Phys. Rev. D 62, 034003 (2000).
(10) R. G. Ping et al.,
High Energy Phys. Nucl. Phys. 31, 229 (2007)
[arXiv:physics/0608213].
(11)BES Collaboration, M. Ablikim et al.,
Phys. Rev. Lett. 91, 022001 (2003).
(12) The mass resolution in
the fitted region is less than 3 and neglected
in the fit.
(13) J. Z. Bai et al. (BES Collaboration),
Phys. Rev. D 69, 072001 (2004).
(14)
X. H. Mo et al.,
High Energy Phys. Nucl. Phys. 28, 455 (2004)
[arXiv:hep-ex/0407055].
(15)D. Bisello et al.,
Phys. Rev. D 39, 701 (1989); R. M. Baltrusaitis et al.,
Phys. Rev. D 33, 1222 (1986).
(16) This value includes the decays of
, ; the
intermediate resonance channels, e.g. are excluded.
(17)CLEO Collaboration, R. A. Briere et al.,
Phys. Rev. Lett. 95, 062001 (2005).