A. Sokolov
Institute of High Energy Physics, Protvino
M. Shapkin
Institute of High Energy Physics, Protvino
K. Abe
High Energy Accelerator Research Organization (KEK), Tsukuba
K. Abe
Tohoku Gakuin University, Tagajo
I. Adachi
High Energy Accelerator Research Organization (KEK), Tsukuba
H. Aihara
Department of Physics, University of Tokyo, Tokyo
D. Anipko
Budker Institute of Nuclear Physics, Novosibirsk
T. Aushev
Swiss Federal Institute of Technology of Lausanne, EPFL, Lausanne
Institute for Theoretical and Experimental Physics, Moscow
A. M. Bakich
University of Sydney, Sydney NSW
E. Barberio
University of Melbourne, Victoria
M. Barbero
University of Hawaii, Honolulu, Hawaii 96822
I. Bedny
Budker Institute of Nuclear Physics, Novosibirsk
K. Belous
Institute of High Energy Physics, Protvino
U. Bitenc
J. Stefan Institute, Ljubljana
I. Bizjak
J. Stefan Institute, Ljubljana
A. Bondar
Budker Institute of Nuclear Physics, Novosibirsk
M. Bračko
High Energy Accelerator Research Organization (KEK), Tsukuba
University of Maribor, Maribor
J. Stefan Institute, Ljubljana
T. E. Browder
University of Hawaii, Honolulu, Hawaii 96822
A. Chen
National Central University, Chung-li
W. T. Chen
National Central University, Chung-li
B. G. Cheon
Chonnam National University, Kwangju
R. Chistov
Institute for Theoretical and Experimental Physics, Moscow
Y. Choi
Sungkyunkwan University, Suwon
Y. K. Choi
Sungkyunkwan University, Suwon
S. Cole
University of Sydney, Sydney NSW
J. Dalseno
University of Melbourne, Victoria
M. Dash
Virginia Polytechnic Institute and State University, Blacksburg, Virginia 24061
A. Drutskoy
University of Cincinnati, Cincinnati, Ohio 45221
S. Eidelman
Budker Institute of Nuclear Physics, Novosibirsk
D. Epifanov
Budker Institute of Nuclear Physics, Novosibirsk
S. Fratina
J. Stefan Institute, Ljubljana
T. Gershon
High Energy Accelerator Research Organization (KEK), Tsukuba
A. Go
National Central University, Chung-li
G. Gokhroo
Tata Institute of Fundamental Research, Bombay
B. Golob
University of Ljubljana, Ljubljana
J. Stefan Institute, Ljubljana
H. Ha
Korea University, Seoul
J. Haba
High Energy Accelerator Research Organization (KEK), Tsukuba
T. Hara
Osaka University, Osaka
Y. Hasegawa
Shinshu University, Nagano
K. Hayasaka
Nagoya University, Nagoya
H. Hayashii
Nara Women’s University, Nara
M. Hazumi
High Energy Accelerator Research Organization (KEK), Tsukuba
D. Heffernan
Osaka University, Osaka
Y. Hoshi
Tohoku Gakuin University, Tagajo
S. Hou
National Central University, Chung-li
W.-S. Hou
Department of Physics, National Taiwan University, Taipei
Y. B. Hsiung
Department of Physics, National Taiwan University, Taipei
T. Iijima
Nagoya University, Nagoya
K. Inami
Nagoya University, Nagoya
A. Ishikawa
Department of Physics, University of Tokyo, Tokyo
R. Itoh
High Energy Accelerator Research Organization (KEK), Tsukuba
M. Iwasaki
Department of Physics, University of Tokyo, Tokyo
Y. Iwasaki
High Energy Accelerator Research Organization (KEK), Tsukuba
J. H. Kang
Yonsei University, Seoul
P. Kapusta
H. Niewodniczanski Institute of Nuclear Physics, Krakow
N. Katayama
High Energy Accelerator Research Organization (KEK), Tsukuba
H. Kawai
Chiba University, Chiba
T. Kawasaki
Niigata University, Niigata
H. R. Khan
Tokyo Institute of Technology, Tokyo
H. Kichimi
High Energy Accelerator Research Organization (KEK), Tsukuba
H. J. Kim
Kyungpook National University, Taegu
Y. J. Kim
The Graduate University for Advanced Studies, Hayama, Japan
S. Korpar
University of Maribor, Maribor
J. Stefan Institute, Ljubljana
P. Križan
University of Ljubljana, Ljubljana
J. Stefan Institute, Ljubljana
P. Krokovny
High Energy Accelerator Research Organization (KEK), Tsukuba
R. Kulasiri
University of Cincinnati, Cincinnati, Ohio 45221
R. Kumar
Panjab University, Chandigarh
A. Kuzmin
Budker Institute of Nuclear Physics, Novosibirsk
Y.-J. Kwon
Yonsei University, Seoul
T. Lesiak
H. Niewodniczanski Institute of Nuclear Physics, Krakow
A. Limosani
High Energy Accelerator Research Organization (KEK), Tsukuba
S.-W. Lin
Department of Physics, National Taiwan University, Taipei
D. Liventsev
Institute for Theoretical and Experimental Physics, Moscow
F. Mandl
Institute of High Energy Physics, Vienna
T. Matsumoto
Tokyo Metropolitan University, Tokyo
S. McOnie
University of Sydney, Sydney NSW
W. Mitaroff
Institute of High Energy Physics, Vienna
H. Miyake
Osaka University, Osaka
H. Miyata
Niigata University, Niigata
Y. Miyazaki
Nagoya University, Nagoya
T. Nagamine
Tohoku University, Sendai
Y. Nagasaka
Hiroshima Institute of Technology, Hiroshima
I. Nakamura
High Energy Accelerator Research Organization (KEK), Tsukuba
E. Nakano
Osaka City University, Osaka
M. Nakao
High Energy Accelerator Research Organization (KEK), Tsukuba
Z. Natkaniec
H. Niewodniczanski Institute of Nuclear Physics, Krakow
S. Nishida
High Energy Accelerator Research Organization (KEK), Tsukuba
O. Nitoh
Tokyo University of Agriculture and Technology, Tokyo
T. Nozaki
High Energy Accelerator Research Organization (KEK), Tsukuba
S. Ogawa
Toho University, Funabashi
T. Ohshima
Nagoya University, Nagoya
S. Okuno
Kanagawa University, Yokohama
Y. Onuki
Niigata University, Niigata
H. Ozaki
High Energy Accelerator Research Organization (KEK), Tsukuba
H. Palka
H. Niewodniczanski Institute of Nuclear Physics, Krakow
C. W. Park
Sungkyunkwan University, Suwon
H. Park
Kyungpook National University, Taegu
L. S. Peak
University of Sydney, Sydney NSW
R. Pestotnik
J. Stefan Institute, Ljubljana
L. E. Piilonen
Virginia Polytechnic Institute and State University, Blacksburg, Virginia 24061
Y. Sakai
High Energy Accelerator Research Organization (KEK), Tsukuba
T. Schietinger
Swiss Federal Institute of Technology of Lausanne, EPFL, Lausanne
O. Schneider
Swiss Federal Institute of Technology of Lausanne, EPFL, Lausanne
C. Schwanda
Institute of High Energy Physics, Vienna
A. J. Schwartz
University of Cincinnati, Cincinnati, Ohio 45221
R. Seidl
University of Illinois at Urbana-Champaign, Urbana, Illinois 61801
RIKEN BNL Research Center, Upton, New York 11973
M. E. Sevior
University of Melbourne, Victoria
H. Shibuya
Toho University, Funabashi
B. Shwartz
Budker Institute of Nuclear Physics, Novosibirsk
A. Somov
University of Cincinnati, Cincinnati, Ohio 45221
N. Soni
Panjab University, Chandigarh
S. Stanič
University of Nova Gorica, Nova Gorica
H. Stoeck
University of Sydney, Sydney NSW
T. Sumiyoshi
Tokyo Metropolitan University, Tokyo
S. Suzuki
Saga University, Saga
F. Takasaki
High Energy Accelerator Research Organization (KEK), Tsukuba
K. Tamai
High Energy Accelerator Research Organization (KEK), Tsukuba
N. Tamura
Niigata University, Niigata
M. Tanaka
High Energy Accelerator Research Organization (KEK), Tsukuba
G. N. Taylor
University of Melbourne, Victoria
Y. Teramoto
Osaka City University, Osaka
X. C. Tian
Peking University, Beijing
T. Tsukamoto
High Energy Accelerator Research Organization (KEK), Tsukuba
S. Uehara
High Energy Accelerator Research Organization (KEK), Tsukuba
T. Uglov
Institute for Theoretical and Experimental Physics, Moscow
S. Uno
High Energy Accelerator Research Organization (KEK), Tsukuba
P. Urquijo
University of Melbourne, Victoria
Y. Usov
Budker Institute of Nuclear Physics, Novosibirsk
G. Varner
University of Hawaii, Honolulu, Hawaii 96822
S. Villa
Swiss Federal Institute of Technology of Lausanne, EPFL, Lausanne
C. C. Wang
Department of Physics, National Taiwan University, Taipei
Y. Watanabe
Tokyo Institute of Technology, Tokyo
J. Wiechczynski
H. Niewodniczanski Institute of Nuclear Physics, Krakow
E. Won
Korea University, Seoul
C.-H. Wu
Department of Physics, National Taiwan University, Taipei
B. D. Yabsley
University of Sydney, Sydney NSW
A. Yamaguchi
Tohoku University, Sendai
Y. Yamashita
Nippon Dental University, Niigata
M. Yamauchi
High Energy Accelerator Research Organization (KEK), Tsukuba
L. M. Zhang
University of Science and Technology of China, Hefei
Z. P. Zhang
University of Science and Technology of China, Hefei
V. Zhilich
Budker Institute of Nuclear Physics, Novosibirsk
A. Zupanc
J. Stefan Institute, Ljubljana
Abstract
We study transitions between states with the emission of
charged pions using 477 fb-1 of data collected
with the Belle detector at the KEKB asymmetric-energy collider.
We select inclusive
events (where represents anything) and observe
a peak in the distribution of the mass difference = ().
This peak, at MeV/, is identified
as a signal for the decay with a subsequent transition .
The measured product branching fraction
.
When the PDG value for is used,
this corresponds to and a partial decay width
keV.
pacs:
13.25.Gv, 14.60.Ef, 14.40.Aq
The bottomonium state has a mass above the
threshold for pair
production and decays mainly into -meson pairs
( PDG ).
However, the decay modes
with
should exist.
The first preliminary evidence for these
decays was presented in Ref. prel , and recently the BaBar Collaboration
has published an observation of these modes BaBar . A similar
decay mode of the charmonium state has recently been
observed charm .
In this paper we report the observation of the decay mode
from the Belle experiment.
The results reported here supersede those
of Ref. prel .
We use 477 fb-1 of data collected on the resonance
and in the nearby continuum to study
decays with
a subsequent transition.
Charged particles are reconstructed and identified
in the Belle detector Belle , which
consists of a central drift chamber (CDC),
aerogel threshold Cherenkov counters (ACC),
time-of-flight (TOF) scintillation counters,
an electromagnetic calorimeter (ECL),
and a -muon detector (KLM).
We require that charged tracks be well-measured
and consistent with originating from the interaction point.
Charged particles are assigned
a likelihood MUID ( = , , )
based on the matching of hits in
the KLM to the track extrapolated from the CDC, and identified as
muons if the likelihood ratio ,
corresponding to a muon detection efficiency of approximately 91.5%
over the polar angle range
and the momentum range
in the laboratory frame. Electron identification uses a similar likelihood
ratio EID based on CDC, ACC, and ECL information.
Charged particles that are not identified as muons
and have a likelihood ratio 0.05 are treated as pions.
Identification of ’s is based on information
from the ECL.
Calorimeter clusters not associated with reconstructed charged tracks
and with energies greater than 50 MeV
are considered as candidates.
Candidates for
decays with the subsequent
leptonic decay
are selected from the standard Belle hadronic event sample.
The most important selection criteria for this event sample
are the following:
multiplicity of charged tracks in an event ;
the event’s visible energy
, where
is the center-of-mass (c.m.) energy;
the sum of good cluster energies in the ECL
must satisfy ;
the sum of the components of each charged track’s and photon’s momenta
is required to satisfy .
The variables , ,
are evaluated in the c.m. system.
To select decays,
hadronic events are required to contain a
pair with and also to satisfy
, where is the event’s
visible energy calculated in the laboratory frame. The latter
requirement reduces background from poorly reconstructed events.
After these requirements, events remain.
We then require the presence of a pair.
To reduce background from production in radiative
return processes rad with the subsequent conversion of the emitted
photon into an pair
that is misidentified as , we impose an
additional requirement on the angle between the pion momenta
in the laboratory system: .
The number of selected events is 1084.
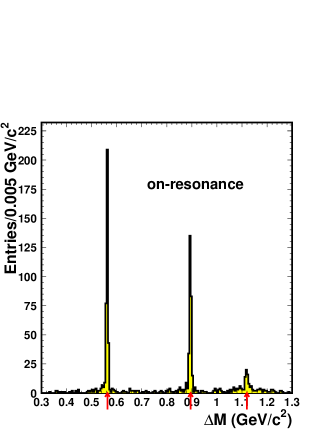
To observe resonance states that decay into the
final state,
the distribution of the mass difference
with in the range
is examined (see Fig. 1) for the on-resonance sample.
Here is the nominal mass.
Figure 1: The mass difference distribution where lies in the
mass region.
Arrows show the positions
of the mass differences (),
(), and
(), respectively, based on PDG values.
Three peaks are seen in the distribution.
The first, second, and third peaks are at
560, 890, and 1120 MeV/, respectively.
The first and second peaks have very little background.
Fits to the first two peaks using Gaussians for the signal shapes
result in peak positions of
and
MeV/.
These values are compatible with the () and
() PDG PDG values, respectively.
We conclude that the first and second peaks are due to the decays
and
, where
the are produced mainly in the radiative return processes
.
In contrast to the first two peaks, the third peak has modest
background.
The position of the peak is derived from a fit to the
distribution in the third peak region
(see Fig. 2)
using a Gaussian for the signal
and a third order polynomial for the background.
The result is ,
which is in good agreement
with the mass difference
from the PDG.
The Gaussian width is ,
which is consistent with the estimated resolution.
The signal yield in the interval
determined
from the fit is ,
with a statistical significance of 8.0 which corresponds to
with 3 degrees of freedom (mass, width, and yield).
Here and
are the likelihood values returned by the fit with
signal yield fixed at zero and its best fit value,
respectively.
This peak is identified as a signal for the decay
with a subsequent transition.
Figure 2: The fit to the third peak in the distribution
using a Gaussian for the signal
and a third order polynomial for the background (dotted line).
The solid line shows the sum of a Gaussian and a polynomial function.
To verify this interpretation,
we study the resonance properties in more detail.
First, the distribution
for the event sample
in the mass region is considered.
Here we use a looser requirement on
to study the background in a wider region.
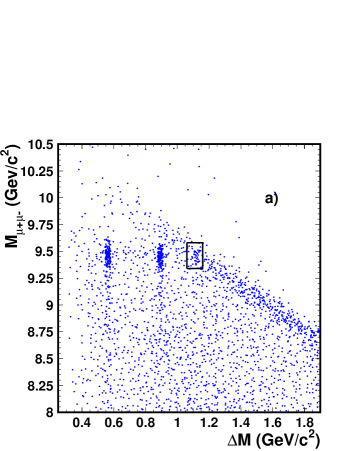
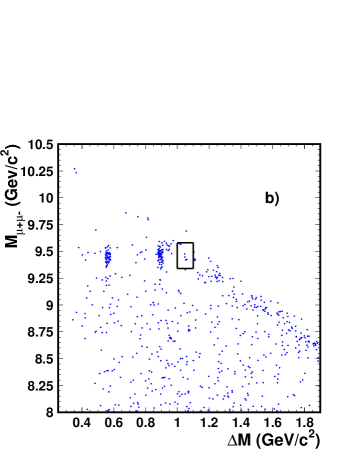
The distribution of vs for the on-resonance (off-resonance,
, integrated luminosity
)
sample is shown in Fig. 3a(b).
Figure 3: The vs scatter plot for the on-resonance
sample (a) and off-resonance sample (b) in the
mass region. The rectangle in (a)
indicates where transitions
would cluster; the background in this region should scale from
that in the rectangle in (b). For clarity, the rectangle in (a)
is drawn larger than the region used to determine the signal
yield (which is determined by optimizing the expected signal
yield relative to the square root of the expected
background).
Comparing the two distributions,
we see that the behaviour for the on-resonance and
off-resonance sample are similar except that in the off-resonance data,
the third peak is absent.
The “slanted band” in this plot is due to
the non-resonant reaction .
Using the off-resonance sample,
the distribution
where is restricted to
has only two peaks, corresponding to
and decays.
For the on-resonance sample when the data size is scaled to the
off-resonance sample, the total number of events and the number of
background events in the interval
is
and , respectively.
If we consider a interval shifted by ,
to take the lower into account, we find
events in the off-resonance sample.
To compare the scaled total
and background
yields as models for the off-resonant yield ,
we use the so-called likelihood like .
We find for , and
for :
the background interpretation of the events in the third peak region
is therefore favoured, although the discrimination is relatively weak
().
This suggests that the events in the third peak region
show no sign of a similar enhancement.
Additional information can be obtained from the study of the
system.
The efficiency-corrected distribution of the invariant mass
of the system () is shown in Fig. 4
for events in the third peak region.
The background (see Fig. 2)
is not subtracted from the distribution.
The efficiency is calculated by a Monte Carlo simulation.
The EvtGen event generator EvtGen with a matrix element Brown
taking into account particle spins is used to produce
events
that are passed through the detector
simulation and reconstruction programs.
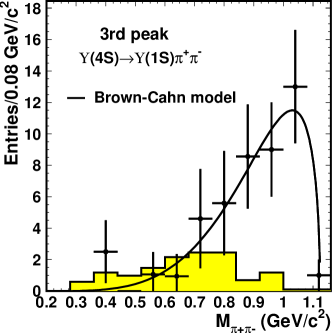
Figure 4: The invariant mass distributions
for events from the third peak region
in the distribution.
The shaded histogram is for background events estimated
from the sideband.
The solid line shows the distribution predicted
by the Brown-Cahn model Brown .
As shown in Fig. 4, the distribution for events
from the third peak region in the distribution shows an enhancement
at high masses. In contrast, the distribution for background
events, which is taken from the sideband
(,
)
and normalized to the background events
underneath the peak, is more uniform and shows no sign of similar
enhancement.
This difference in the behaviour of the distribution
is an additional argument in favour of a resonance interpretation
of the third peak.
The distribution can be described
by the shape predicted
by the Brown-Cahn model Brown (see Fig. 4),
where the hadronic transition between
heavy quarkonia is considered as a two-step process: the emission of gluons
from heavy quarks and subsequent conversion of these gluons
into light hadrons.
The branching fraction for the
decay is determined from
The total number of in the data sample is
, and
the nominal branching fraction
PDG .
The efficiency obtained from the Monte Carlo sample is
.
We apply a correction of about 8% to , one of
the variables used for selecting hadronic events. The efficiency
is sensitive to this variable; the correction is designed so that
the data and MC match in this variable.
The systematic error of the reconstruction efficiency
due to this correction is 8%.
The systematic uncertainty in the reconstruction efficiency
due to lack of knowledge of the
decay matrix element
is estimated by varying the parameterization of the
distribution. Requiring a reasonable fit to the distribution
we find a 3% variation in the efficiency.
Other systematic uncertainties come from the choice of the fit range
and the background shape (4.5%) in the distribution,
choice of the signal range (4%),
choice of the mass range (6%),
and from the tracking efficiency (4%).
The total systematic uncertainty
is obtained by adding these contributions in quadrature;
the result is 13%.
The measured product branching fraction is
The branching fraction is
We also extract the partial decay width for
transition
using the world-average value of the total
width PDG and obtain
The measured values of
and
are about twice larger than BaBar’s results BaBar .
To summarize, a study of transitions between states
with the emission of charged pions has been performed at Belle.
The mass difference distribution
() from the
event sample
for within
the mass region has two peaks from
decays with no
background.
A third peak at is
interpreted as a signal for the decay
with a subsequent transition.
This final state is the first example of a non- decay mode
of the .
The branching fraction
and the partial decay width
are measured.
The distribution
can be described by the shape predicted
by the Brown-Cahn model Brown .
We thank the KEKB group for excellent operation of the
accelerator, the KEK cryogenics group for efficient solenoid
operations, and the KEK computer group and
the NII for valuable computing and Super-SINET network
support. We acknowledge support from MEXT and JSPS (Japan);
ARC and DEST (Australia); NSFC and KIP of CAS (contract No. 10575109
and IHEP-U-503, China); DST (India); the BK21 program of MOEHRD, and the
CHEP SRC and BR (grant No. R01-2005-000-10089-0) programs of
KOSEF (Korea); KBN (contract No. 2P03B 01324, Poland); MIST
(Russia); ARRS (Slovenia); SNSF (Switzerland); NSC and MOE
References
(1)
(2)W.-M. Yao et al., Particle Data Group,
Journ. of Phys. G 33 (2006) 1.
(3)K. Abe et al., Belle Collaboration,
hep-ex/0512034.
(4)B. Aubert et al., BaBar Collaboration,
Phys. Rev. Lett. 96 (2006) 232001.
(5)J.Z. Bai et al., BES Collaboration,
Phys. Lett. B 605 (2005) 63;
N.E.Adam et al., CLEO Collaboration,
Phys. Rev. Lett. 96 (2006) 082004.
(6)A. Abashian et al., Belle Collaboration,
Nucl. Inst. and Meth. A 479 (2002) 117.
(7)A. Abashian et al., Belle Collaboration,
Nucl. Inst. and Meth. A 491 (2002) 69.
(8)K. Hanagaki et al.,
Nucl. Inst. and Meth. A 485 (2002) 490.
(9)M. Benayoun et al.,
Mod. Phys. Lett. A 14 (1999) 2605.
(10)S. Baker and R. Cousins,
Nucl. Inst. and Meth. 221 (1984) 437.
(11)D.J. Lange,
Nucl. Inst. and Meth. A 462 (2001) 152.
(12)L.S. Brown and R.N. Cahn, Phys. Rev. Lett. 35 (1975) 1;
M.B. Voloshin, JETP Lett. 21 (1975) 347;
T.-M. Yan, Phys. Rev. D 22 (1980) 1652.