SLAC-PUB-12182
BABAR-PROC-06/073
August, 2006
Review of Recent Measurements of the Sides of the CKM Unitarity Triangle
Giampiero Mancinelli
Department of Physics,
University of Cincinnati
Mail Location 11, Cincinnati, Ohio 45221-0011, USA
Abstract
We give a review of the status of the global effort to measure the sides of the CKM Unitarity Triangle.
Contributed to the Proceedings of the 7th International Conference on Hyperons, Charm And Beauty Hadrons
2-8 July 2006, University of Lancaster, UK
Stanford Linear Accelerator Center, Stanford University, Stanford, CA 94309
Work supported in part by National Science Foundation Grant Number PHY-0457336 and by Department of Energy Contract Number DE-AC03-76SF00515.
1 INTRODUCTION
The Cabibbo-Kobayashi-Maskawa (CKM) matrix [1]:
| (1) |
transforms, in the Standard Model (SM) theory, weak and mass eigenstates of quarks into each others. Its elements are proportional to the amplitudes of such processes. We present the results of measurements involving , , , and , which are the smaller ones, hence the most difficult to determine. As the matrix is unitary, several unitarity relations can be written, of which the best known at the B-factories is: . This can be expressed in the imaginary plane as a triangle with sides of comparable lengths. The apex of the Unitarity Triangle (UT) is to be constrained, in fact over constrained, to infer hints of new physics. Measurements of angles and sides are complementary, as the former are derived from the determination of violating asymmetries (and the area of the UT is proportional to the amount of violation), while the latter from measuring branching fractions (BF) of various decays, typically leptonic and semileptonic, or mixing parameters. In particular, given the high precision of the current measurement of , it is important to reach equal level of precision in the measurement of the side opposite to . All reported results are preliminary, unless published, in which case appropriate journal references are given.
2
The ratio of the oscillation frequencies of and mesons, and , is proportional to . At the factories only can be measured, but the precision achieved is much better than in the past and the world average ( ps-1) is dominated by the Belle and BABAR collaborations’ measurements.
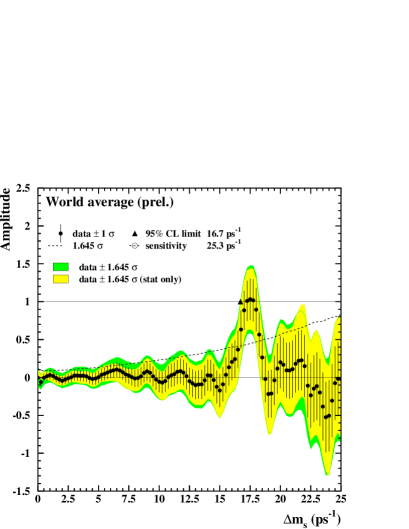
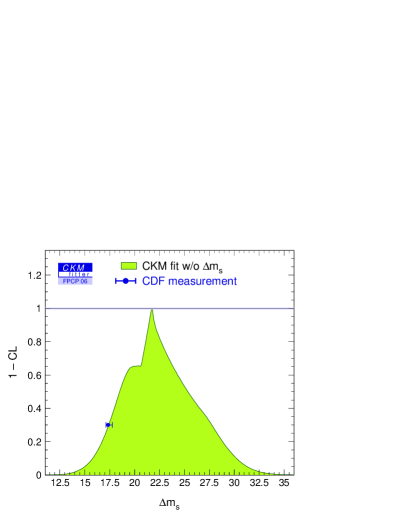
Measurements of mixing are much more difficult as oscillations are about a factor 40 faster than those for mesons. mixing is out of the reach of the factories, but not to the energies of Fermilab. As the mixing is so fast, a clever way to measure was devised many years ago: it involves scanning the amplitude versus proper time at different values. The true would give an amplitude of about 1. Such a value was in fact reached years ago for 17 ps-1, but unfortunately these measurements were only sensitive up to 14 ps-1, thus only allowing a lower limit on . A peak at 1 is clearly visible in the recent CDF and D0 combined measurements (see Fig. 1 [2]) and a value of is achieved [3]. The precision of the measurement of is about 3%, hence the uncertainty on is only 4%, as many QCD corrections cancel in the ratio. Fig. 2 shows the impact of this measurement on the UT fit [4].
A complementary measurement of can be achieved using and processes, for which and decays can be used. The Belle collaboration has detected a signal, hence measured [5], while the BABAR collaboration has set a limit at 90% confidence level (C.L.) [6]. The two results are in agreement with each other and with the results. The fit using all modes gives , about two standard deviations () away from the result.
3 AND
3.1 Introduction
and are typically derived from semileptonic decays. The various techniques used can be categorized as either inclusive (when the hadron is not reconstructed) or exclusive (when the hadron is fully reconstructed). The inclusive methods are more efficient but have poor signal to background ratio. The exclusive ones have lower efficiency due to the full reconstruction of the event, but good signal to noise ratio. Help can come from the reconstruction of the other side (tagging side) of the event. In both cases it is hard to discern from transitions because of the very different rates, as is much larger than . Furthermore, all methods incur theoretical difficulties when attempting to extract parton level quantities from hadron level ones.
3.2 Inclusive measurements
The lepton momentum spectrum is harder for than for decays. At first order, the BF of is proportional to . According to the Operator Product Expansion (OPE), QCD corrections need to be considered. These corrections are both perturbative (known to ) and non-perturbative (although suppressed by ). The dominant uncertainty comes from the mass, known to 1%. Furthermore, as is small, the signal is practically invisible, hence the total rate cannot be measured. Measurements of partial rates can instead be attempted, with the help of ad hoc kinematical selections on such quantities as the lepton energy (), the transferred momentum () and the hadron system mass (). These rates are more dependent on non-perturbative effects and on the knowledge of the Shape Functions (SF).
can be determined from decays as the partial semileptonic rates are related to and can be determined with the help of theory. The lepton energy and hadron mass spectra have been measured, together with their moments. Fig. 3 shows the hadron mass spectra as measured by the Belle collaboration [7].

OPE predicts the partial rates and the moments as a function of , the and quark masses, and other non-perturbative parameters. As each observable has a different dependence on these quantities, a global fit can be attempted [8]. Furthermore can help as the energy spectrum of the photon is directly connected to the SF. The global fit gives . Other results are shown in Table 1; note that the error on is only of the order of 2%. Many measurements are used in the fit, of which the most recent ones are from the BABAR and DELPHI collaborations [9]. and are also useful in the determination of . Measurements from and processes are in good agreement.
| Quantity | Fit Result |
|---|---|
| GeV | |
| GeV | |
| GeV2 | |
| % |
A way to isolate decays is to use the lepton endpoint, i.e. selecting high energy leptons. A very accurate background subtraction is needed. Several measurements exploit this technique [10]. The BABAR analysis is performed in the region between 2.0 and 2.6 GeV (to avoid background on the low side and decays on the high side). can be extracted using the BLNP calculations [11]. The results are shown in Table 2; the theoretical errors include the ones from the SF knowledge (which uses the OPE fit results).
| range () | ||
|---|---|---|
| BABAR | 2.0-2.6 | |
| Belle | 1.9-2.6 | |
| CLEO | 2.2-2.6 |
One of the mesons can also be tagged in its fully reconstructed hadronic decays, while identifying semileptonic decays in the recoil system. Using selection criteria on the kinematic quantities previously described, can be extracted [12].
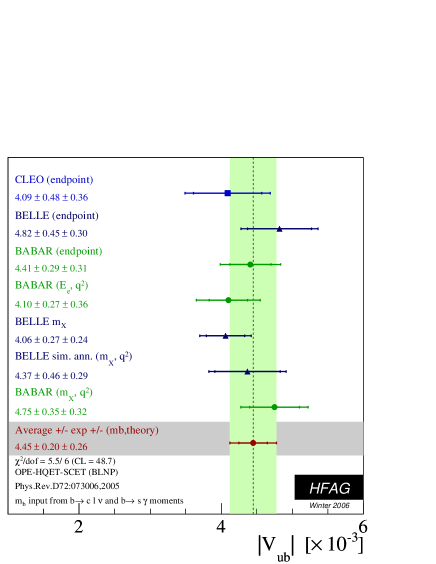
A list of all inclusive measurements [2] is shown in Fig. 4. The average, using BNLP, is [13]. The experimental error is now smaller than the theoretical. SF and weak annihilation uncertainties should diminish with more data as well. A new approach by Andersen and Gardi [14] gives an even smaller theoretical error.
A novel approach realized at BABAR uses a method by Leibovich, Low, and Rothstein [15] to combine and measurements in order for the SF contributions to cancel out, hence reducing the model dependence of this measurement. A technique using weight functions had been previously proposed by Neubert [16]. Hadronically tagged and background subtracted events are used to combine the integrated hadronic mass spectrum below a certain cut with the high energy end of the measured photon energy spectrum. This is equivalent to trading some of the statistical error for non-perturbative theoretical uncertainty. The optimal choice for the cut is at 1.67, for which it is possible to obtain 72% acceptance and , which can be compared with the (worse) OPE result obtained from almost the full spectrum: [17].
3.3 Exclusive measurements
For these measurements the Form Factors (FF) are needed, and though they are theoretically calculable at kinematical limits, empirical extrapolations are still necessary to extract and . For the FF can be calculated using several theoretical models [18]. For the FF can be expressed as a function of , the boost in the rest frame. The expression depends on the theoretical parameters , and and the (experimental variables) angle between the (lepton) in the (virtual ) rest frame and the direction of the (virtual ) in the rest frame, and the dihedral angle between the plane formed by the and the one formed by the systems [19]. The results of the fit of the experimental distributions are: , , , . BABAR’s analysis has improved the knowledge of and by a factor of 5 with respect to previous CLEO measurements [20].
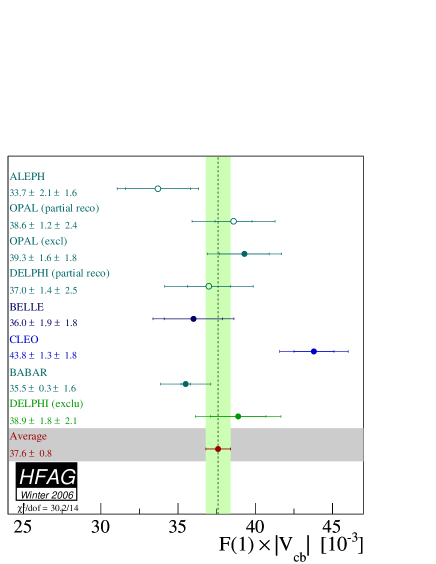
Fig. 5 reports all the exclusive measurements to date. The average value of is in agreement with inclusive results, although the of all exclusive measurements is quite poor (30.2/14).
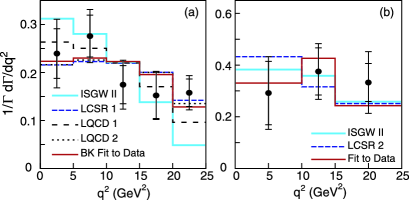
can also be determined via exclusive measurements, though these suffer from low statistics. Reconstructing without tagging the other side is a technique, where the neutrino information is inferred from the event total missing 4-momentum [21]. Two quantities are used to discriminate between signal and background: the beam-energy-substituted mass and the energy difference , where the subscripts and refer to the initial system and the candidate respectively, and the asterisk denotes the center of mass frame. Using these variables, a fit is performed in bins of . By extracting the spectrum and comparing it with theoretical predictions, it is possible to discriminate between some FF models, as shown in Fig. 6 for BABAR data, where, for example, the LQCD/LCSR model is clearly favored over the ISGWII [22].
Another procedure consists in reconstructing a semileptonic decay on the tagging side and identifying a candidate on the signal side [23]. Though the BF is large, the presence of two neutrinos complicates these measurements. By requiring the two B mesons to be back to back, it has been possible to obtain the following BF measurements for [24]: (Belle), (BABAR); and for : (Belle), (BABAR). Techniques using hadronic tags yield lower statistics, but require only one neutrino reconstruction. Furthermore they allow for high phase-space acceptance, hence reduced model dependence. The BABAR collaboration reports [25]. Tagged exclusive measurements are now becoming competitive with untagged ones.
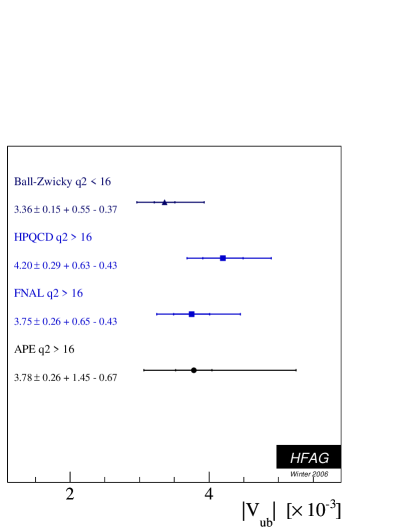
In summary, Fig. 7 reports all the exclusives measurements of , given the input of several FF models and the world average exclusive BF for of . Note that the experimental uncertainties are now competitive with those for inclusive measurements. The precision of the exclusive measurements is limited mostly by the FF uncertainties and the exclusive and inclusive measurements agree within such precision.
3.4 from
is an annihilation process. Its BF is related to as:
| (2) | |||||
where is the Fermi coupling constant, and the and masses, respectively, and is the lifetime. Due to the helicity suppression term, which is much more severe for muons and electrons, there is practically no possibility to perform BF measurements of decays at the B-factories. Fully reconstructing one (hadronic modes for the Belle measurement, hadronic and semileptonic for the BABAR measurement) and selecting candidates for 5 (Belle) or 6 (BABAR) decay modes, the energy left unassigned is mostly from combinatorial background and its distribution peaks at zero for signal. A clear signal with 21 fitted events is observed in Belle’s data [26]. The measured BF is . It has a 4.2 significance and is in agreement with the SM expectation [27]. Using the HFAG [2] average for , a first measurement of the decay constant can be extracted, which is in agreement with HPQCD calculations [28]. BABAR observes no signal and instead assesses an upper limit for the BF ( at 90% C.L.) [29]. The ratio of this BF and constrains .
4 CONCLUSIONS
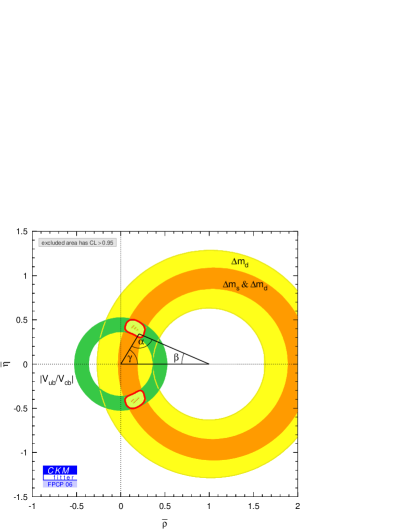
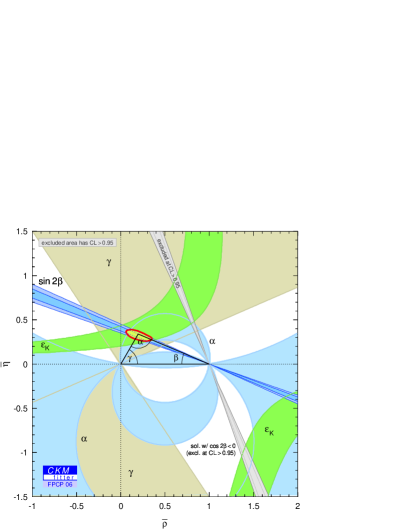
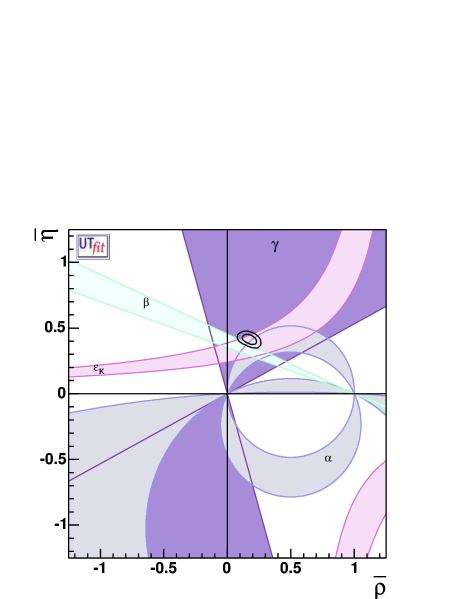
Figs. 8 and 9 show the CKM fitter results for the conserving and violating observables. The agreement is good in both cases. Fig. 10 shows the 1 and 2 contours of the UT fit results with the side measurements only versus the measurements of the single UT angles [30]. The small disagreement with the measurement is mostly due to inclusive measurements which are almost 3 away from the results of the fit performed without their inclusion. All other measurements are, presently, very consistent with each other and with the SM predictions.
5 ACKNOWLEDGEMENTS
I would like to thank the organizers of the BEACH conference for their help and gracious hospitality in Lancaster. I’d like also to acknowledge and apologize to all the physicists (theorists and experimentalists) whose work should be reported here, but could not be for lack of space.
References
- [1] M. Kobayashi and T. Maskawa, Prog. Theor. Phys. 49, 652 (1973).
- [2] Heavy Flavor Averaging Group (E. Barberio et al.), hep-ex/0603003.
- [3] D0 Collaboration (V. Abazov et al.), hep-ex/0603029, submitted to Phys. Rev. Lett.; CDF Collaboration (A. Abulencia et al.), Phys. Rev. Lett. 97, 062003 (2006).
- [4] CKMfitter Group (J. Charles et al.), Eur. Phys. J. C 41, 1 (2005); updated results and plots available at http://ckmfitter.in2p3.fr.
- [5] Belle Collaboration (D. Mohapatra et al.), Phys. Rev. Lett. 96, 221601 (2006).
- [6] BABAR Collaboration (B. Aubert et al.), Phys. Rev. Lett. 94, 011801 (2005).
- [7] Belle Collaboration (K. Abe et al.), hep-ex/0509013 and hep-ex/0508056.
- [8] O. Buchmueller, H. Flaecher, Phys. Rev. D 73, 073008(2006); P. Gambino, N. Uraltsev, Eur. Phys. J. C 34, 181 (2004).
- [9] BABAR Collaboration (B. Aubert et al.), hep-ex/0507001; DELHI Collaboration (J. Abdallah et al.), Eur. Phys. J. C 45, 35 (2006).
- [10] BABAR Collaboration (B. Aubert et al.), Phys. Rev. D 73, 012006 (2006); Belle Collaboration (A. Limosani et al.), Phys. Lett. B 621, 28 (2005) ; CLEO Collaboration (A. Bornheim et al.), Phys. Rev. Lett. 88, 231803 (2002).
- [11] S. W. Bosch, B. O. Lange, M. Neubert, G. Paz, Nucl. Phys. B 699, 335 (2004).
- [12] BABAR Collaboration (B. Aubert et al.), hep-ex/0507017; Belle Collaboration (I. Bizjak et al.), Phys. Rev. Lett. 95, 241801 (2005).
- [13] B. 0. Lange, M. Neubert, G. Paz, Phys. Rev. D 72, 073006 (2005) .
- [14] J. R. Andersen and E. Gardi, JHEP 0601, 097 (2006).
- [15] A. Leibovich, I. Low, I. Rothstein, Phys. Lett. B 486, 86 (2000).
- [16] M. Neubert, Phys. Rev. D 49, 3392 (1994).
- [17] BABAR Collaboration (B. Aubert et al.), Phys. Rev. Lett. 96, 221801(2006).
- [18] P. Ball and R. Zwicky, Phys. Rev. D 71, 014015 (2005); M. Okamoto, hep-lat/0409116; E. Gulez et al., Phys. Rev. D 73, 074502 (2006); A. Abada et al., Nucl. Phys. B 619, 565 (2001).
- [19] S. Hashimoto et al, Phys. Rev. D 66, 014503 (2002); I. Caprini, L. Lellouch, M. Neubert, Nucl. Phys. B 530, 153 (1998).
- [20] BABAR Collaboration (B. Aubert et al.), hep-ex/0602023; CLEO Collaboration (J. E. Duboscq et al.), Phys. Rev. Lett. 76, 3898 (1996).
- [21] BABAR Collaboration (B. Aubert et al.), Phys. Rev. D 72, 051102 (2005) and Phys. Rev. D 68, 072003 (2003).
- [22] CLEO Collaboration (N. E. A. Isgur et al.), Phys. Rev. D 68, 012004 (2003); D. Scora, N. Wise, Phys. Rev. D 52, 2783 (1995).
- [23] BABAR Collaboration (B. Aubert et al.), hep-ex/0506064 and hep-ex/0506065; Belle Collaboration (K. Abe et al.), hep-ex/0508018 and hep-ex/0604024.
- [24] Charge conjugate states are also implied.
- [25] BABAR Collaboration (B. Aubert et al.), hep-ex/0507085.
- [26] Belle Collaboration (K. Ikado et al.), hep-ex/0604018 submitted to Phys. Rev. D.
- [27] The BF measurement has subsequently been revised at ICHEP 2006; see T. Browder’s talk, the new value being .
- [28] HPQCD Collaboration (A. Gray et al.), Phys. Rev. Lett. 95, 212001 (2005).
- [29] BABAR Collaboration (B. Aubert et al.), Phys. Rev. D 73, 057101 (2006).
- [30] UTfit Collaboration (M. Bona et al.), hep-ph/0606167.