Search for Excited and Exotic Muons at CDF
Abstract
We present a search for the production of excited or exotic muons () via the reaction using pb-1 of data collected with the Run II CDF detector. In this signature-based search, we look for a resonance in the mass spectrum. The data are compared to standard model and detector background expectations, and with predictions of excited muon production. We use these comparisons to set limits on the mass and compositeness scale in contact interaction and gauge-mediated models.
Keywords:
excited, exotic, muon:
12.60.Rc, 13.85.Qk, 14.60.Hi1 Introduction
In the standard model (SM), quarks and leptons are considered fundamental particles. An indication that quarks and leptons are composite particles would be the observation of their excited states baur . Additionally, when the standard model is embedded in larger symmetry groups, exotic fermions are predicted hewett . We search for singly produced excited and exotic muons where the decays in the channel, resulting in a final state signature. The signal is fully-reconstructible with low background expectation.
2 Excited and Exotic Muon Models
We consider two models for excited and exotic muon production: a contact interaction (CI) model and a gauge mediated (GM) model. In the CI model, excited muon production is described by a four-fermion Lagragian of quarks to excited and SM muons baur . The CI cross sections depend on the mass and compositeness scale . The CI process is modeled by pythia pythia . The production of in the GM model is described by its coupling to gauge bosons gm . The GM cross sections depend on and , where is a phenomenological coupling constant. The programs lanhep lanhep and comphep comphep are used to calculate leading order GM cross sections and generate GM events. For both models, the decays are prescribed by the GM Lagrangian cdfestar .
3 Dataset and Signal Selection
We use pb-1 of data collected with the high muon trigger at CDF from February 2002 through September 2004. We search for events consisting of two muons and a photon. The isolated muons must have GeV/ and be located in the central portion of the detector (), with at least one detected in the muon chamber. Muons are identified by their minimum-ionizing particle properties. The isolated photon must have GeV, can be located in the central or forward region, and is identified by its electromagnetic shower properties. In addition, we veto events with GeV/, to remove events produced by initial-state radiation (ISR) .
4 Total Signal Acceptance
The total signal acceptance is measured using the geantgeant -based CDF detector simulation. The CI total signal acceptance increases from 13% at GeV/ to an asymptotic value of 21% for GeV/. For the GM model, the total signal acceptance increases from 12% at GeV/ to 23% for GeV/.
5 Background Estimates and Data Observations
The signature can be produced by several standard model and detector sources: (1) ; (2) ; (3) , where a jet is misreconstructed as a photon; (4) , where a fermion radiates a hig- photon; (5) and , where an electron is misidentified as a photon. The primary background is modeled using the zgamma program zgamma . The is estimated using data. The total background prediction is events ( combinations). In our ISR control region, GeV/ and GeV, we predict and observe 5 events.
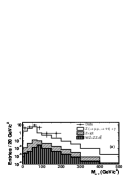
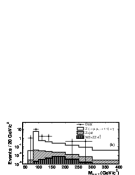
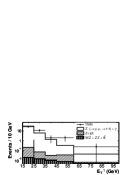
In the signal region, we observe 17 events with a background prediction of events. The background prediction and data are shown as a function of in Figure 1(a). Several studies were done to understand the observed excess. The background, where the is produced via final-state radiation (FSR), is defined by GeV/. In this region, we observe 11 events with a prediction of events, as shown in Figure 1(b). As a check, we lower the cut to 15 GeV and observe 43 events, with a prediction of events, as shown in Figure 2. These studies indicate that the excess at low mass is consistent with an upward statistical fluctuation, primarily in FSR. There is no excess at high mass to indicate new physical processes.
6 Limits and Exclusion Regions
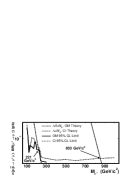
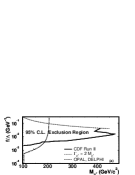
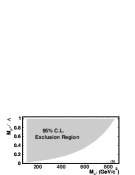
A Bayesian approach is used to obtain the upper limits on the experimental cross section at the 95% confidence level (C.L.). For () in the CI (GM) model, masses below 853 GeV/ (221 GeV/) are excluded, as shown in Figure 3. Because the GM exotic muon cross section depends on both and , we plot the two-dimensional exclusion region in Figure 4(a). The excited muon CI model is valid for ; we plot the CI exclusion region in the plane in 4(b).
7 Conclusion
We have presented a search for excited and exotic muons in the channel. No evidence of a signal is found. Limits on the excited muon mass are established based on a contact interaction and a gauge-mediated model, the latter of which are the first limits at a hadron collider.
References
- (1) U. Baur, M. Spira, and P. M. Zerwas, Phys. Rev. D 42, 815 (1990), and references therein.
- (2) J.L. Hewett and T.G. Rizzo, Phys. Rep. 183, 193 (1989), and references therein.
- (3) T. Sjstrand, Comput. Phys. Commun. 82, 74 (1994), version 6.127. We divide the production cross section calculated by pythia v6.127 by a factor of 2, to be consistent with pythia v6.211, as described in the pythia release notes.
- (4) K. Hagiwara, S. Komamiya, and D. Zeppenfeld, Z. Phys. C 29, 115 (1985), and references therein; E. Boos et al., Phys. Rev. D 66, 013011 (2002), and references therein.
- (5) A. V. Semenov, hep-ph/0208011 (2002); A. V. Semenov, Comput. Phys. Commun. 115, 124 (1998).
- (6) A. Pukhov et al., hep-ph/9908288 (1999); E. E. Boos et al., hep-ph/9503280 (1995).
- (7) D. Acosta et al. (CDF Collaboration), Phys. Rev. Lett. 94, 101802 (2005).
- (8) R. Brun and F. Carminati, CERN Program Library Long Writeup, W5013, 1993 (unpublished), version 3.15.
- (9) U. Baur and E. L. Berger, Phys. Rev. D 47, 4889 (1993).
- (10) G. Abbiendi et al. (OPAL Collaboration), Phys. Lett. B 544, 57 (2002); J. Abdallah et al. (DELPHI Collaboration), Eur. Phys. J. C 46 , 277 (2006).